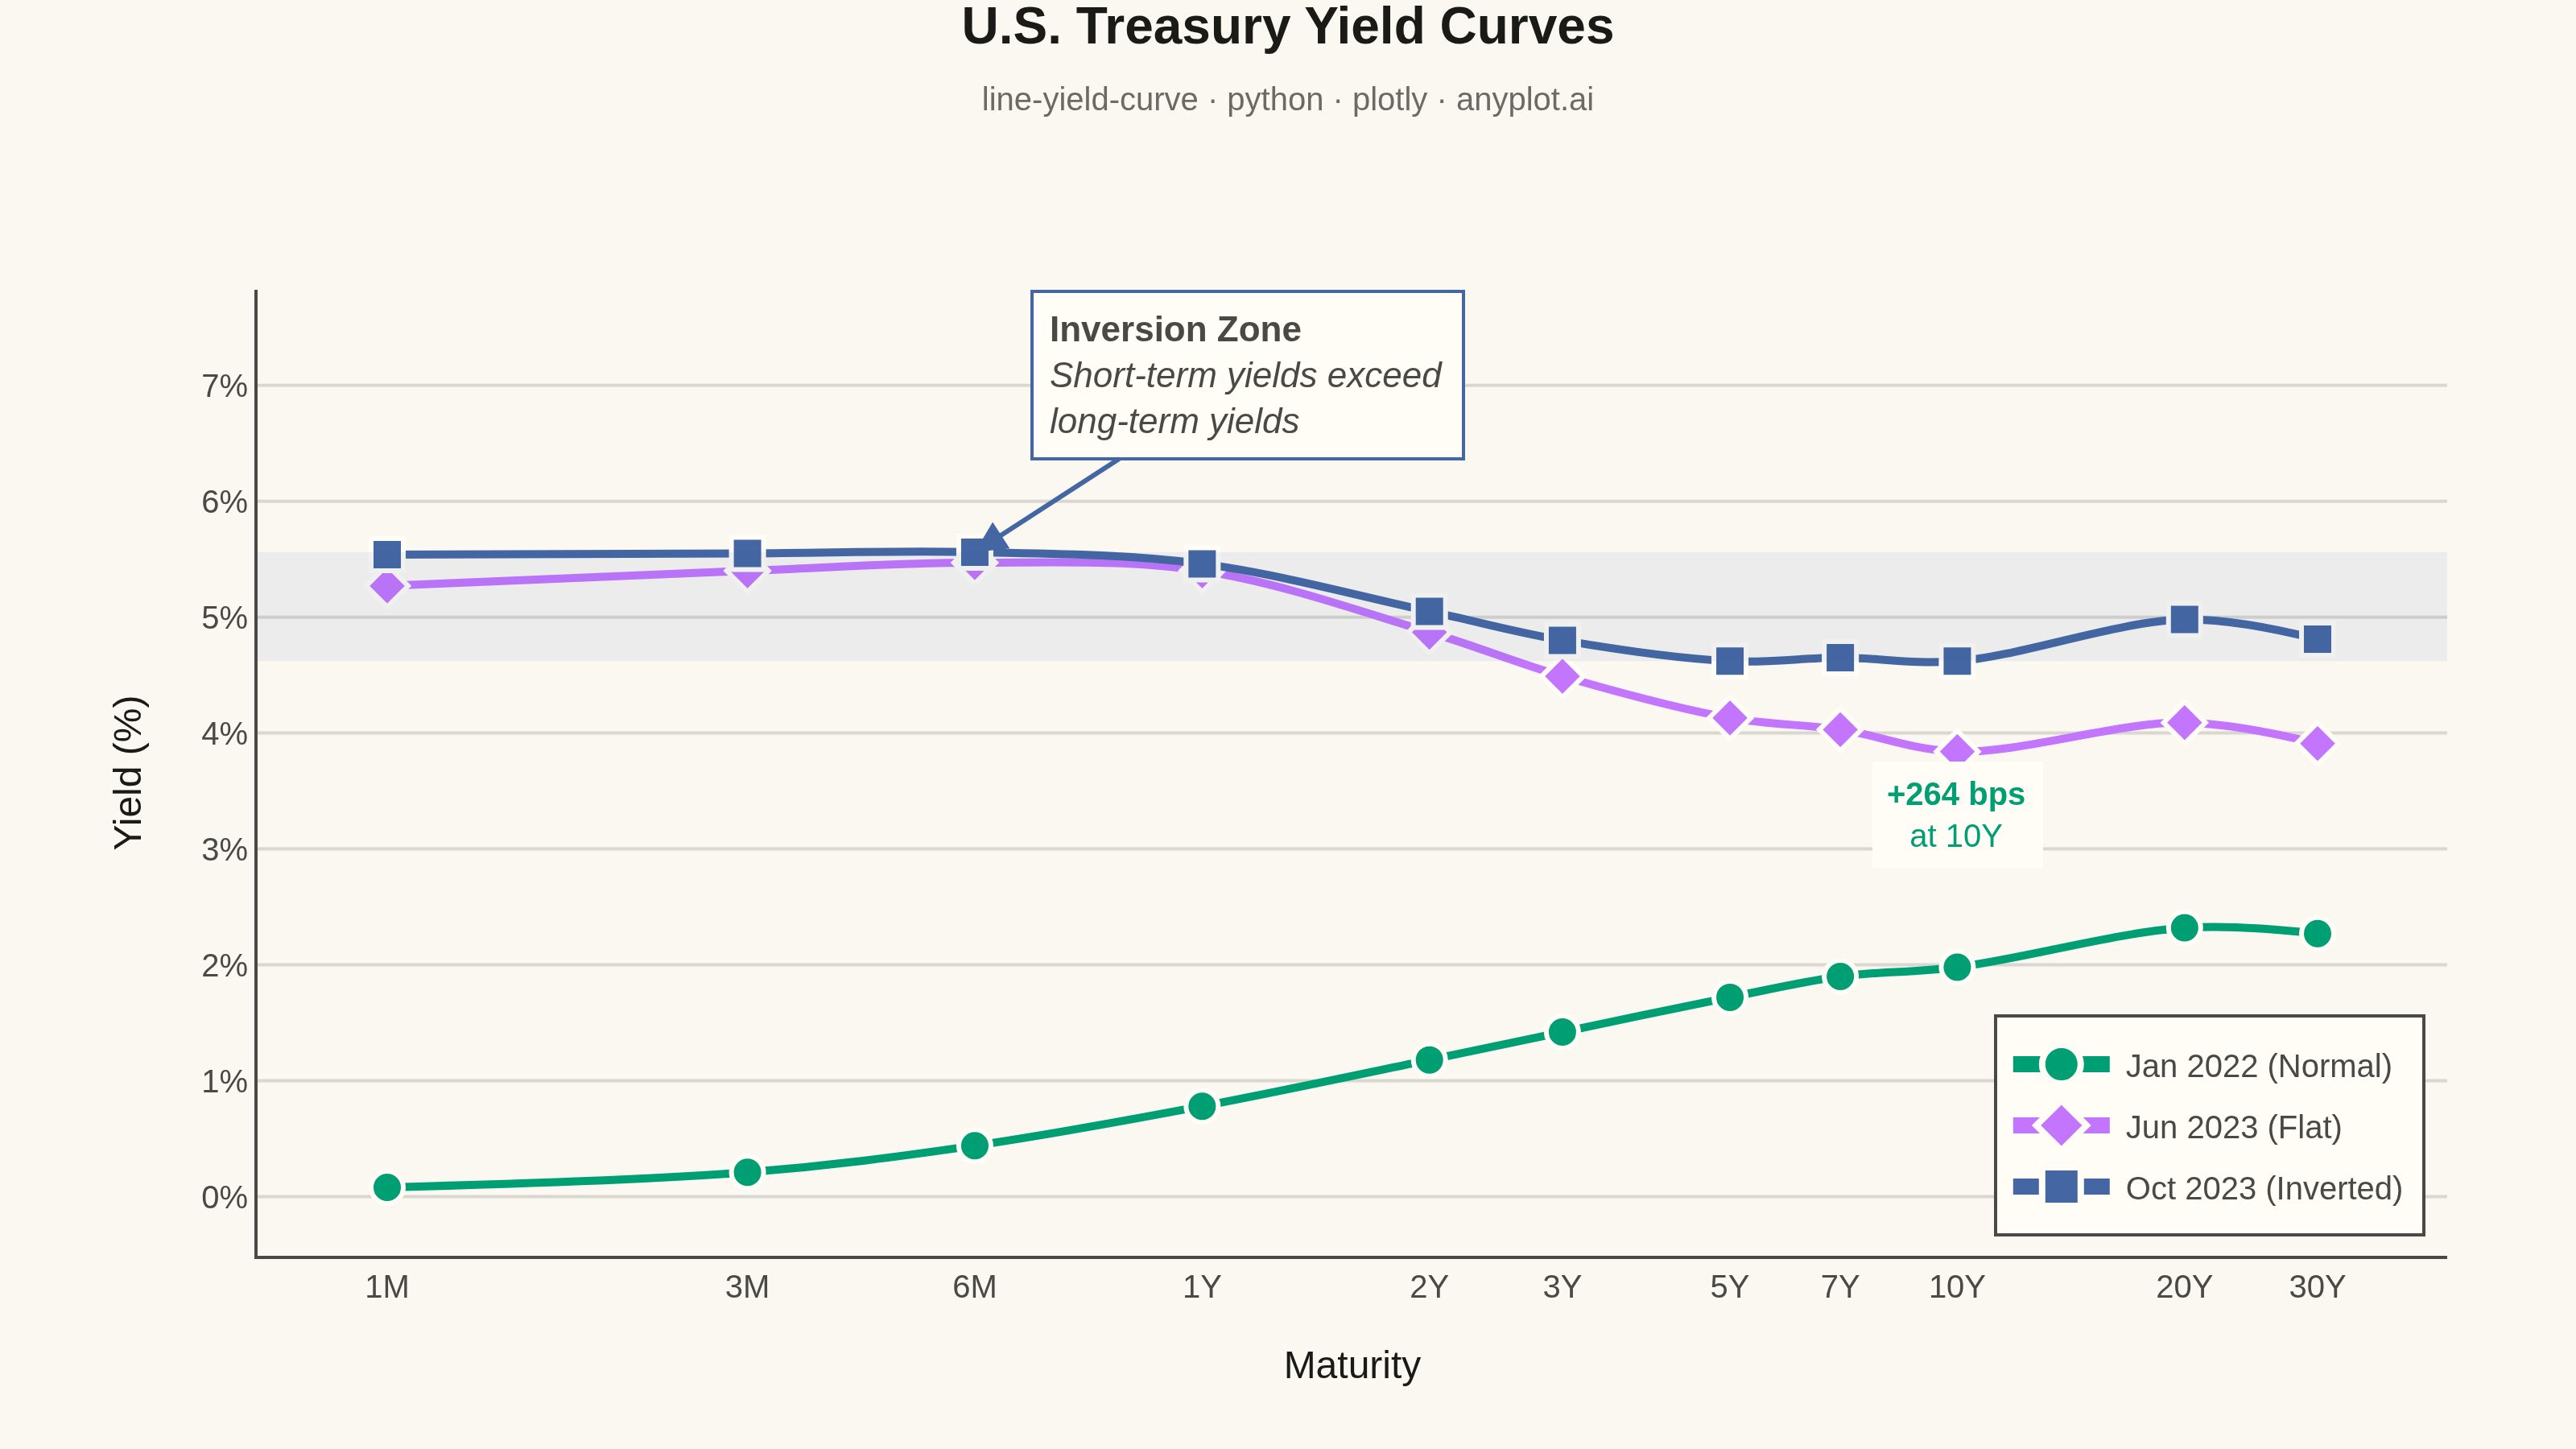
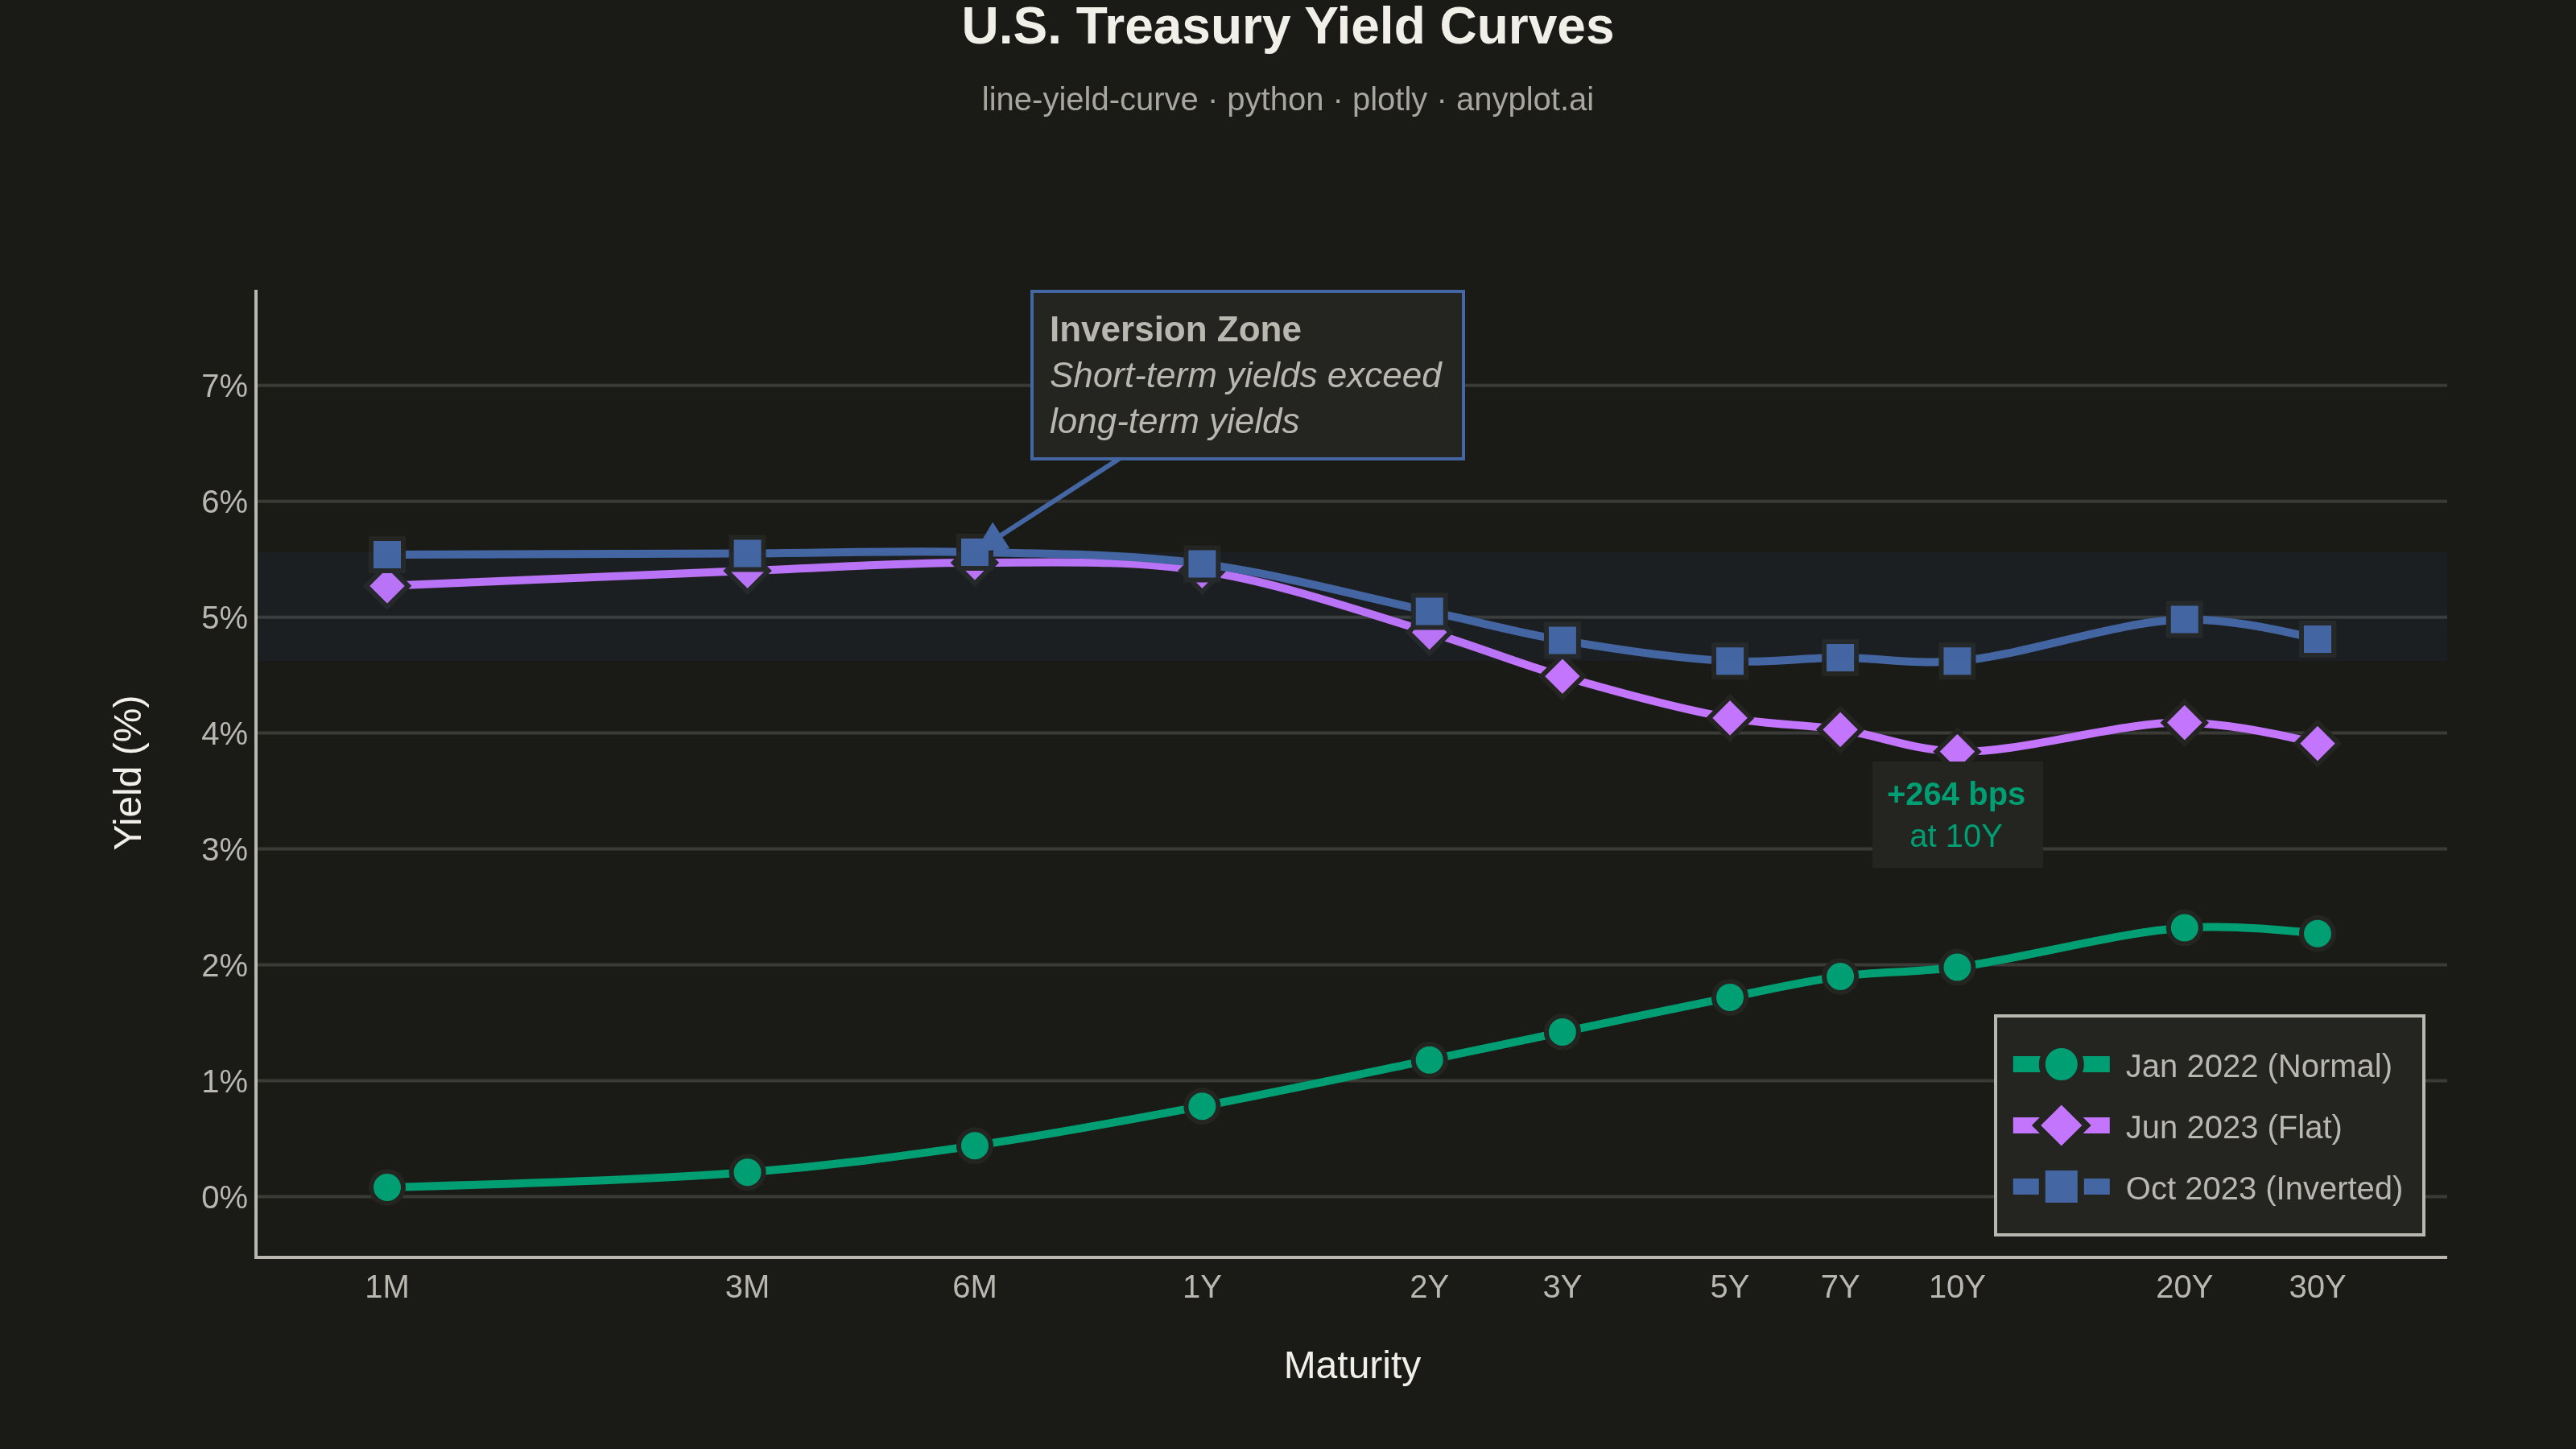
A yield curve plots interest rates (yields) of bonds against their maturities, from short-term (e.g., 1 month) to long-term (e.g., 30 years). It is one of the most iconic charts in macroeconomics and finance, used to assess market expectations for future interest rates, economic growth, and inflation. An inverted yield curve (where short-term rates exceed long-term rates) is a widely followed recession indicator. The plot should support displaying multiple curves (e.g., different dates) on the same axes to show how the term structure evolves over time.
Preview render from the Plotly implementation.