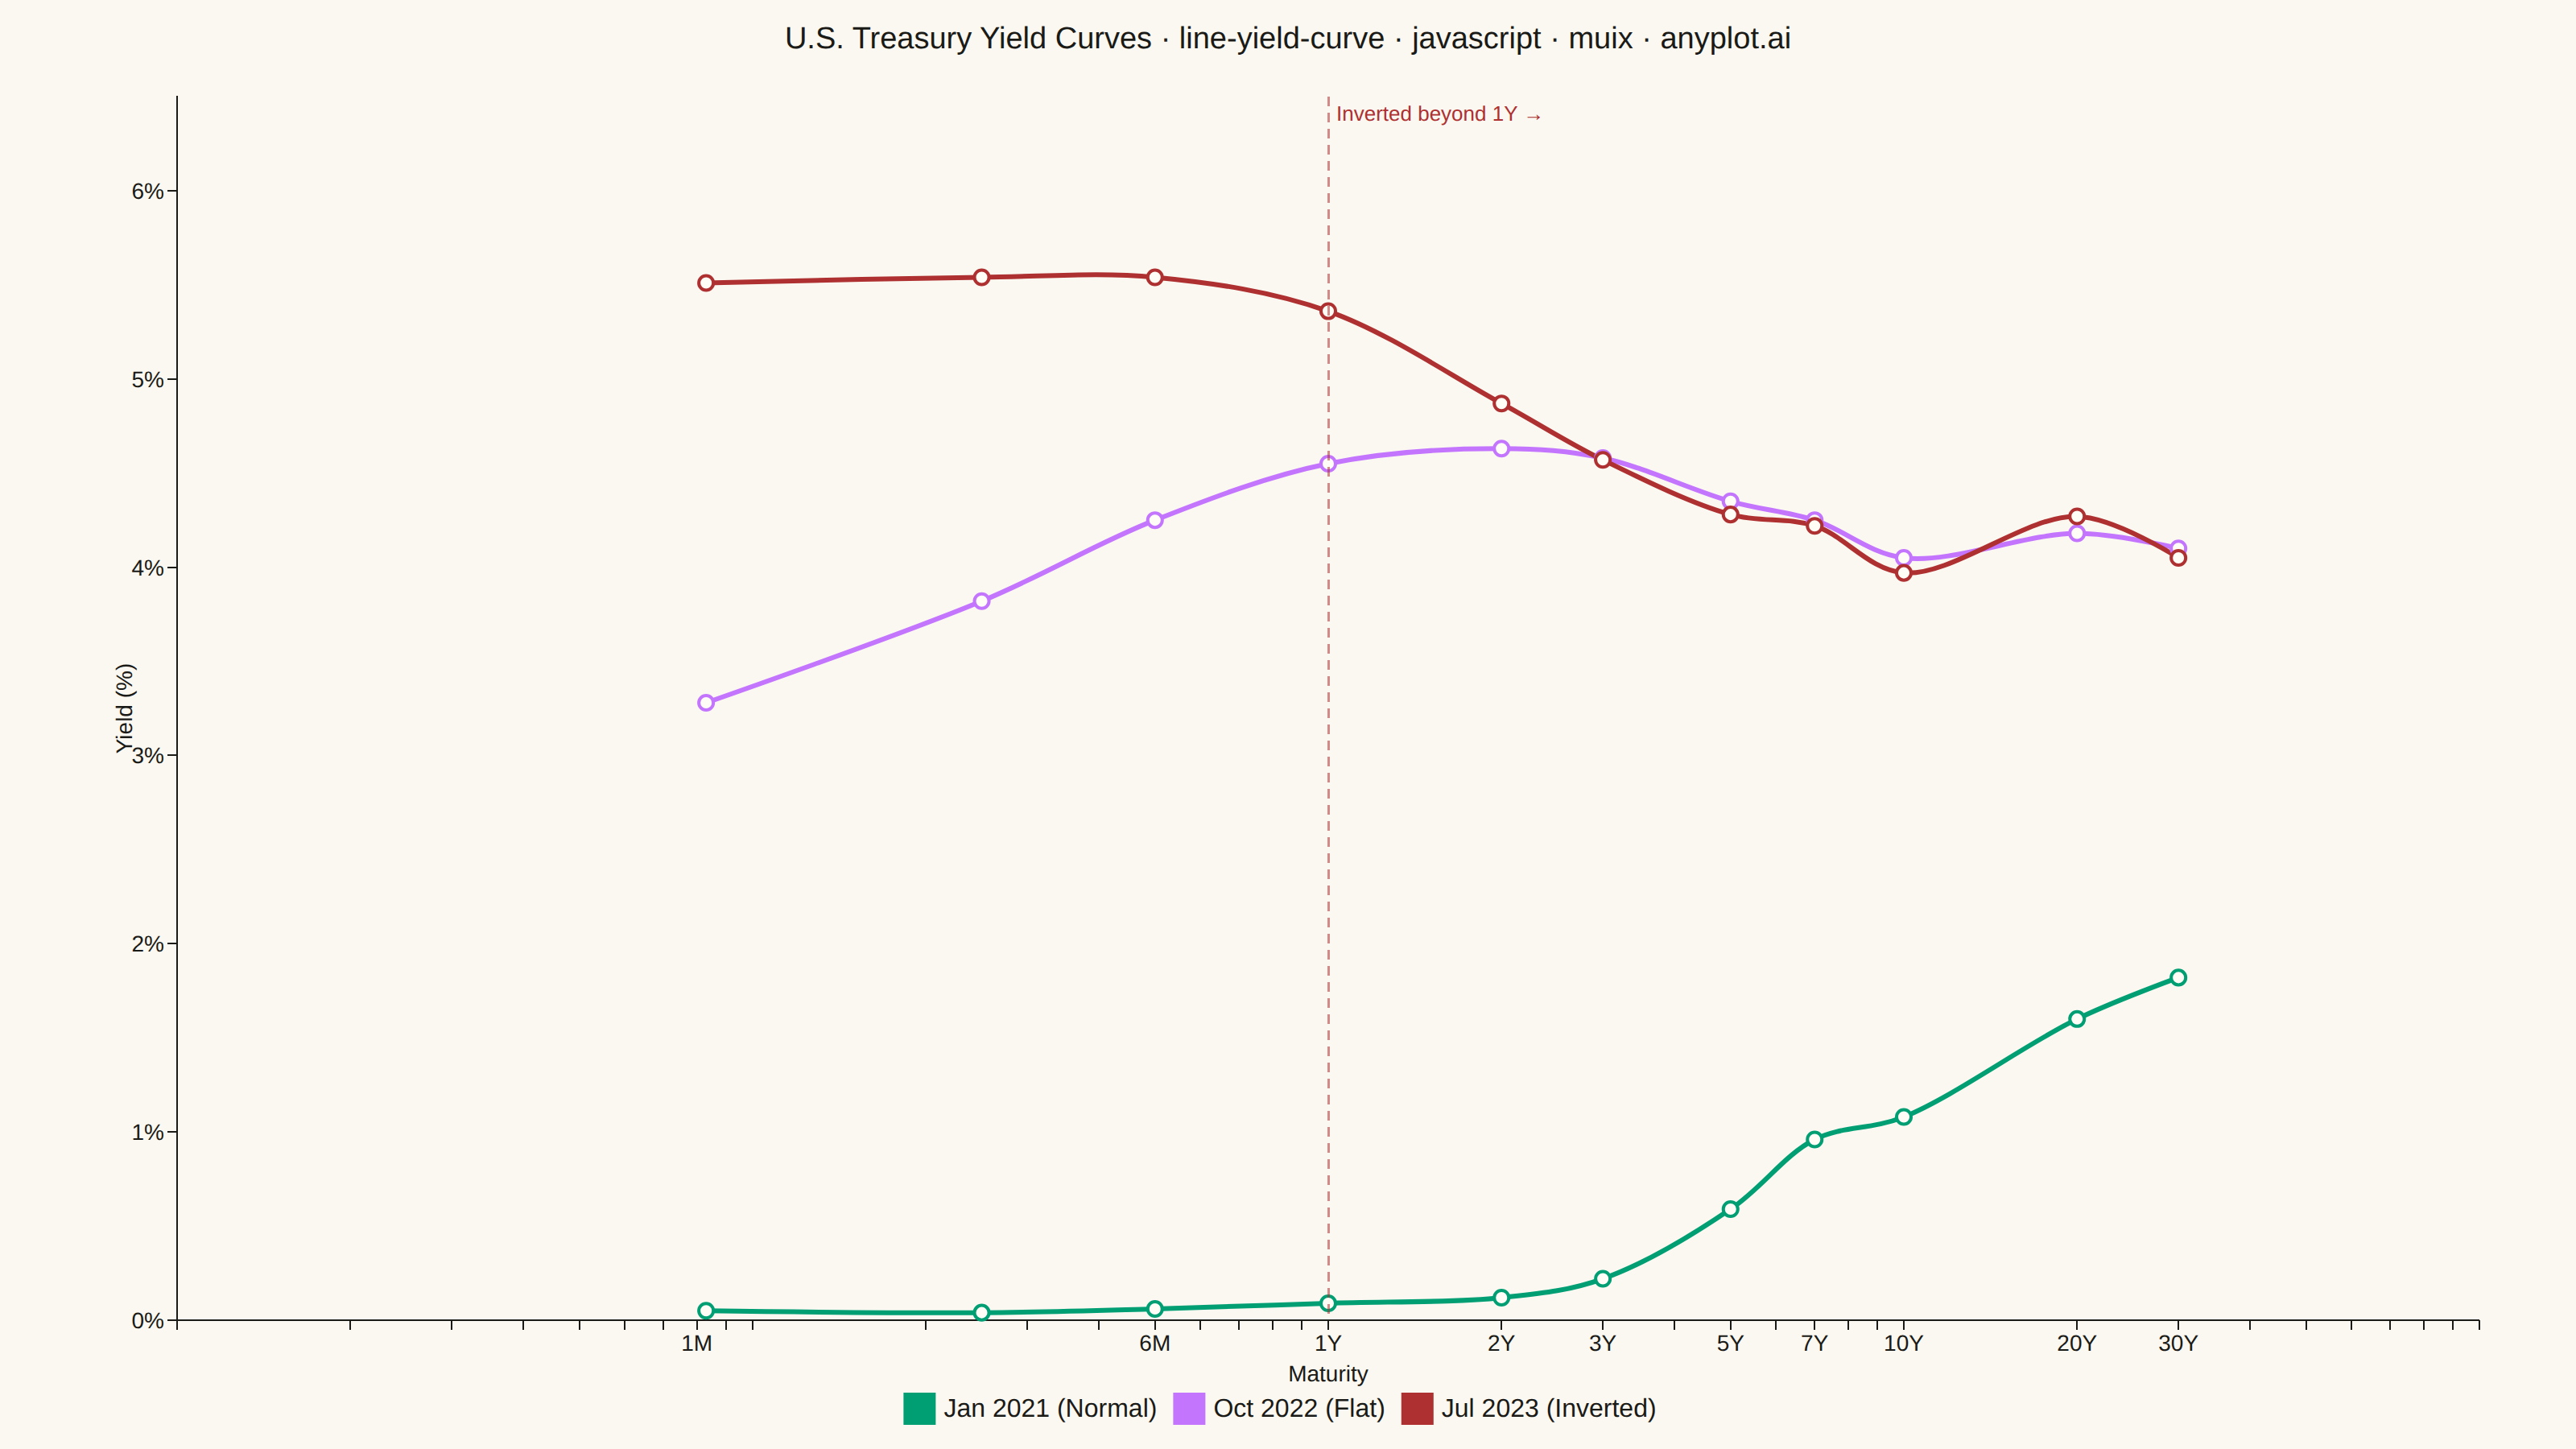
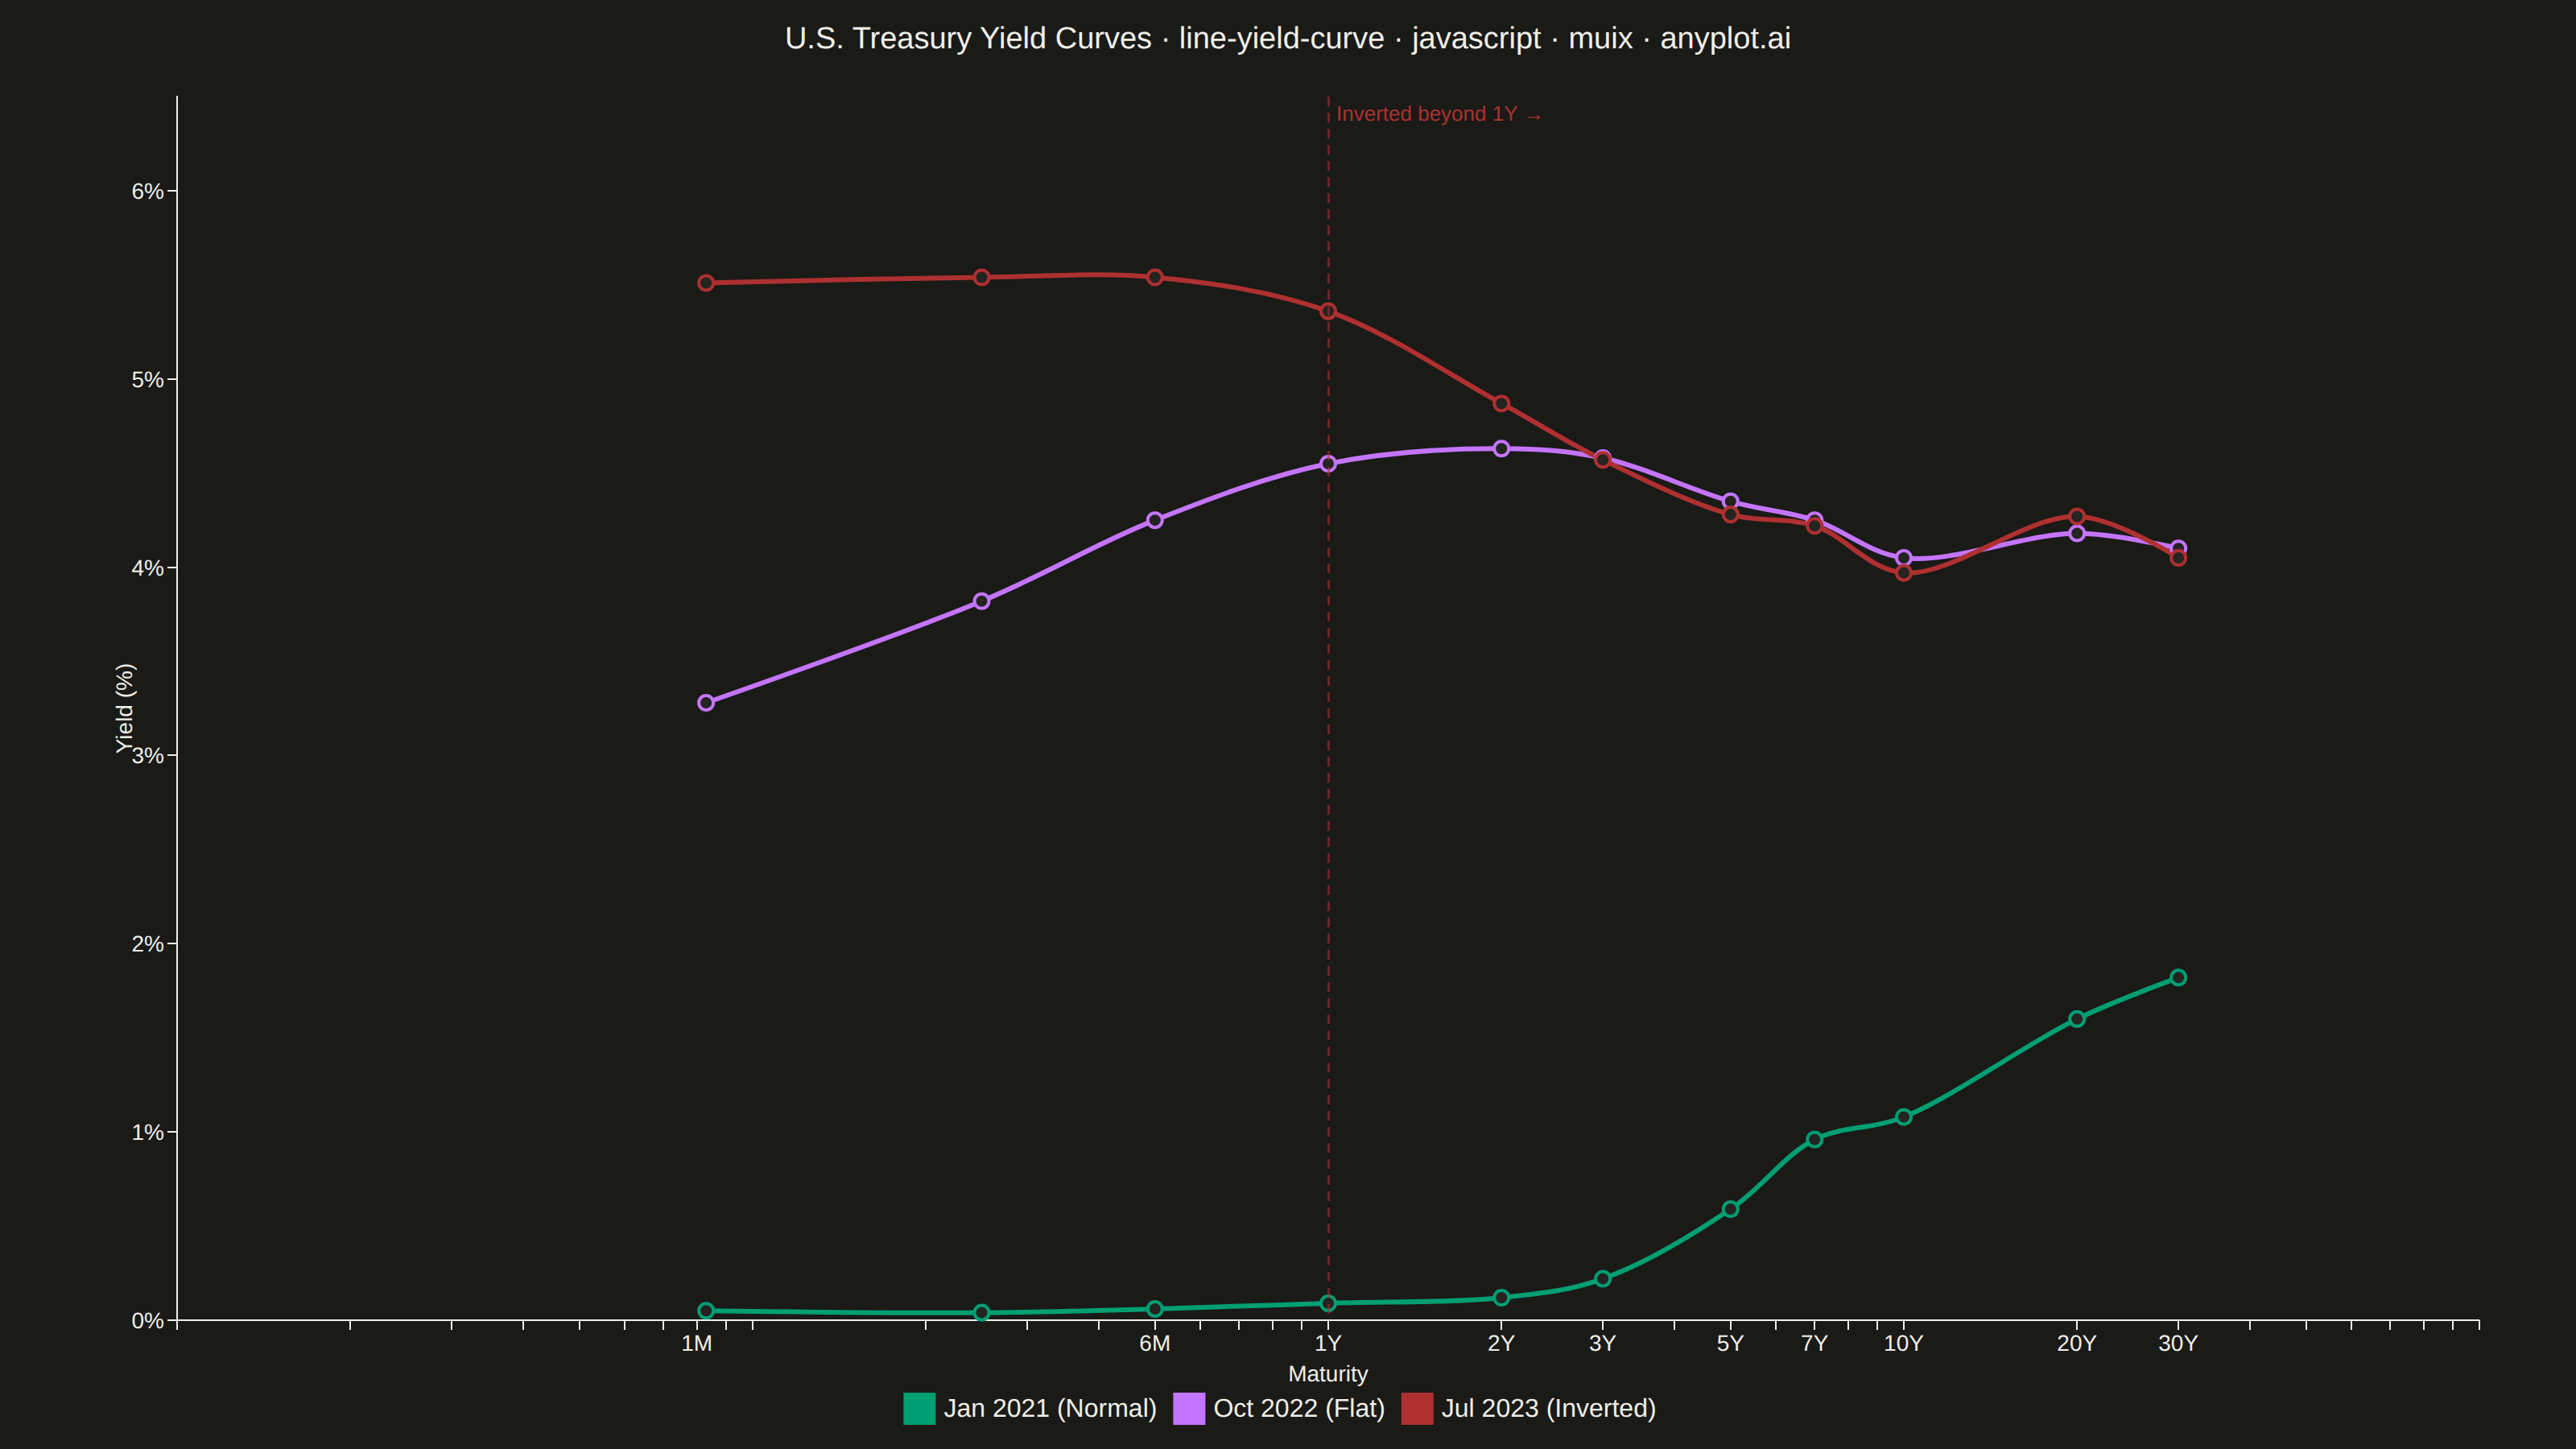
The same plot in 14 other libraries — JavaScript: Chart.js, D3.js, Apache ECharts, Highcharts; Python: Altair, Bokeh, lets-plot, Matplotlib, Plotly, plotnine, Pygal, Seaborn; R: ggplot2; Julia: Makie.jl. Compare all 15 side by side: Yield Curve (Interest Rate Term Structure) in Python, R, Julia and JavaScript.
A yield curve plots interest rates (yields) of bonds against their maturities, from short-term (e.g., 1 month) to long-term (e.g., 30 years). It is one of the most iconic charts in macroeconomics and finance, used to assess market expectations for future interest rates, economic growth, and inflation. An inverted yield curve (where short-term rates exceed long-term rates) is a widely followed recession indicator. The plot should support displaying multiple curves (e.g., different dates) on the same axes to show how the term structure evolves over time.
// anyplot.ai
// line-yield-curve: Yield Curve (Interest Rate Term Structure)
// Library: muix 7.29.1 | JavaScript 22.23.3
// Quality: 87/100 | Updated: 2026-10-09
//# anyplot-orientation: landscape

import { LineChart } from "@mui/x-charts/LineChart";
import { useDrawingArea, useXScale } from "@mui/x-charts/hooks";

const t = window.ANYPLOT_TOKENS;

// Maturity axis — numeric years for log-scale spacing, labels for ticks
const maturityYears = [0.083, 0.25, 0.5, 1, 2, 3, 5, 7, 10, 20, 30];
const maturityLabels = ["1M", "3M", "6M", "1Y", "2Y", "3Y", "5Y", "7Y", "10Y", "20Y", "30Y"];

// Approximate U.S. Treasury par yields (%) — three eras of the term structure
const jun1993 = [3.0, 3.1, 3.2, 3.4, 3.9, 4.4, 5.2, 5.8, 5.9, 6.6, 6.8]; // Normal: early-1990s recovery
const mar2000 = [5.7, 5.9, 6.1, 6.3, 6.5, 6.4, 6.3, 6.3, 6.2, 6.3, 5.9]; // Humped: dot-com peak
const jan2007 = [5.2, 5.2, 5.1, 5.0, 4.8, 4.7, 4.7, 4.8, 4.8, 5.0, 4.9]; // Inverted: pre-crisis

// Shaded band over the maturities where the Jan 2007 short end sits above its 5Y yield
function InversionBand() {
  const xScale = useXScale();
  const { top, height } = useDrawingArea();
  const x0 = xScale(maturityYears[0]);
  const x1 = xScale(5);
  return (
    <g pointerEvents="none">
      <rect x={x0} y={top} width={x1 - x0} height={height} fill={t.palette[4]} fillOpacity={0.1} />
      <text x={(x0 + x1) / 2} y={top + 24} textAnchor="middle" fontSize={15} fontWeight={500} fill={t.ink}>
        Inversion: short-term yields above long-term
      </text>
    </g>
  );
}

export default function Chart() {
  return (
    <div style={{ width: "100%", height: "100%", position: "relative" }}>
      <div
        style={{
          position: "absolute",
          top: 14,
          left: 0,
          right: 0,
          textAlign: "center",
          zIndex: 1,
          fontSize: 22,
          fontWeight: 500,
          color: t.ink,
          pointerEvents: "none",
          fontFamily: "'Roboto', 'Helvetica', 'Arial', sans-serif",
        }}
      >
        U.S. Treasury Yield Curves · line-yield-curve · javascript · muix · anyplot.ai
      </div>

      <LineChart
        width={window.ANYPLOT_SIZE.width}
        height={window.ANYPLOT_SIZE.height}
        skipAnimation
        grid={{ horizontal: true }}
        colors={[t.palette[0], t.palette[1], t.palette[4]]}
        xAxis={[
          {
            scaleType: "log",
            data: maturityYears,
            tickInterval: maturityYears,
            min: 0.06,
            max: 40,
            valueFormatter: (v) => {
              const idx = maturityYears.findIndex((y) => Math.abs(y - v) < 0.005);
              return idx >= 0 ? maturityLabels[idx] : "";
            },
            label: "Maturity",
          },
        ]}
        yAxis={[
          {
            label: "Yield (%)",
            min: 0,
            max: 7.5,
            tickMinStep: 1,
            valueFormatter: (v) => `${v}%`,
          },
        ]}
        series={[
          { data: jun1993, label: "Jun 1993 (Normal)", showMark: true, curve: "linear" },
          { data: mar2000, label: "Mar 2000 (Humped)", showMark: true, curve: "linear" },
          { data: jan2007, label: "Jan 2007 (Inverted)", showMark: true, curve: "linear" },
        ]}
        sx={{
          "& .MuiChartsAxis-label": { fontSize: "16px !important" },
          "& .MuiChartsAxis-left .MuiChartsAxis-label": { transform: "translateX(-24px)" },
          "& .MuiChartsAxis-tickLabel": { fontSize: "14px !important" },
          "& .MuiChartsLegend-label": { fontSize: "15px !important" },
          "& .MuiChartsGrid-line": { strokeOpacity: 0.25 },
          "& .MuiLineElement-root": { strokeWidth: "3px" },
        }}
        slotProps={{
          legend: {
            direction: "row",
            position: { vertical: "bottom", horizontal: "middle" },
          },
        }}
        margin={{ top: 60, right: 60, bottom: 80, left: 110 }}
      >
        <InversionBand />
      </LineChart>
    </div>
  );
}
Runnable source as JSON, for any HTTP client: https://api.anyplot.ai/specs/line-yield-curve/muix/code. Any spec id and library id listed in llms-full.txt fit the same URL shape; every URL below is complete and callable.
{
  "spec_id": "line-yield-curve",
  "language": "javascript",
  "library": "muix",
  "page": "https://anyplot.ai/line-yield-curve/javascript/muix",
  "hub": "https://anyplot.ai/line-yield-curve",
  "code_json": "https://api.anyplot.ai/specs/line-yield-curve/muix/code",
  "spec_json": "https://api.anyplot.ai/specs/line-yield-curve",
  "render_light_png": "https://storage.googleapis.com/anyplot-images/plots/line-yield-curve/javascript/muix/plot-light.png",
  "render_dark_png": "https://storage.googleapis.com/anyplot-images/plots/line-yield-curve/javascript/muix/plot-dark.png",
  "interactive_light_html": "https://storage.googleapis.com/anyplot-images/plots/line-yield-curve/javascript/muix/plot-light.html",
  "interactive_dark_html": "https://storage.googleapis.com/anyplot-images/plots/line-yield-curve/javascript/muix/plot-dark.html",
  "quality_score": 87.0,
  "license": "MIT",
  "guide": "https://anyplot.ai/llms.txt"
}
Part of Yield Curve (Interest Rate Term Structure) on anyplot.ai.