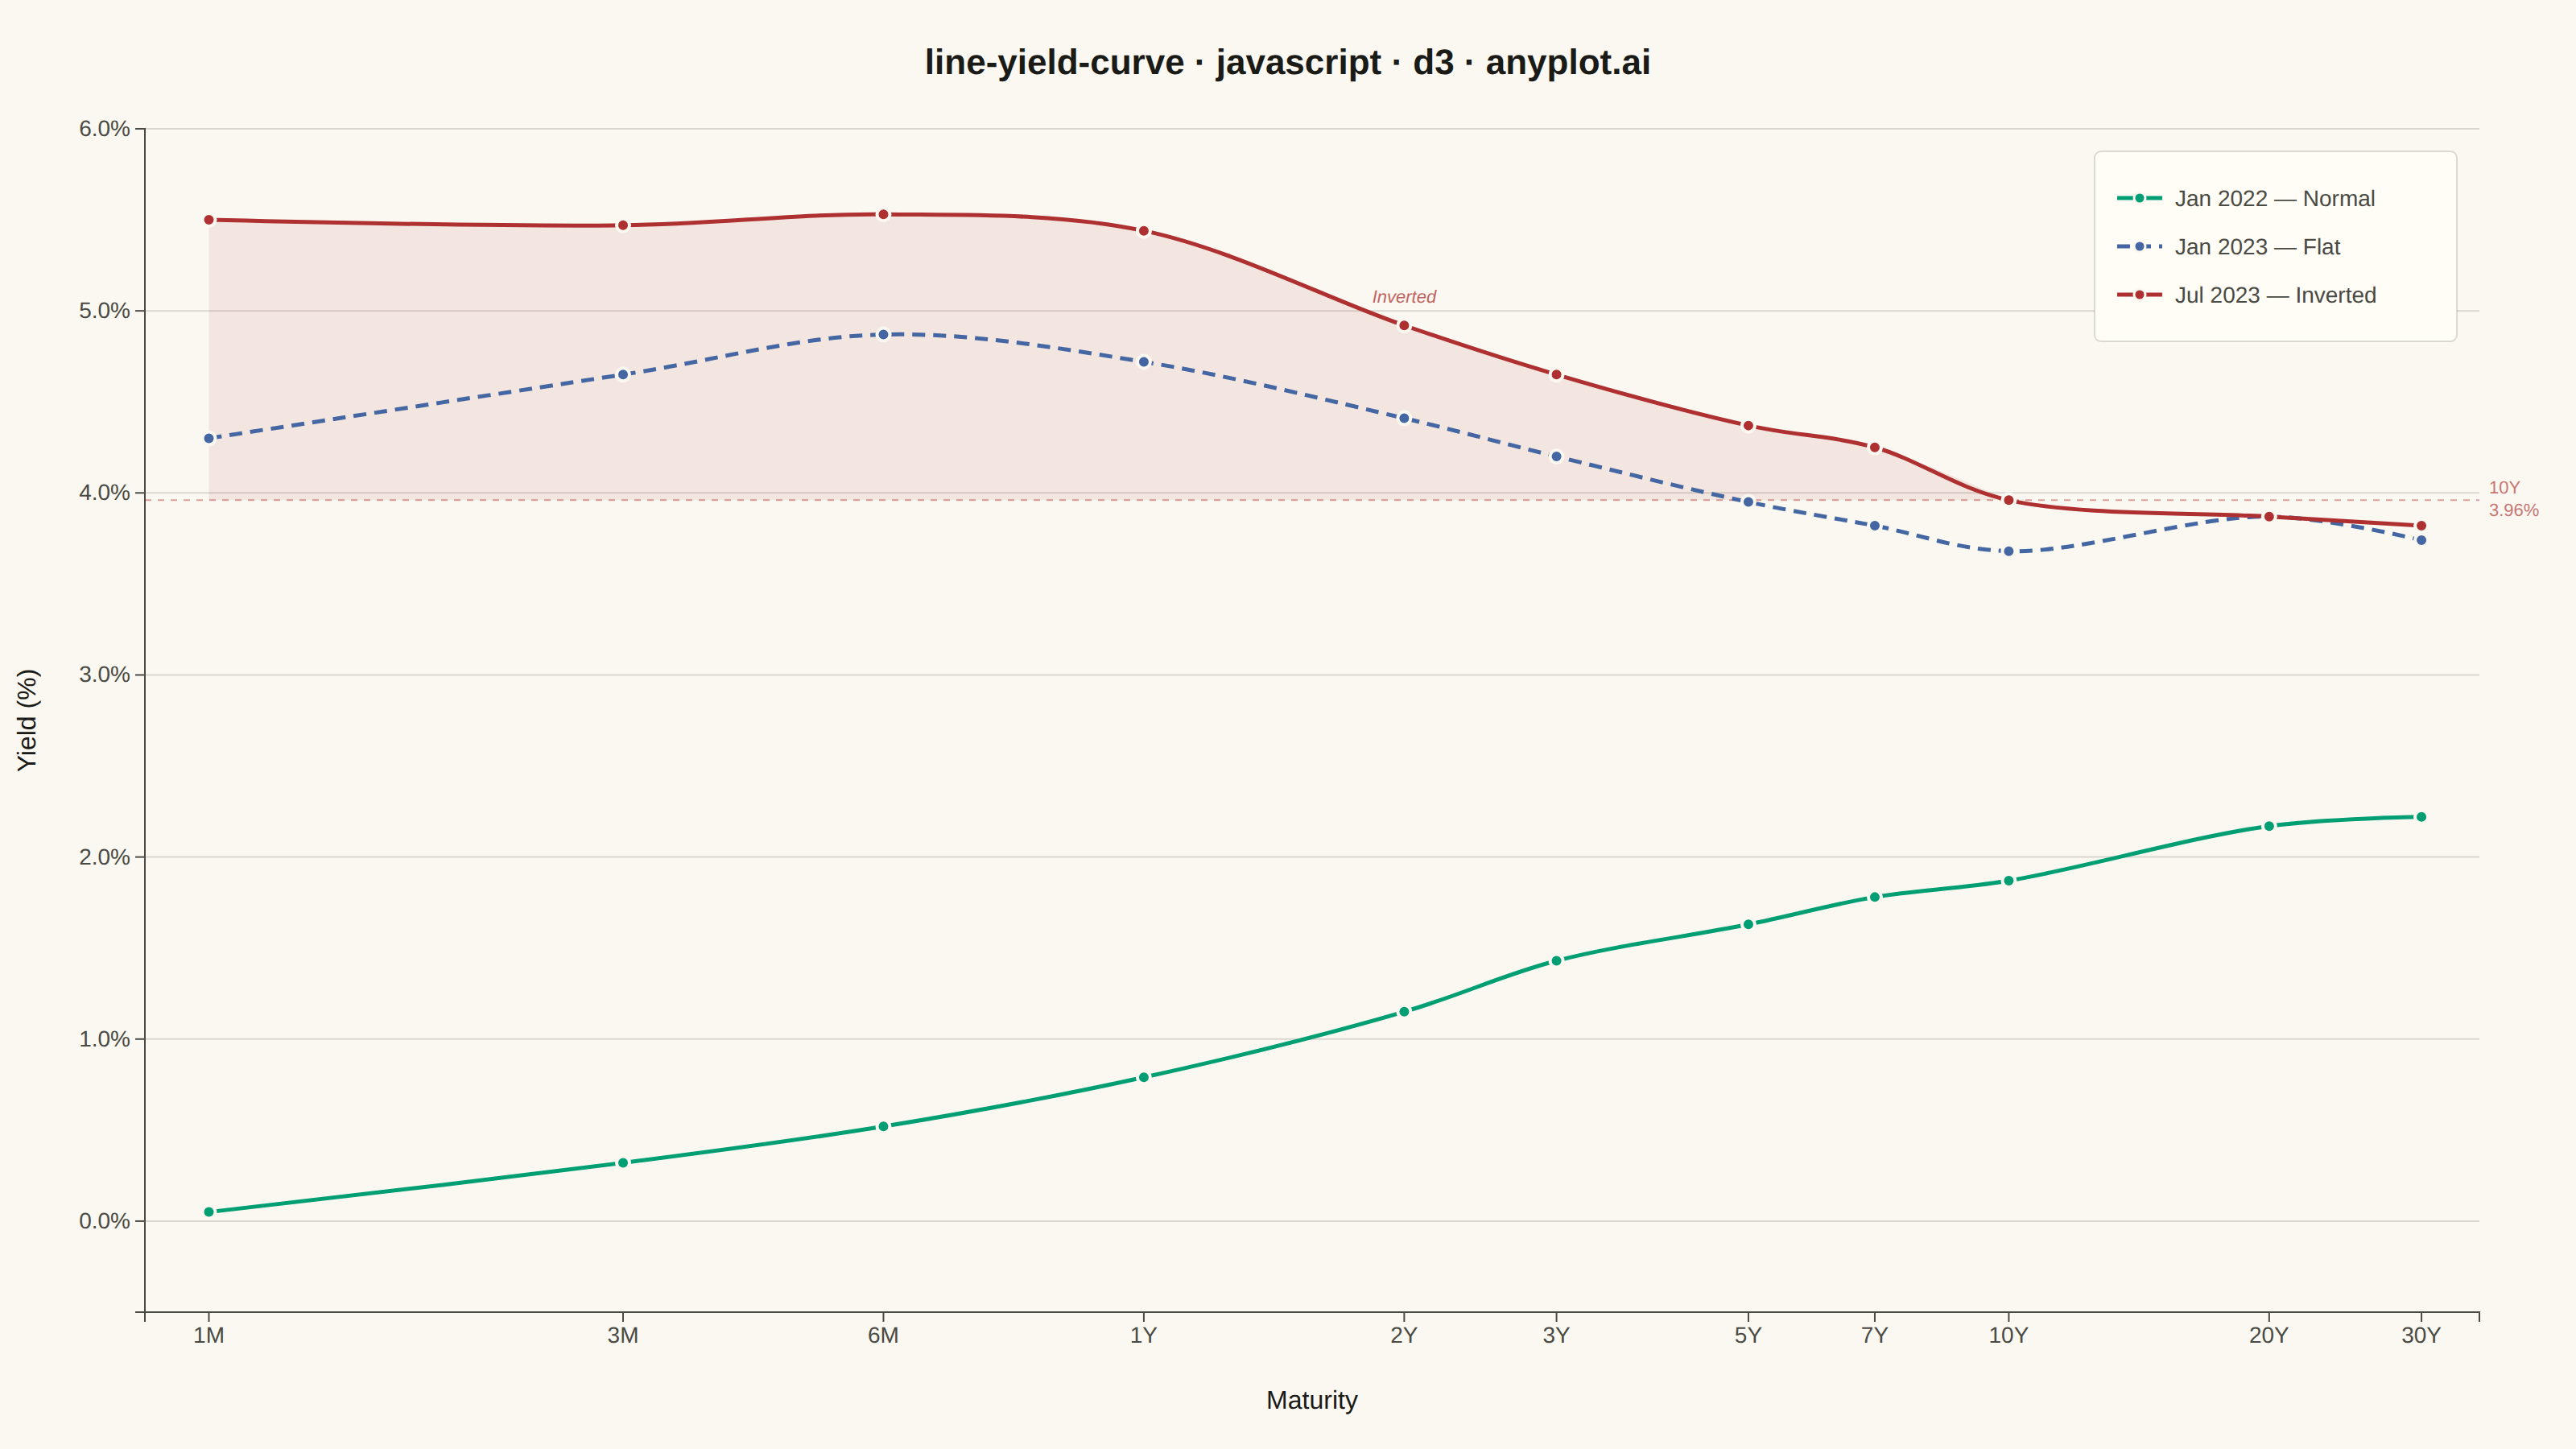
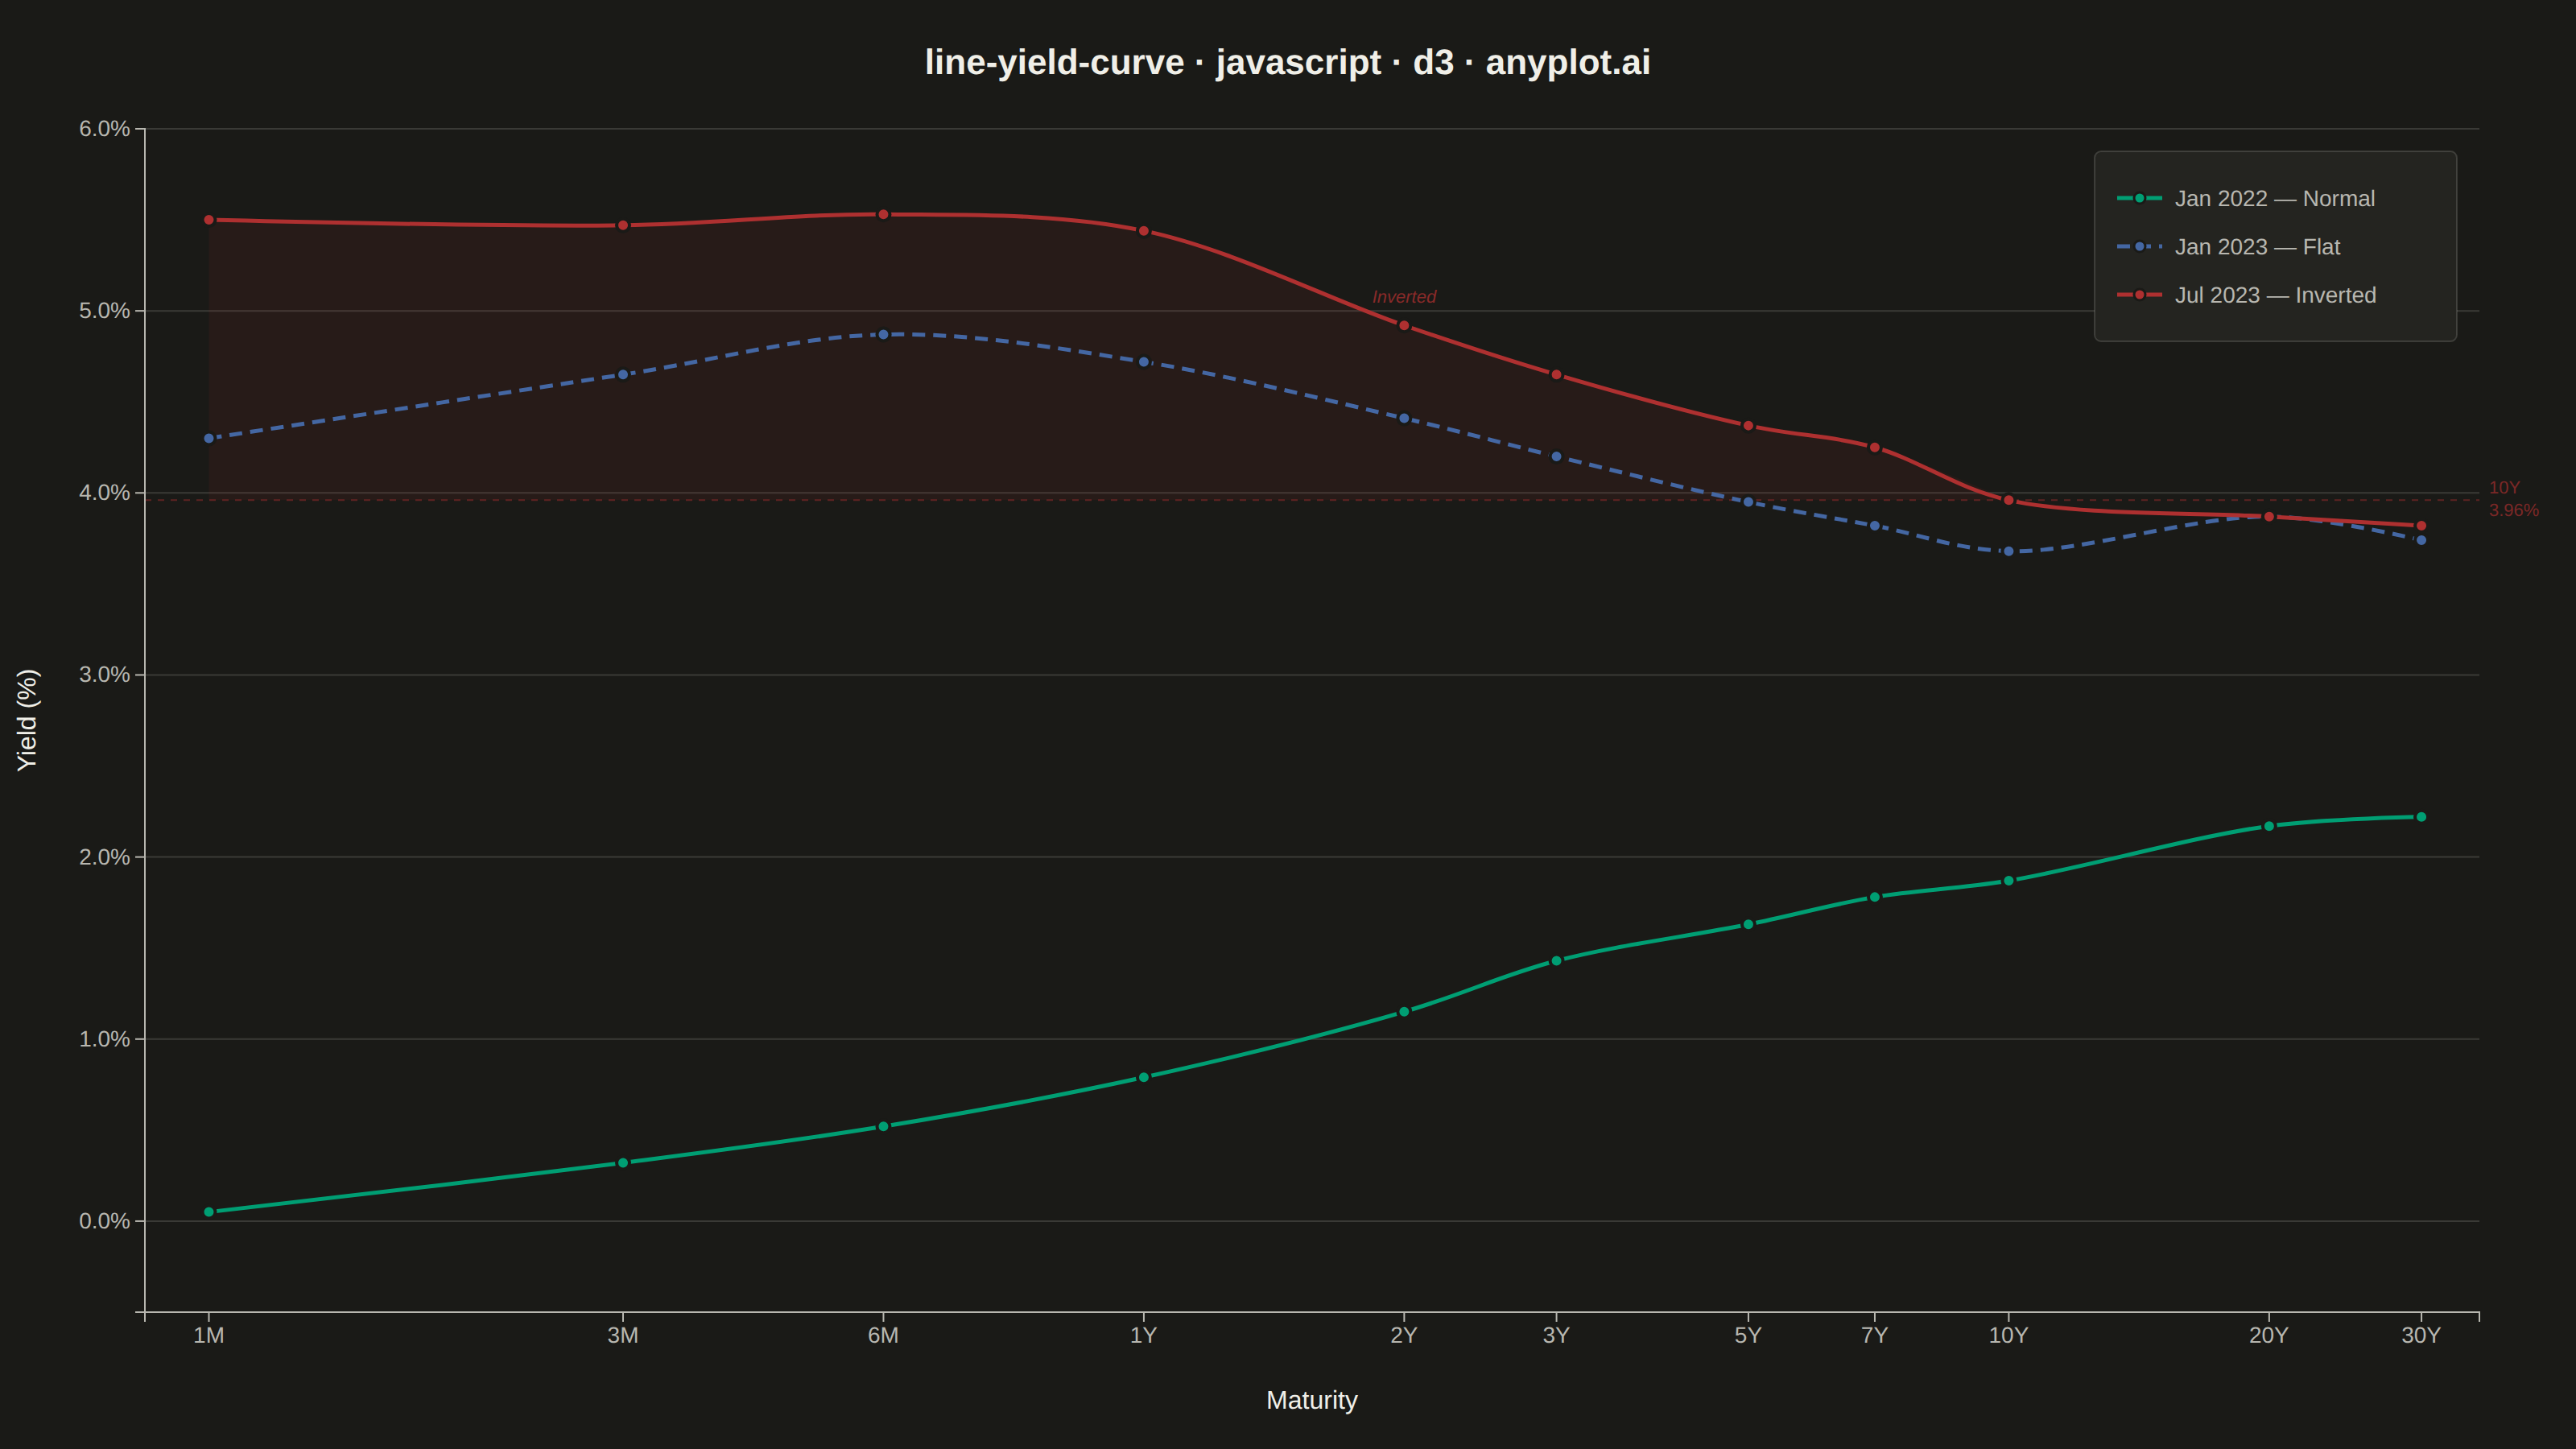
The same plot in 14 other libraries — JavaScript: Chart.js, Apache ECharts, Highcharts, MUI X Charts; Python: Altair, Bokeh, lets-plot, Matplotlib, Plotly, plotnine, Pygal, Seaborn; R: ggplot2; Julia: Makie.jl. Compare all 15 side by side: Yield Curve (Interest Rate Term Structure) in Python, R, Julia and JavaScript.
A yield curve plots interest rates (yields) of bonds against their maturities, from short-term (e.g., 1 month) to long-term (e.g., 30 years). It is one of the most iconic charts in macroeconomics and finance, used to assess market expectations for future interest rates, economic growth, and inflation. An inverted yield curve (where short-term rates exceed long-term rates) is a widely followed recession indicator. The plot should support displaying multiple curves (e.g., different dates) on the same axes to show how the term structure evolves over time.
// anyplot.ai
// line-yield-curve: Yield Curve (Interest Rate Term Structure)
// Library: d3 7.9.0 | JavaScript 22.23.3
// Quality: 85/100 | Updated: 2026-10-09

const t = window.ANYPLOT_TOKENS;
const { width, height } = window.ANYPLOT_SIZE;
const margin = { top: 80, right: 90, bottom: 85, left: 90 };
const iw = width - margin.left - margin.right;
const ih = height - margin.top - margin.bottom;

// --- Data: U.S. Treasury yield curves at three key dates ---
const maturities = [
  { label: "1M",  years: 0.083 },
  { label: "3M",  years: 0.25  },
  { label: "6M",  years: 0.5   },
  { label: "1Y",  years: 1     },
  { label: "2Y",  years: 2     },
  { label: "3Y",  years: 3     },
  { label: "5Y",  years: 5     },
  { label: "7Y",  years: 7     },
  { label: "10Y", years: 10    },
  { label: "20Y", years: 20    },
  { label: "30Y", years: 30    },
];

const curves = [
  {
    date: "Jan 2022",
    shape: "Normal",
    color: t.palette[0],  // brand green
    strokeWidth: 2.5,
    dashArray: null,
    yields: [0.05, 0.32, 0.52, 0.79, 1.15, 1.43, 1.63, 1.78, 1.87, 2.17, 2.22],
  },
  {
    date: "Jan 2023",
    shape: "Flat",
    color: t.palette[2],  // blue — financial convention (yield curves use blue for flat/transitional)
    strokeWidth: 2.5,
    dashArray: "8,5",
    yields: [4.30, 4.65, 4.87, 4.72, 4.41, 4.20, 3.95, 3.82, 3.68, 3.87, 3.74],
  },
  {
    date: "Jul 2023",
    shape: "Inverted",
    color: t.palette[4],  // matte red — semantic: recession signal
    strokeWidth: 2.5,
    dashArray: null,
    yields: [5.50, 5.47, 5.53, 5.44, 4.92, 4.65, 4.37, 4.25, 3.96, 3.87, 3.82],
  },
];

curves.forEach(c => {
  c.data = maturities.map((m, i) => ({ label: m.label, years: m.years, yield: c.yields[i] }));
});

// --- SVG mount ---
const svg = d3.select("#container")
  .append("svg")
  .attr("width", width)
  .attr("height", height);

const g = svg.append("g").attr("transform", `translate(${margin.left},${margin.top})`);

// --- Scales ---
// Log scale places clustered short maturities with appropriate visual spacing
const x = d3.scaleLog().domain([0.07, 35]).range([0, iw]);

const allYields = curves.flatMap(c => c.yields);
const y = d3.scaleLinear()
  .domain([Math.min(...allYields) - 0.25, Math.max(...allYields) + 0.25])
  .nice()
  .range([ih, 0]);

// --- Horizontal gridlines (financial publication style: subtle, horizontal only) ---
y.ticks(6).forEach(tick => {
  g.append("line")
    .attr("x1", 0).attr("x2", iw)
    .attr("y1", y(tick)).attr("y2", y(tick))
    .attr("stroke", t.grid)
    .attr("stroke-width", 1);
});

// --- Inversion zone shading ---
// Shade between the Jul 2023 inverted curve and its 10Y yield baseline (1M–10Y)
const invCurve = curves[2];
const tenYrYield = invCurve.data.find(d => d.label === "10Y").yield;  // 3.96

const invShadeData = invCurve.data.slice(0, 9);  // 1M through 10Y

g.append("path")
  .datum(invShadeData)
  .attr("d", d3.area()
    .x(d => x(d.years))
    .y0(y(tenYrYield))
    .y1(d => y(d.yield))
    .curve(d3.curveCatmullRom.alpha(0.5))
  )
  .attr("fill", t.palette[4])
  .attr("fill-opacity", 0.09)
  .attr("stroke", "none");

// Dashed reference line at the inverted curve's 10Y yield
g.append("line")
  .attr("x1", 0).attr("x2", iw)
  .attr("y1", y(tenYrYield)).attr("y2", y(tenYrYield))
  .attr("stroke", t.palette[4])
  .attr("stroke-width", 1)
  .attr("stroke-dasharray", "4,4")
  .attr("opacity", 0.45);

// Label the 10Y reference line at its right endpoint so viewers understand the baseline
g.append("text").attr("x", iw + 6).attr("y", y(tenYrYield) - 4)
  .attr("text-anchor", "start").attr("fill", t.palette[4]).attr("opacity", 0.65)
  .style("font-size", "14px").text("10Y");
g.append("text").attr("x", iw + 6).attr("y", y(tenYrYield) + 10)
  .attr("text-anchor", "start").attr("fill", t.palette[4]).attr("opacity", 0.65)
  .style("font-size", "14px").text("3.96%");

// d3.bisectLeft: find the 2Y maturity index to anchor the inversion annotation
const matYears = maturities.map(m => m.years);
const ann2YIdx = d3.bisectLeft(matYears, 2);
const annPt = invCurve.data[ann2YIdx];
g.append("text")
  .attr("x", x(annPt.years))
  .attr("y", y(annPt.yield) - 14)
  .attr("text-anchor", "middle")
  .attr("fill", t.palette[4])
  .attr("opacity", 0.75)
  .style("font-size", "14px")
  .style("font-style", "italic")
  .text("Inverted");

// --- Curves: lines + data point markers ---
const lineGen = d3.line()
  .x(d => x(d.years))
  .y(d => y(d.yield))
  .curve(d3.curveCatmullRom.alpha(0.5));

curves.forEach(curve => {
  const path = g.append("path")
    .datum(curve.data)
    .attr("fill", "none")
    .attr("stroke", curve.color)
    .attr("stroke-width", curve.strokeWidth)
    .attr("d", lineGen);

  if (curve.dashArray) path.attr("stroke-dasharray", curve.dashArray);

  const dotsG = g.append("g");
  curve.data.forEach(d => {
    dotsG.append("circle")
      .attr("cx", x(d.years))
      .attr("cy", y(d.yield))
      .attr("r", 4)
      .attr("fill", curve.color)
      .attr("stroke", t.pageBg)
      .attr("stroke-width", 2);
  });
});

// --- X-axis with explicit maturity tick labels ---
const xAxisG = g.append("g")
  .attr("transform", `translate(0,${ih})`)
  .call(
    d3.axisBottom(x)
      .tickValues(maturities.map(m => m.years))
      .tickFormat(d => {
        const match = maturities.find(m => Math.abs(m.years / d - 1) < 0.01);
        return match ? match.label : "";
      })
  );
xAxisG.selectAll("text").attr("fill", t.inkSoft).style("font-size", "14px");
xAxisG.selectAll("line").attr("stroke", t.inkSoft);
xAxisG.select(".domain").attr("stroke", t.inkSoft);

// --- Y-axis ---
const yAxisG = g.append("g")
  .call(d3.axisLeft(y).ticks(6).tickFormat(d => `${d.toFixed(1)}%`));
yAxisG.selectAll("text").attr("fill", t.inkSoft).style("font-size", "14px");
yAxisG.selectAll("line").attr("stroke", t.inkSoft);
yAxisG.select(".domain").attr("stroke", t.inkSoft);

// --- Axis labels ---
g.append("text")
  .attr("x", iw / 2)
  .attr("y", ih + 60)
  .attr("text-anchor", "middle")
  .attr("fill", t.ink)
  .style("font-size", "16px")
  .text("Maturity");

g.append("text")
  .attr("transform", "rotate(-90)")
  .attr("x", -(ih / 2))
  .attr("y", -68)
  .attr("text-anchor", "middle")
  .attr("fill", t.ink)
  .style("font-size", "16px")
  .text("Yield (%)");

// --- Legend (inset, upper-right corner of plot area) ---
const legPad = 14;
const legLineH = 30;
const legW = 225;
const legH = curves.length * legLineH + legPad * 2;
const legG = g.append("g").attr("transform", `translate(${iw - legW - legPad},${legPad})`);

legG.append("rect")
  .attr("width", legW).attr("height", legH)
  .attr("fill", t.elevatedBg)
  .attr("rx", 4)
  .attr("stroke", t.grid)
  .attr("stroke-width", 1);

curves.forEach((curve, i) => {
  const cy = legPad + i * legLineH + legLineH / 2;

  const ll = legG.append("line")
    .attr("x1", legPad).attr("y1", cy)
    .attr("x2", legPad + 28).attr("y2", cy)
    .attr("stroke", curve.color)
    .attr("stroke-width", 2.5);

  if (curve.dashArray) ll.attr("stroke-dasharray", curve.dashArray);

  legG.append("circle")
    .attr("cx", legPad + 14).attr("cy", cy)
    .attr("r", 3.5)
    .attr("fill", curve.color)
    .attr("stroke", t.pageBg)
    .attr("stroke-width", 1.5);

  legG.append("text")
    .attr("x", legPad + 36)
    .attr("y", cy + 5)
    .attr("fill", t.inkSoft)
    .style("font-size", "14px")
    .text(`${curve.date} — ${curve.shape}`);
});

// --- Title ---
svg.append("text")
  .attr("x", width / 2)
  .attr("y", 46)
  .attr("text-anchor", "middle")
  .attr("fill", t.ink)
  .style("font-size", "22px")
  .style("font-weight", "600")
  .text("line-yield-curve · javascript · d3 · anyplot.ai");
Runnable source as JSON, for any HTTP client: https://api.anyplot.ai/specs/line-yield-curve/d3/code. Any spec id and library id listed in llms-full.txt fit the same URL shape; every URL below is complete and callable.
{
  "spec_id": "line-yield-curve",
  "language": "javascript",
  "library": "d3",
  "page": "https://anyplot.ai/line-yield-curve/javascript/d3",
  "hub": "https://anyplot.ai/line-yield-curve",
  "code_json": "https://api.anyplot.ai/specs/line-yield-curve/d3/code",
  "spec_json": "https://api.anyplot.ai/specs/line-yield-curve",
  "render_light_png": "https://storage.googleapis.com/anyplot-images/plots/line-yield-curve/javascript/d3/plot-light.png",
  "render_dark_png": "https://storage.googleapis.com/anyplot-images/plots/line-yield-curve/javascript/d3/plot-dark.png",
  "interactive_light_html": "https://storage.googleapis.com/anyplot-images/plots/line-yield-curve/javascript/d3/plot-light.html",
  "interactive_dark_html": "https://storage.googleapis.com/anyplot-images/plots/line-yield-curve/javascript/d3/plot-dark.html",
  "quality_score": 85.0,
  "license": "MIT",
  "guide": "https://anyplot.ai/llms.txt"
}
Part of Yield Curve (Interest Rate Term Structure) on anyplot.ai.