The same plot in 14 other libraries — JavaScript: D3.js, Apache ECharts, Highcharts, MUI X Charts; Python: Altair, Bokeh, lets-plot, Matplotlib, Plotly, plotnine, Pygal, Seaborn; R: ggplot2; Julia: Makie.jl. Compare all 15 side by side: Yield Curve (Interest Rate Term Structure) in Python, R, Julia and JavaScript.
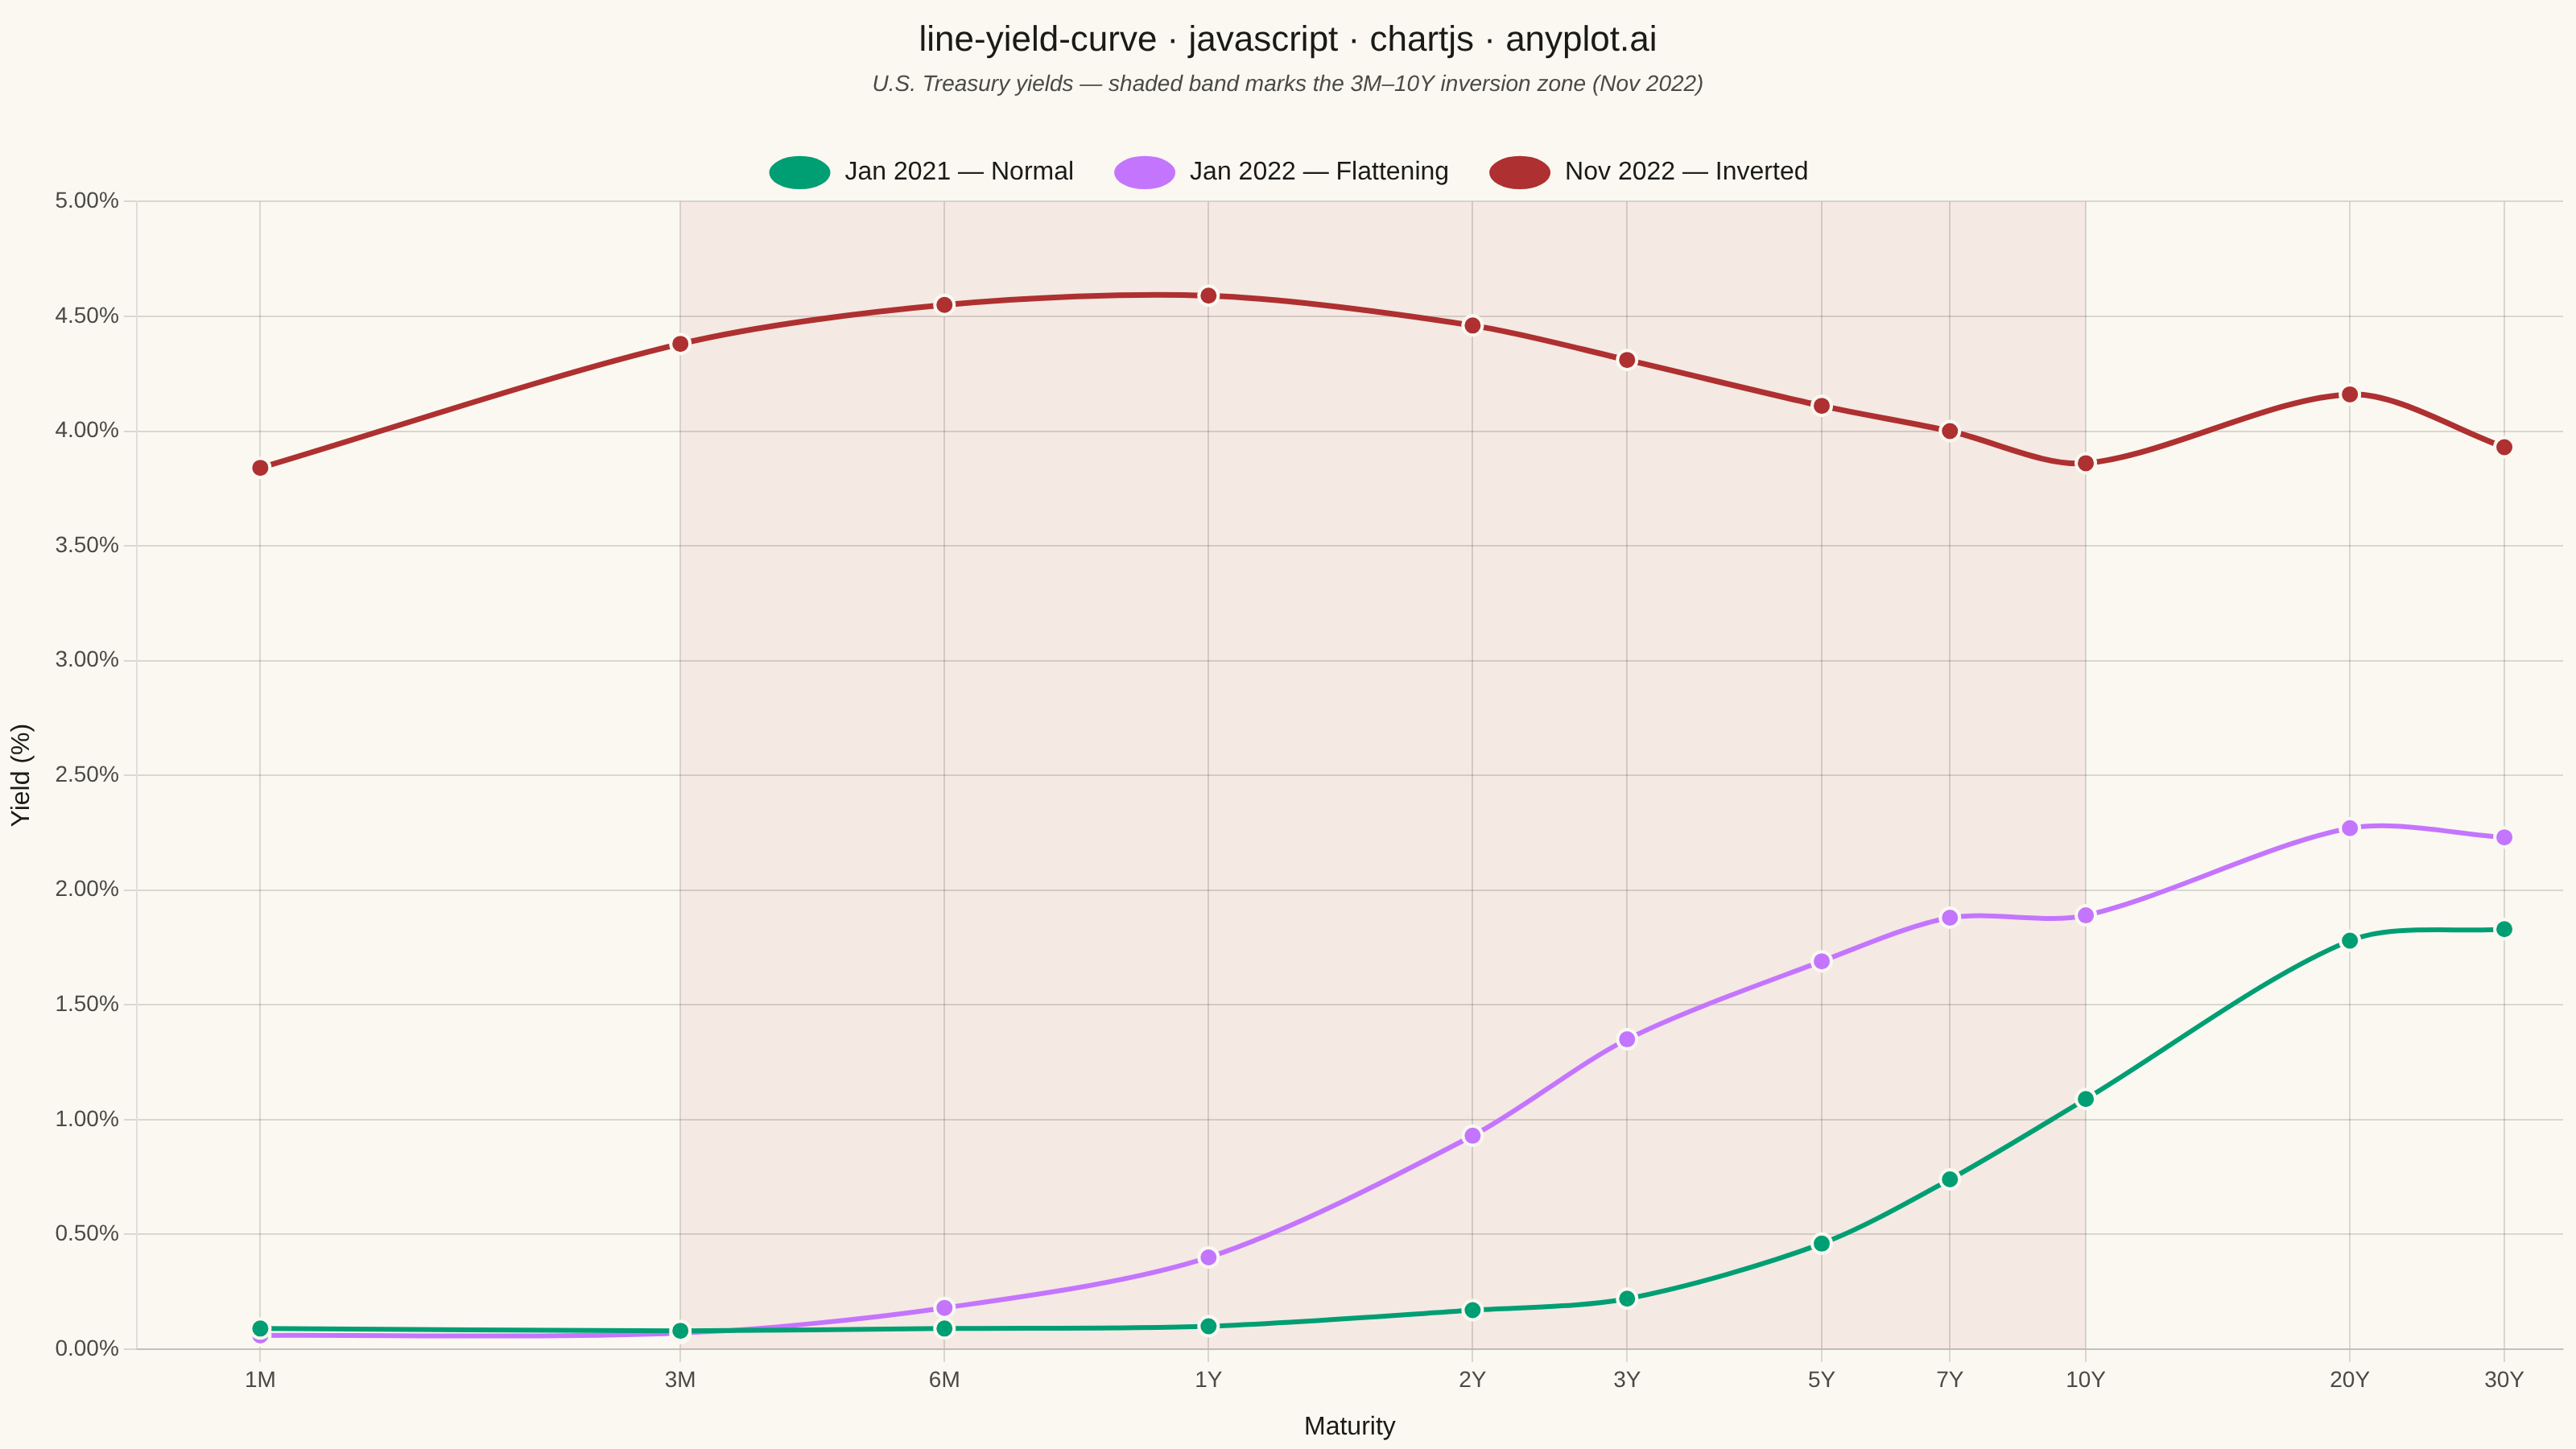
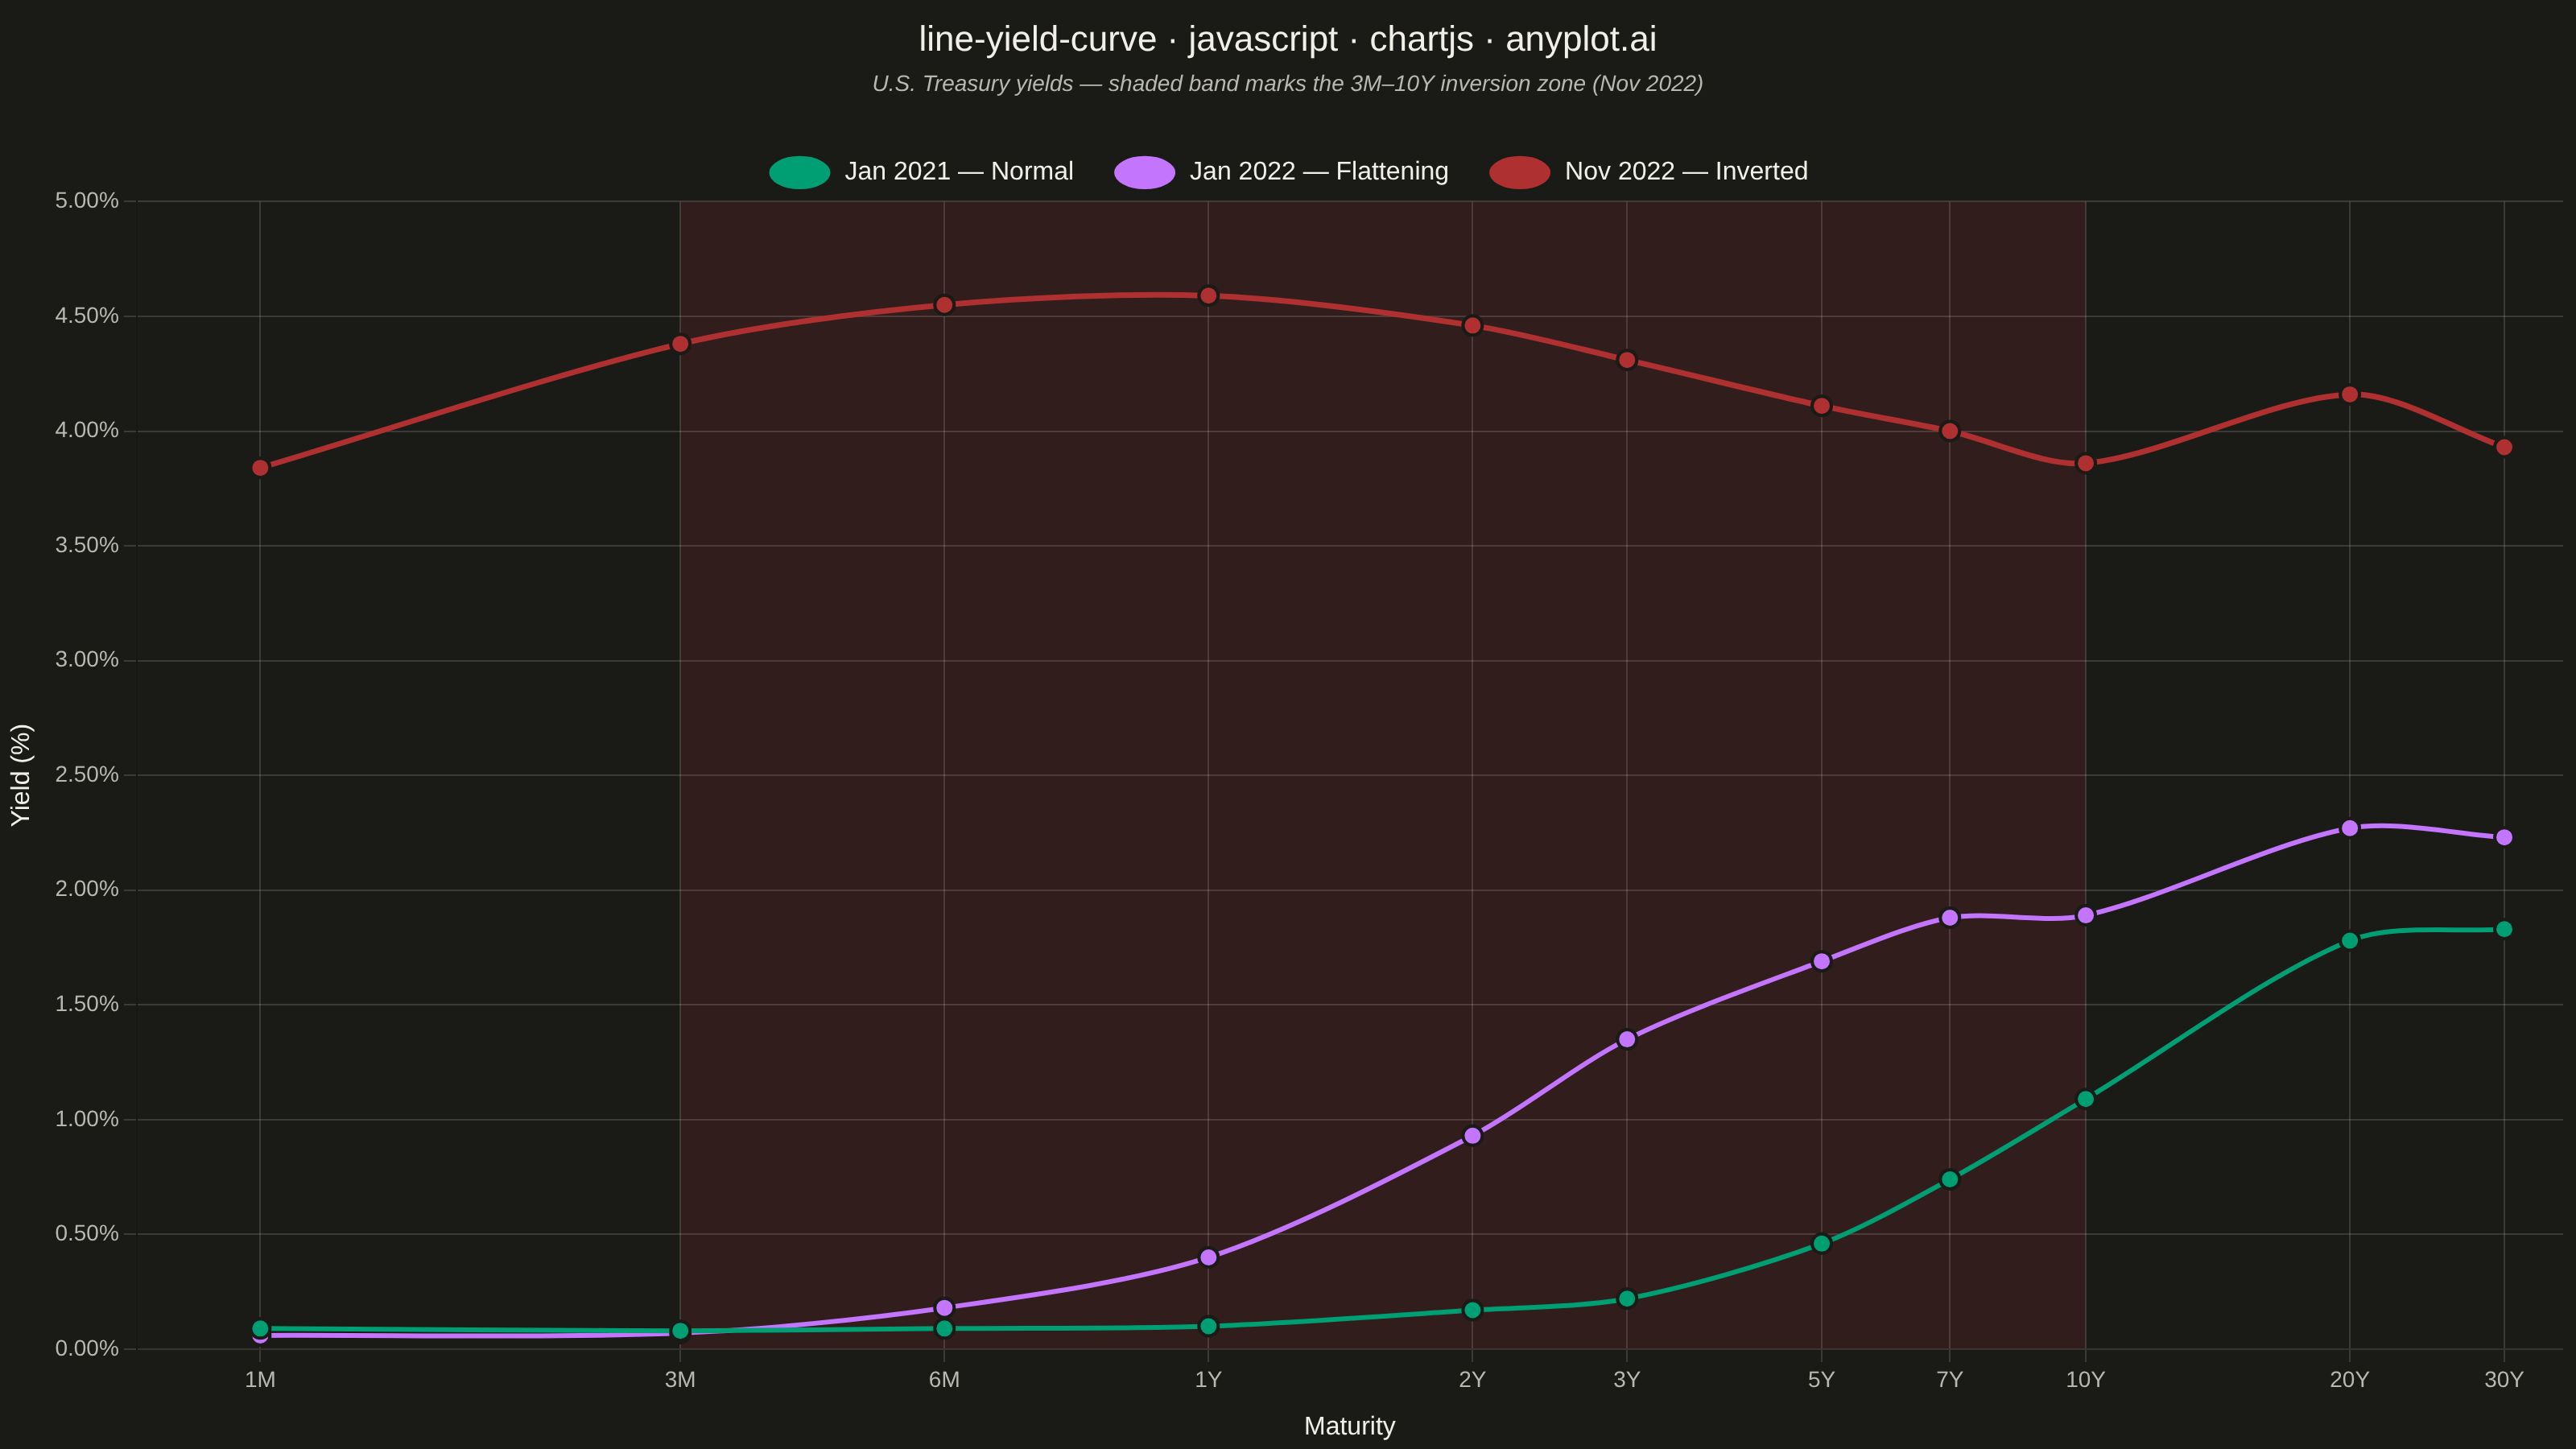
A yield curve plots interest rates (yields) of bonds against their maturities, from short-term (e.g., 1 month) to long-term (e.g., 30 years). It is one of the most iconic charts in macroeconomics and finance, used to assess market expectations for future interest rates, economic growth, and inflation. An inverted yield curve (where short-term rates exceed long-term rates) is a widely followed recession indicator. The plot should support displaying multiple curves (e.g., different dates) on the same axes to show how the term structure evolves over time.
// anyplot.ai
// line-yield-curve: Yield Curve (Interest Rate Term Structure)
// Library: chartjs 4.4.7 | JavaScript 22.22.3
// Quality: 86/100 | Created: 2026-06-10

//# anyplot-orientation: landscape

const t = window.ANYPLOT_TOKENS;

// Maturity schedule
const maturities = ["1M", "3M", "6M", "1Y", "2Y", "3Y", "5Y", "7Y", "10Y", "20Y", "30Y"];
const maturityYears = [0.083, 0.25, 0.5, 1, 2, 3, 5, 7, 10, 20, 30];

// U.S. Treasury yield snapshots (annualised %)
// Jan 2021 — normal, upward-sloping (ZIRP era, early pandemic recovery)
const yields2021 = [0.09, 0.08, 0.09, 0.10, 0.17, 0.22, 0.46, 0.74, 1.09, 1.78, 1.83];
// Jan 2022 — flattening as Fed signals rate hike cycle
const yields2022 = [0.06, 0.07, 0.18, 0.40, 0.93, 1.35, 1.69, 1.88, 1.89, 2.27, 2.23];
// Nov 2022 — deeply inverted (aggressive tightening, 2Y > 10Y spread)
const yieldsNov2022 = [3.84, 4.38, 4.55, 4.59, 4.46, 4.31, 4.11, 4.00, 3.86, 4.16, 3.93];

const toPoints = (ys) => maturityYears.map((x, i) => ({ x, y: ys[i] }));

// Robust tick label: nearest-neighbour match to handle floating-point drift
const matLabel = (val) => {
  let best = maturityYears[0], bestDist = Infinity;
  maturityYears.forEach((yr, i) => {
    const d = Math.abs(yr - val);
    if (d < bestDist) { bestDist = d; best = i; }
  });
  return bestDist < 0.01 ? maturities[best] : "";
};

// Plugin: shade the 3M–10Y inversion zone (where Nov-2022 is inverted)
const inversionZonePlugin = {
  id: "inversionZone",
  beforeDraw({ ctx, scales, chartArea }) {
    if (!scales.x) return;
    const x1 = scales.x.getPixelForValue(0.25);
    const x2 = scales.x.getPixelForValue(10);
    ctx.save();
    ctx.fillStyle = window.ANYPLOT_THEME === "dark"
      ? "rgba(174,48,48,0.16)"
      : "rgba(174,48,48,0.07)";
    ctx.fillRect(x1, chartArea.top, x2 - x1, chartArea.bottom - chartArea.top);
    ctx.restore();
  },
};

const canvas = document.createElement("canvas");
document.getElementById("container").appendChild(canvas);

new Chart(canvas, {
  type: "line",
  plugins: [inversionZonePlugin],
  data: {
    datasets: [
      {
        label: "Jan 2021 — Normal",
        data: toPoints(yields2021),
        borderColor: t.palette[0],          // Imprint palette pos 1 — brand green
        pointBackgroundColor: t.palette[0],
        pointBorderColor: t.pageBg,
        pointBorderWidth: 2,
        pointRadius: 6,
        borderWidth: 3,
        tension: 0.3,
        fill: false,
      },
      {
        label: "Jan 2022 — Flattening",
        data: toPoints(yields2022),
        borderColor: t.palette[1],          // Imprint palette pos 2 — lavender
        pointBackgroundColor: t.palette[1],
        pointBorderColor: t.pageBg,
        pointBorderWidth: 2,
        pointRadius: 6,
        borderWidth: 3,
        tension: 0.3,
        fill: false,
      },
      {
        label: "Nov 2022 — Inverted",
        data: toPoints(yieldsNov2022),
        borderColor: t.palette[4],          // Imprint matte red — semantic: recessionary signal
        pointBackgroundColor: t.palette[4],
        pointBorderColor: t.pageBg,
        pointBorderWidth: 2,
        pointRadius: 6,
        borderWidth: 3.5,
        tension: 0.3,
        fill: false,
      },
    ],
  },
  options: {
    responsive: true,
    maintainAspectRatio: false,
    animation: false,
    plugins: {
      title: {
        display: true,
        text: "line-yield-curve · javascript · chartjs · anyplot.ai",
        color: t.ink,
        font: { size: 22, weight: "500" },
        padding: { top: 12, bottom: 6 },
      },
      subtitle: {
        display: true,
        text: "U.S. Treasury yields — shaded band marks the 3M–10Y inversion zone (Nov 2022)",
        color: t.inkSoft,
        font: { size: 14, style: "italic" },
        padding: { bottom: 14 },
      },
      legend: {
        position: "top",
        labels: {
          color: t.ink,
          font: { size: 16 },
          padding: 24,
          usePointStyle: true,
          pointStyleWidth: 40,
        },
      },
    },
    scales: {
      x: {
        type: "logarithmic",
        min: 0.06,
        max: 35,
        title: {
          display: true,
          text: "Maturity",
          color: t.ink,
          font: { size: 16, weight: "500" },
          padding: { top: 8 },
        },
        ticks: {
          color: t.inkSoft,
          font: { size: 14 },
          callback: matLabel,
          maxRotation: 0,
          autoSkip: false,
        },
        afterBuildTicks(axis) {
          axis.ticks = maturityYears.map((v) => ({ value: v }));
        },
        grid: {
          color: t.grid,
        },
      },
      y: {
        title: {
          display: true,
          text: "Yield (%)",
          color: t.ink,
          font: { size: 16, weight: "500" },
          padding: { bottom: 8 },
        },
        ticks: {
          color: t.inkSoft,
          font: { size: 14 },
          callback: (val) => val.toFixed(2) + "%",
        },
        grid: {
          color: t.grid,
        },
      },
    },
  },
});
Runnable source as JSON, for any HTTP client: https://api.anyplot.ai/specs/line-yield-curve/chartjs/code. Any spec id and library id listed in llms-full.txt fit the same URL shape; every URL below is complete and callable.
{
  "spec_id": "line-yield-curve",
  "language": "javascript",
  "library": "chartjs",
  "page": "https://anyplot.ai/line-yield-curve/javascript/chartjs",
  "hub": "https://anyplot.ai/line-yield-curve",
  "code_json": "https://api.anyplot.ai/specs/line-yield-curve/chartjs/code",
  "spec_json": "https://api.anyplot.ai/specs/line-yield-curve",
  "render_light_png": "https://storage.googleapis.com/anyplot-images/plots/line-yield-curve/javascript/chartjs/plot-light.png",
  "render_dark_png": "https://storage.googleapis.com/anyplot-images/plots/line-yield-curve/javascript/chartjs/plot-dark.png",
  "interactive_light_html": "https://storage.googleapis.com/anyplot-images/plots/line-yield-curve/javascript/chartjs/plot-light.html",
  "interactive_dark_html": "https://storage.googleapis.com/anyplot-images/plots/line-yield-curve/javascript/chartjs/plot-dark.html",
  "quality_score": 86.0,
  "license": "MIT",
  "guide": "https://anyplot.ai/llms.txt"
}
Part of Yield Curve (Interest Rate Term Structure) on anyplot.ai.