The same plot in 14 other libraries — JavaScript: Chart.js, Apache ECharts, Highcharts, MUI X Charts; Python: Altair, Bokeh, lets-plot, Matplotlib, Plotly, plotnine, Pygal, Seaborn; R: ggplot2; Julia: Makie.jl. Compare all 15 side by side: Grouped Lollipop Chart in Python, R, Julia and JavaScript.
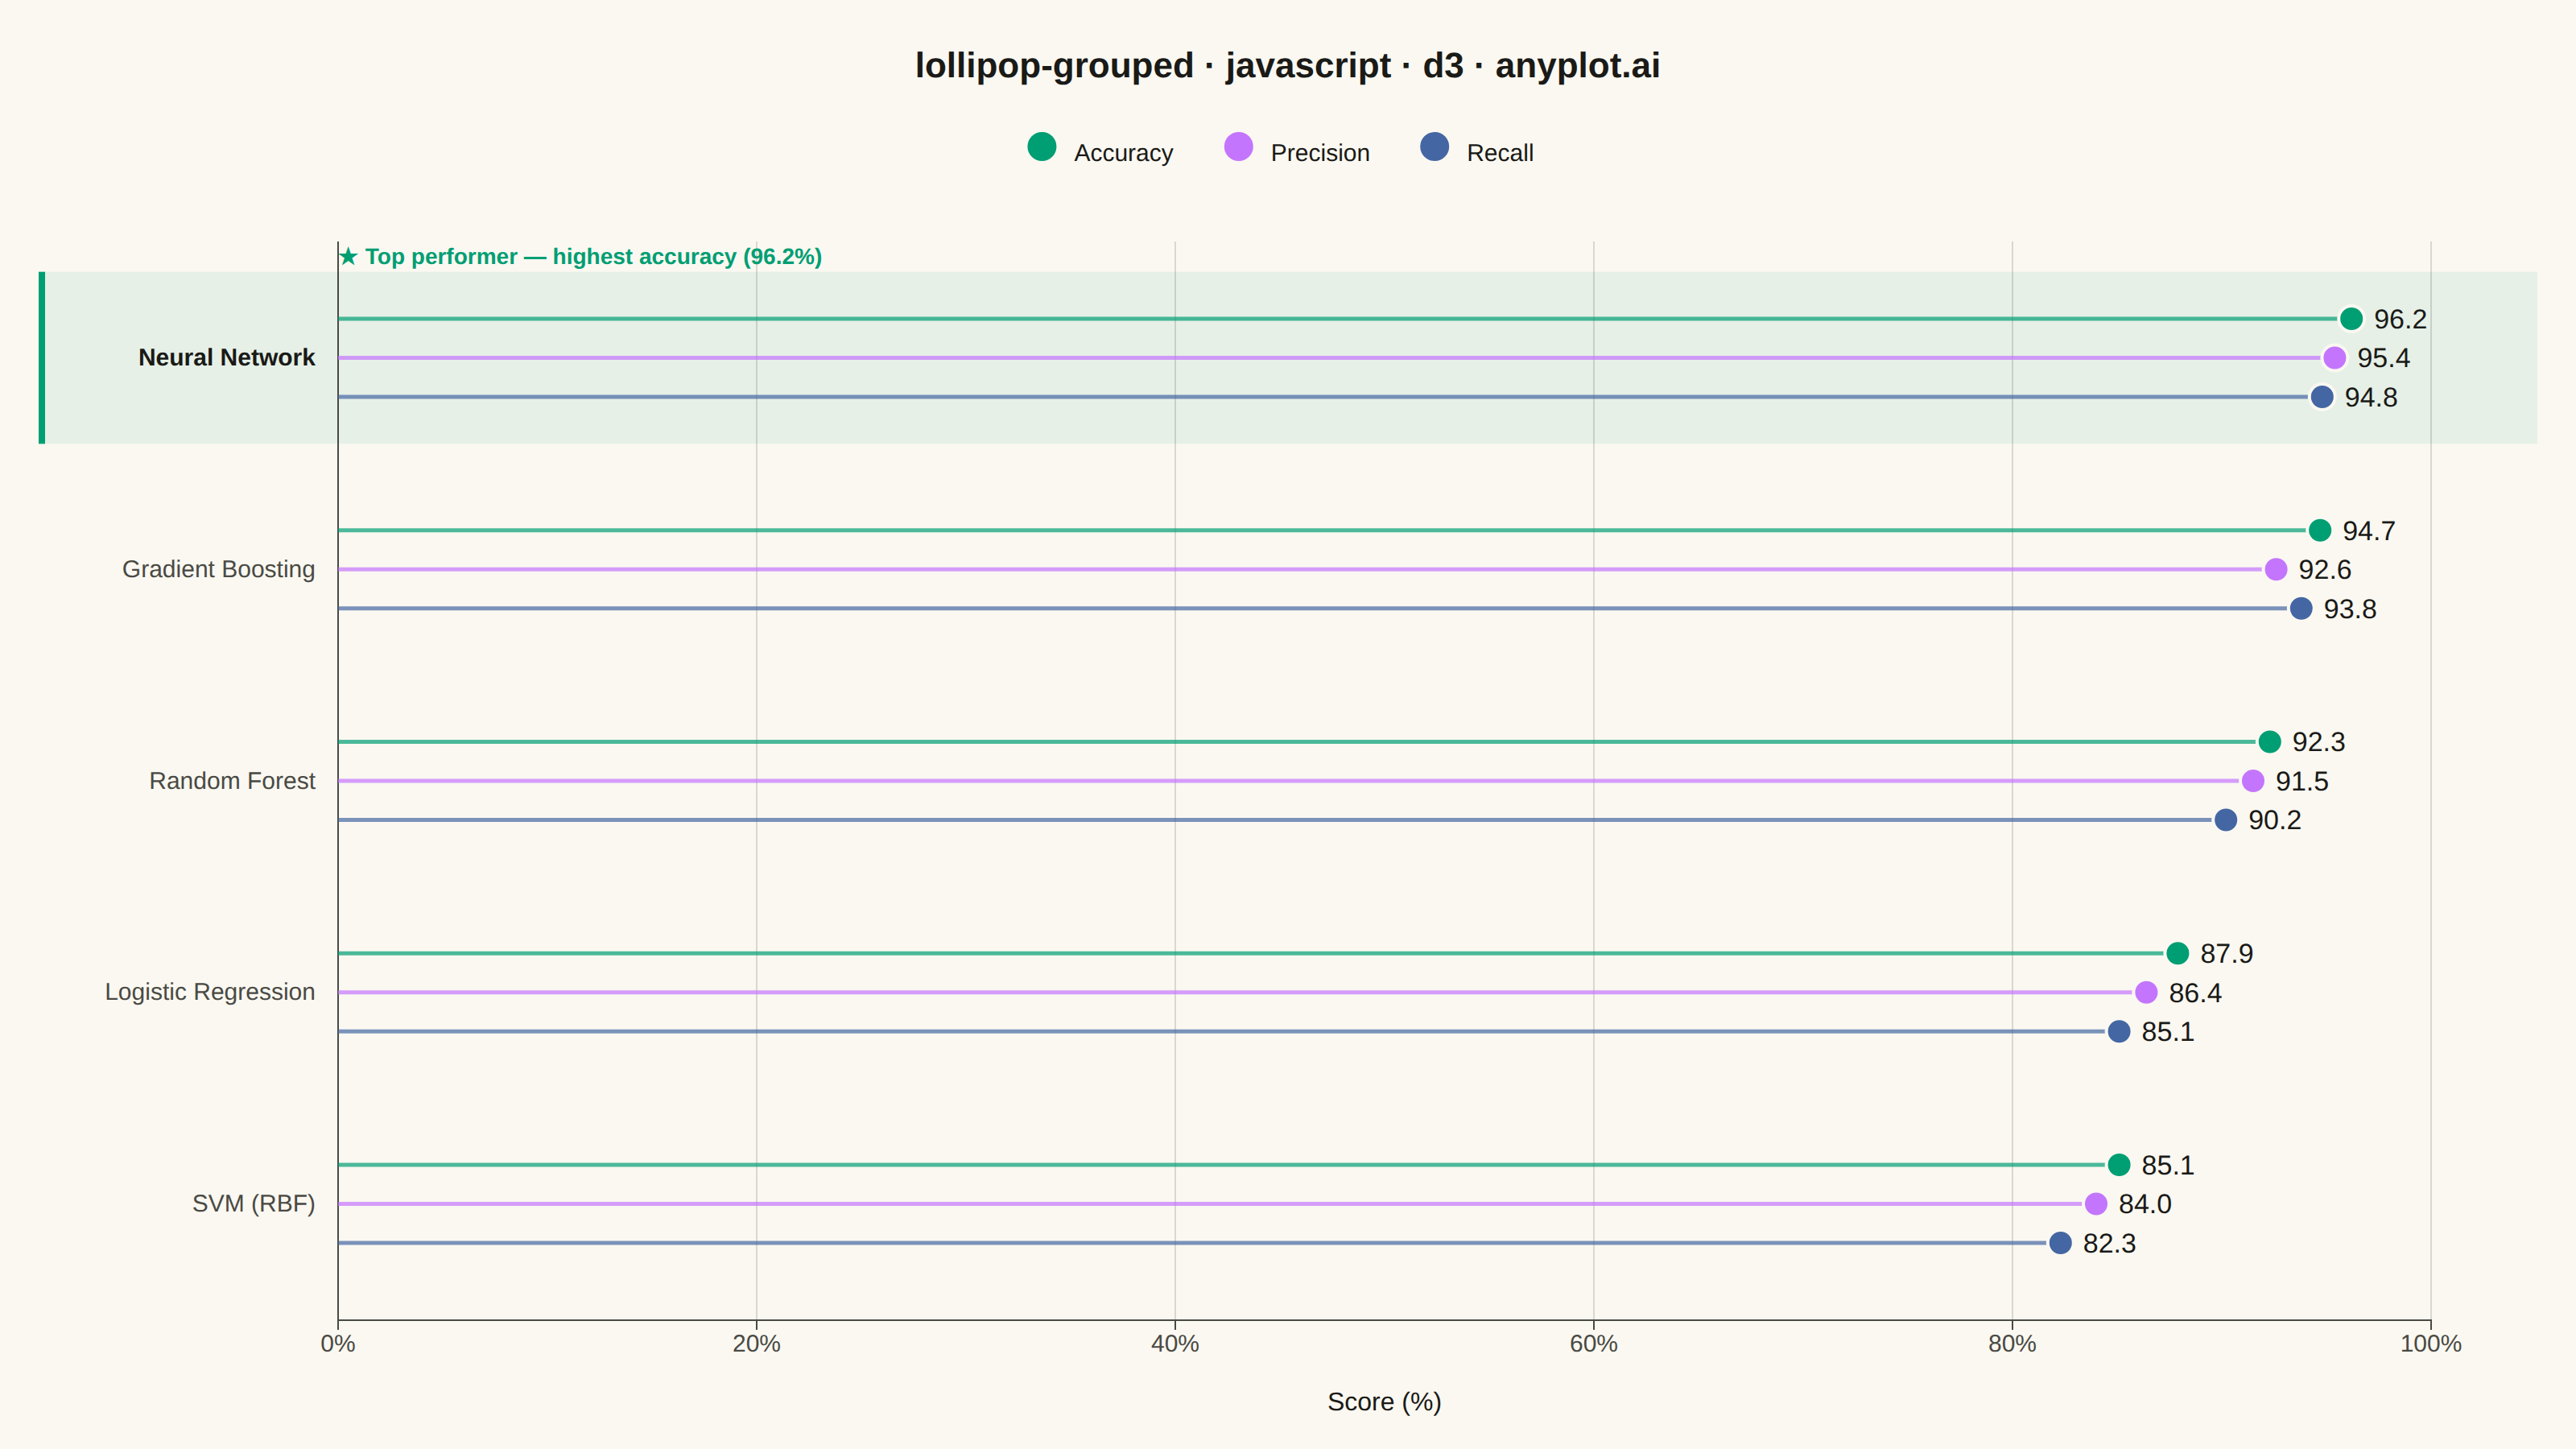
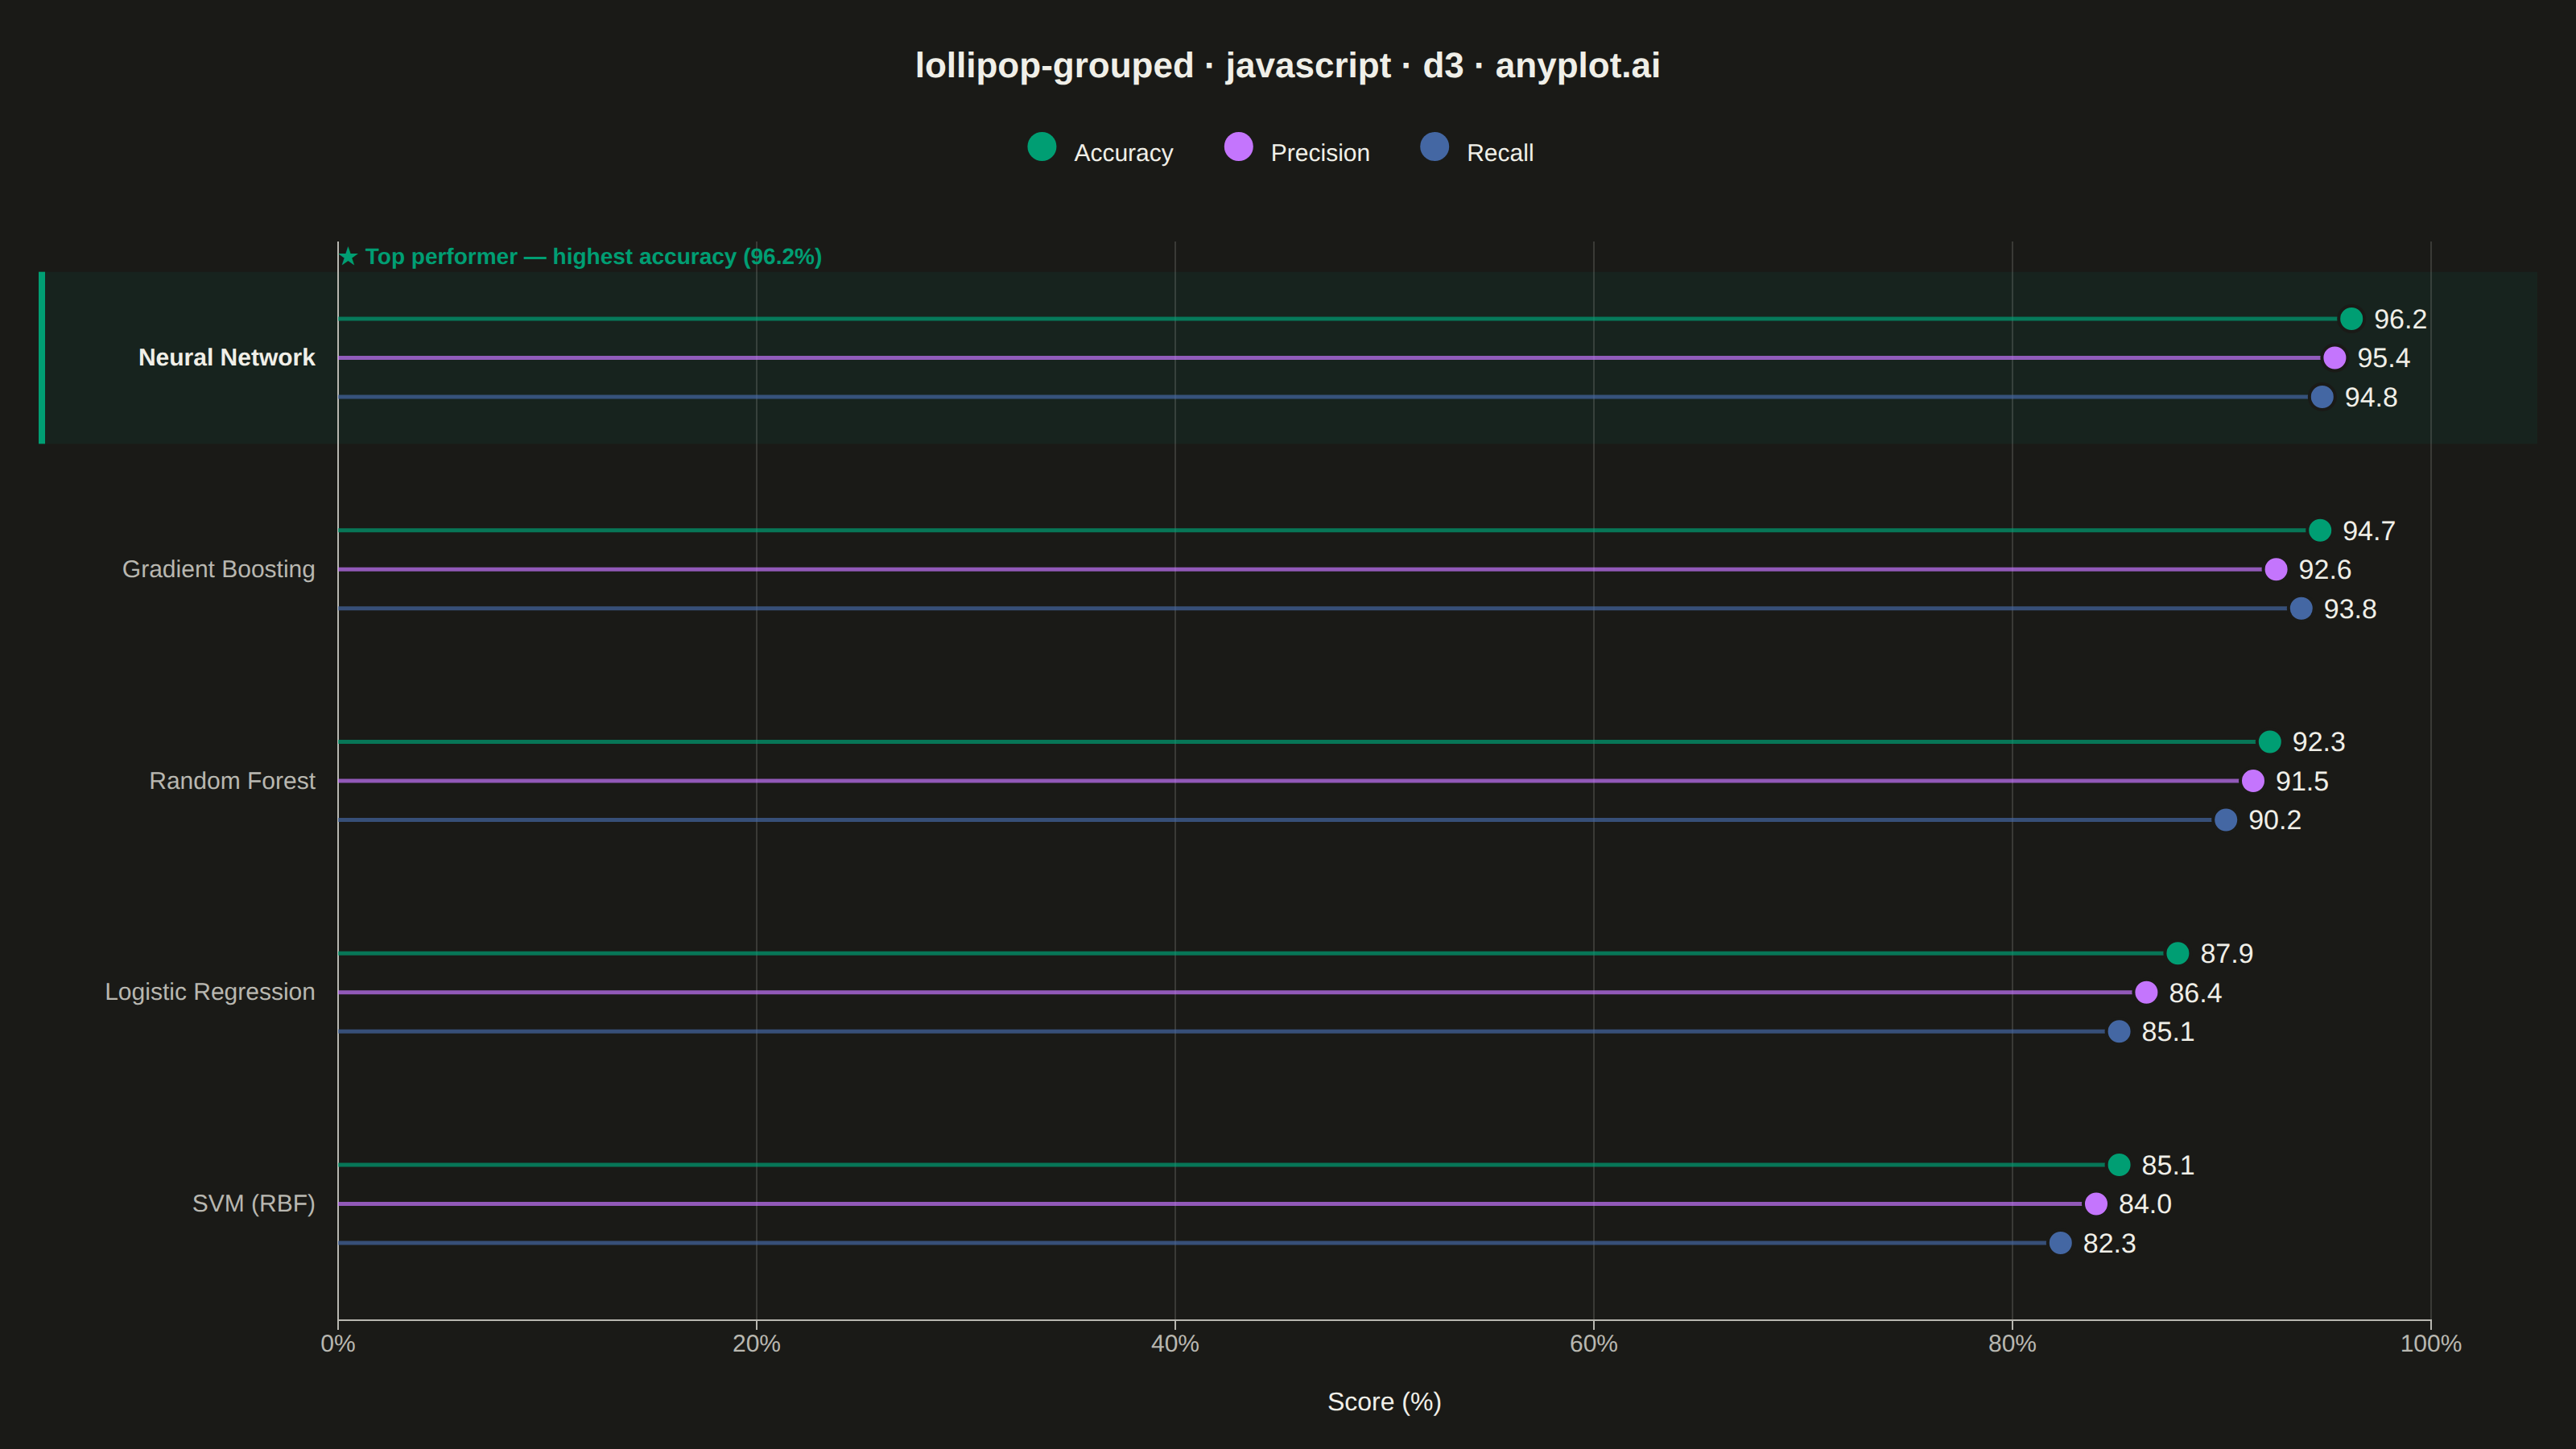
A grouped lollipop chart displays multiple series across categorical variables using thin stems and circular markers arranged in groups. Each category has multiple lollipops side by side, one for each series, enabling direct comparison of metrics across groups. It combines the clarity of dot plots with the organization of grouped bar charts while reducing visual clutter.
// anyplot.ai
// lollipop-grouped: Grouped Lollipop Chart
// Library: d3 7.9.0 | JavaScript 22.23.2
// Quality: 92/100 | Created: 2026-09-02

const t = window.ANYPLOT_TOKENS;
const { width, height } = window.ANYPLOT_SIZE;
const margin = { top: 150, right: 90, bottom: 80, left: 210 };
const iw = width - margin.left - margin.right;
const ih = height - margin.top - margin.bottom;

// --- Data (in-memory, deterministic) ----------------------------------------
// Model benchmark: three metrics per algorithm, sorted ascending by mean score
// so scaleBand's range([ih,0]) puts the strongest model at the top.
const metrics = ["Accuracy", "Precision", "Recall"];
// Gradient Boosting trades precision for recall (a realistic classifier
// trade-off), breaking the otherwise strict Accuracy > Precision > Recall
// ordering shared by the other four models.
const models = [
  { name: "SVM (RBF)", Accuracy: 85.1, Precision: 84.0, Recall: 82.3 },
  { name: "Logistic Regression", Accuracy: 87.9, Precision: 86.4, Recall: 85.1 },
  { name: "Random Forest", Accuracy: 92.3, Precision: 91.5, Recall: 90.2 },
  { name: "Gradient Boosting", Accuracy: 94.7, Precision: 92.6, Recall: 93.8 },
  { name: "Neural Network", Accuracy: 96.2, Precision: 95.4, Recall: 94.8 },
];
const cells = models.flatMap((m) =>
  metrics.map((metric) => ({ model: m.name, metric, value: m[metric] })),
);

// --- SVG mount ----------------------------------------------------------------
const svg = d3.select("#container").append("svg").attr("width", width).attr("height", height);
const g = svg.append("g").attr("transform", `translate(${margin.left},${margin.top})`);

// --- Scales -------------------------------------------------------------------
const y0 = d3
  .scaleBand()
  .domain(models.map((m) => m.name))
  .range([ih, 0])
  .paddingInner(0.4)
  .paddingOuter(0.25);
const y1 = d3.scaleBand().domain(metrics).range([0, y0.bandwidth()]).padding(0.25);
const x = d3.scaleLinear().domain([0, 100]).range([0, iw]);
const color = d3.scaleOrdinal().domain(metrics).range(t.palette);

// --- Top-performer highlight (data-storytelling focal point) ------------------
// Neural Network sorts last (highest accuracy) and lands at the top row.
const topModel = models[models.length - 1];
const topBandTop = y0(topModel.name);
const topBandHeight = y0.bandwidth();
const bandPad = 14;
g.append("rect")
  .attr("class", "top-highlight")
  .attr("x", -margin.left + 24)
  .attr("y", topBandTop - bandPad)
  .attr("width", iw + margin.left + margin.right - 48)
  .attr("height", topBandHeight + bandPad * 2)
  .attr("fill", t.palette[0])
  .attr("fill-opacity", 0.08);
g.append("rect")
  .attr("class", "top-highlight-accent")
  .attr("x", -margin.left + 24)
  .attr("y", topBandTop - bandPad)
  .attr("width", 4)
  .attr("height", topBandHeight + bandPad * 2)
  .attr("fill", t.palette[0]);

// --- Gridlines ------------------------------------------------------------------
g.selectAll(".grid")
  .data(x.ticks(5))
  .join("line")
  .attr("class", "grid")
  .attr("x1", (d) => x(d))
  .attr("x2", (d) => x(d))
  .attr("y1", 0)
  .attr("y2", ih)
  .attr("stroke", t.grid)
  .attr("stroke-width", 1);

// --- Axes -----------------------------------------------------------------------
const xAxis = g
  .append("g")
  .attr("transform", `translate(0,${ih})`)
  .call(d3.axisBottom(x).ticks(5).tickFormat((d) => `${d}%`));
const yAxis = g.append("g").call(d3.axisLeft(y0).tickSize(0).tickPadding(14));
for (const ax of [xAxis, yAxis]) {
  ax.selectAll("text").attr("fill", t.inkSoft).style("font-size", "15px");
  ax.selectAll("line").attr("stroke", t.inkSoft);
  ax.select(".domain").attr("stroke", t.inkSoft);
}
yAxis
  .selectAll(".tick")
  .filter((d) => d === topModel.name)
  .select("text")
  .attr("fill", t.ink)
  .style("font-weight", "700");

// --- X-axis label -----------------------------------------------------------
g.append("text")
  .attr("x", iw / 2)
  .attr("y", ih + 56)
  .attr("text-anchor", "middle")
  .attr("fill", t.ink)
  .style("font-size", "16px")
  .text("Score (%)");

// --- Grouped lollipops --------------------------------------------------------
const cellY = (d) => y0(d.model) + y1(d.metric) + y1.bandwidth() / 2;

g.selectAll(".stem")
  .data(cells)
  .join("line")
  .attr("class", "stem")
  .attr("x1", 0)
  .attr("x2", (d) => x(d.value))
  .attr("y1", cellY)
  .attr("y2", cellY)
  .attr("stroke", (d) => color(d.metric))
  .attr("stroke-width", 2.5)
  .attr("stroke-opacity", 0.7);

g.selectAll(".dot")
  .data(cells)
  .join("circle")
  .attr("class", "dot")
  .attr("cx", (d) => x(d.value))
  .attr("cy", cellY)
  .attr("r", 8)
  .attr("fill", (d) => color(d.metric))
  .attr("stroke", t.pageBg)
  .attr("stroke-width", 2);

g.selectAll(".val")
  .data(cells)
  .join("text")
  .attr("class", "val")
  .attr("x", (d) => x(d.value) + 14)
  .attr("y", cellY)
  .attr("dy", "0.35em")
  .attr("fill", t.ink)
  .style("font-size", "17px")
  .style("font-weight", "500")
  .text((d) => d.value.toFixed(1));

// --- Top-performer callout ---------------------------------------------------
g.append("text")
  .attr("class", "top-callout")
  .attr("x", 0)
  .attr("y", Math.max(topBandTop - bandPad - 8, 14))
  .attr("fill", t.palette[0])
  .style("font-size", "14px")
  .style("font-weight", "700")
  .text(`★ Top performer — highest accuracy (${topModel.Accuracy.toFixed(1)}%)`);

// --- Legend ---------------------------------------------------------------------
const legend = svg.append("g").attr("transform", "translate(0, 96)");
let xOffset = 0;
for (const metric of metrics) {
  const item = legend.append("g").attr("transform", `translate(${xOffset},0)`);
  item.append("circle").attr("r", 9).attr("cy", -5).attr("fill", color(metric));
  const label = item
    .append("text")
    .attr("x", 20)
    .attr("y", 0)
    .attr("dominant-baseline", "middle")
    .attr("fill", t.ink)
    .style("font-size", "15px")
    .text(metric);
  xOffset += 20 + label.node().getBBox().width + 40;
}
const legendWidth = xOffset - 40;
legend.attr("transform", `translate(${(width - legendWidth) / 2}, 96)`);

// --- Title ------------------------------------------------------------------
svg
  .append("text")
  .attr("x", width / 2)
  .attr("y", 48)
  .attr("text-anchor", "middle")
  .attr("fill", t.ink)
  .style("font-size", "22px")
  .style("font-weight", "600")
  .text("lollipop-grouped · javascript · d3 · anyplot.ai");
Runnable source as JSON, for any HTTP client: https://api.anyplot.ai/specs/lollipop-grouped/d3/code. Any spec id and library id listed in llms-full.txt fit the same URL shape; every URL below is complete and callable.
{
  "spec_id": "lollipop-grouped",
  "language": "javascript",
  "library": "d3",
  "page": "https://anyplot.ai/lollipop-grouped/javascript/d3",
  "hub": "https://anyplot.ai/lollipop-grouped",
  "code_json": "https://api.anyplot.ai/specs/lollipop-grouped/d3/code",
  "spec_json": "https://api.anyplot.ai/specs/lollipop-grouped",
  "render_light_png": "https://storage.googleapis.com/anyplot-images/plots/lollipop-grouped/javascript/d3/plot-light.png",
  "render_dark_png": "https://storage.googleapis.com/anyplot-images/plots/lollipop-grouped/javascript/d3/plot-dark.png",
  "interactive_light_html": "https://storage.googleapis.com/anyplot-images/plots/lollipop-grouped/javascript/d3/plot-light.html",
  "interactive_dark_html": "https://storage.googleapis.com/anyplot-images/plots/lollipop-grouped/javascript/d3/plot-dark.html",
  "quality_score": 92.0,
  "license": "MIT",
  "guide": "https://anyplot.ai/llms.txt"
}
Part of Grouped Lollipop Chart on anyplot.ai.