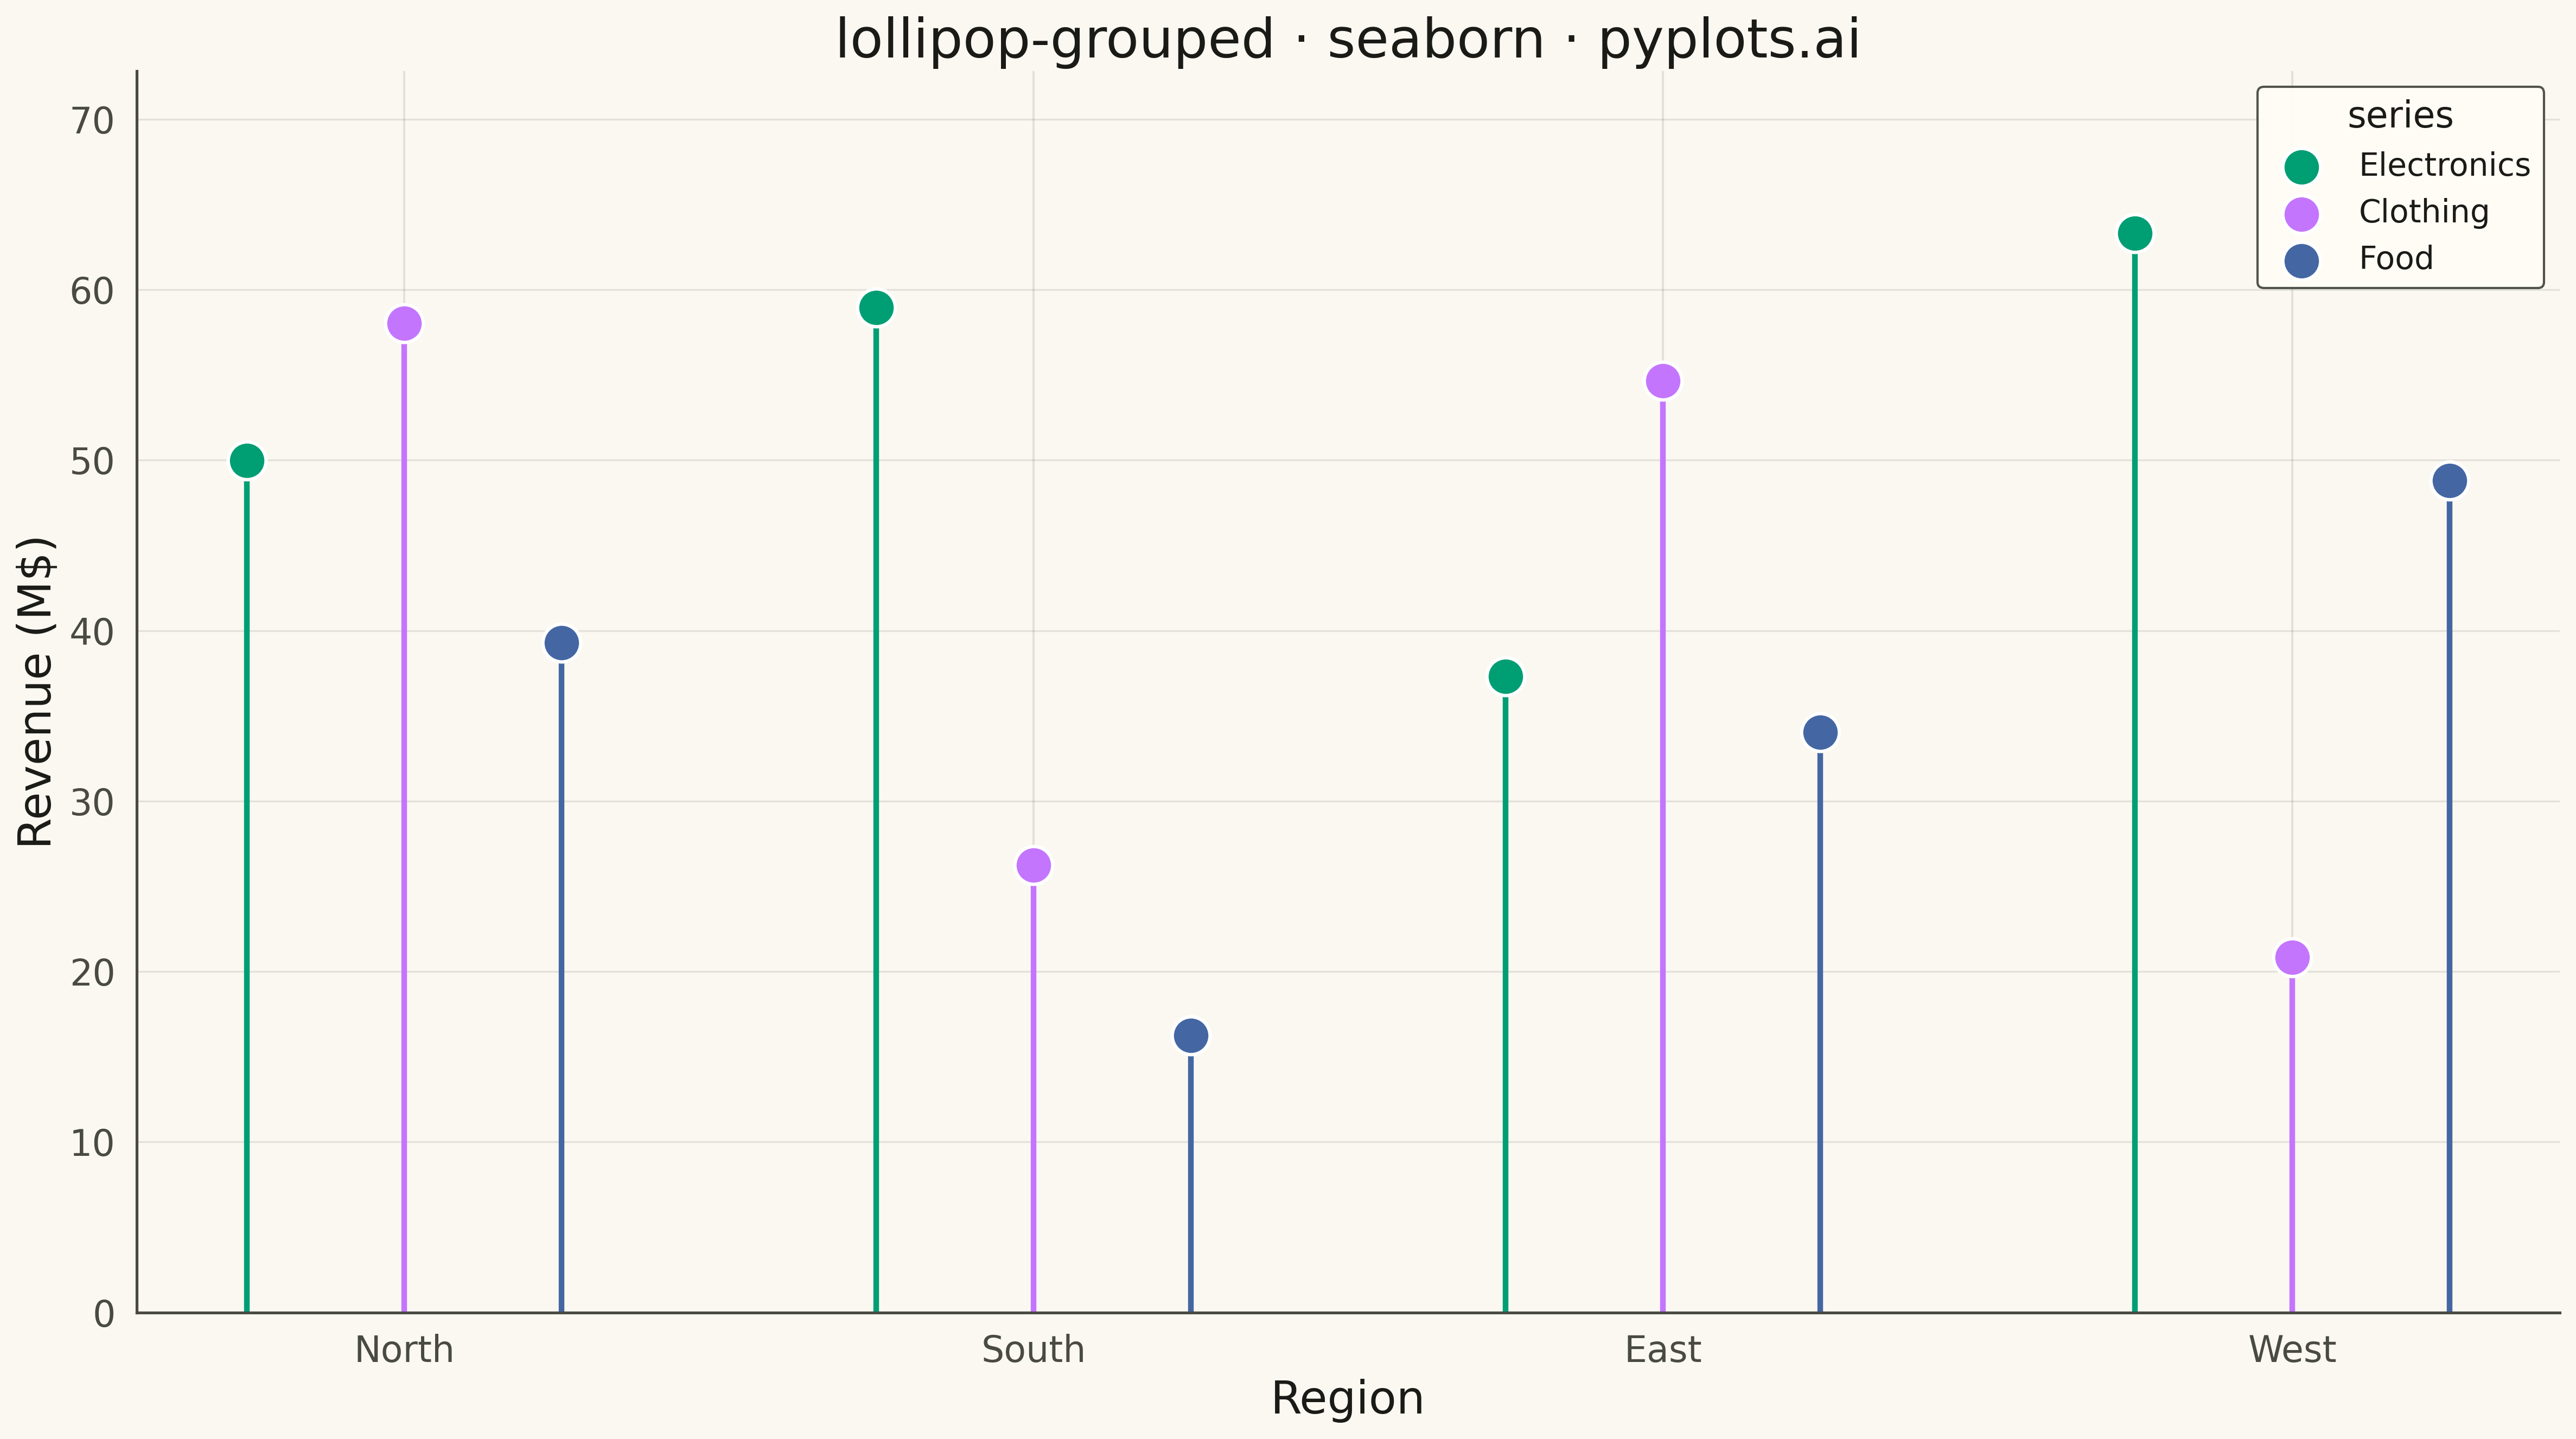
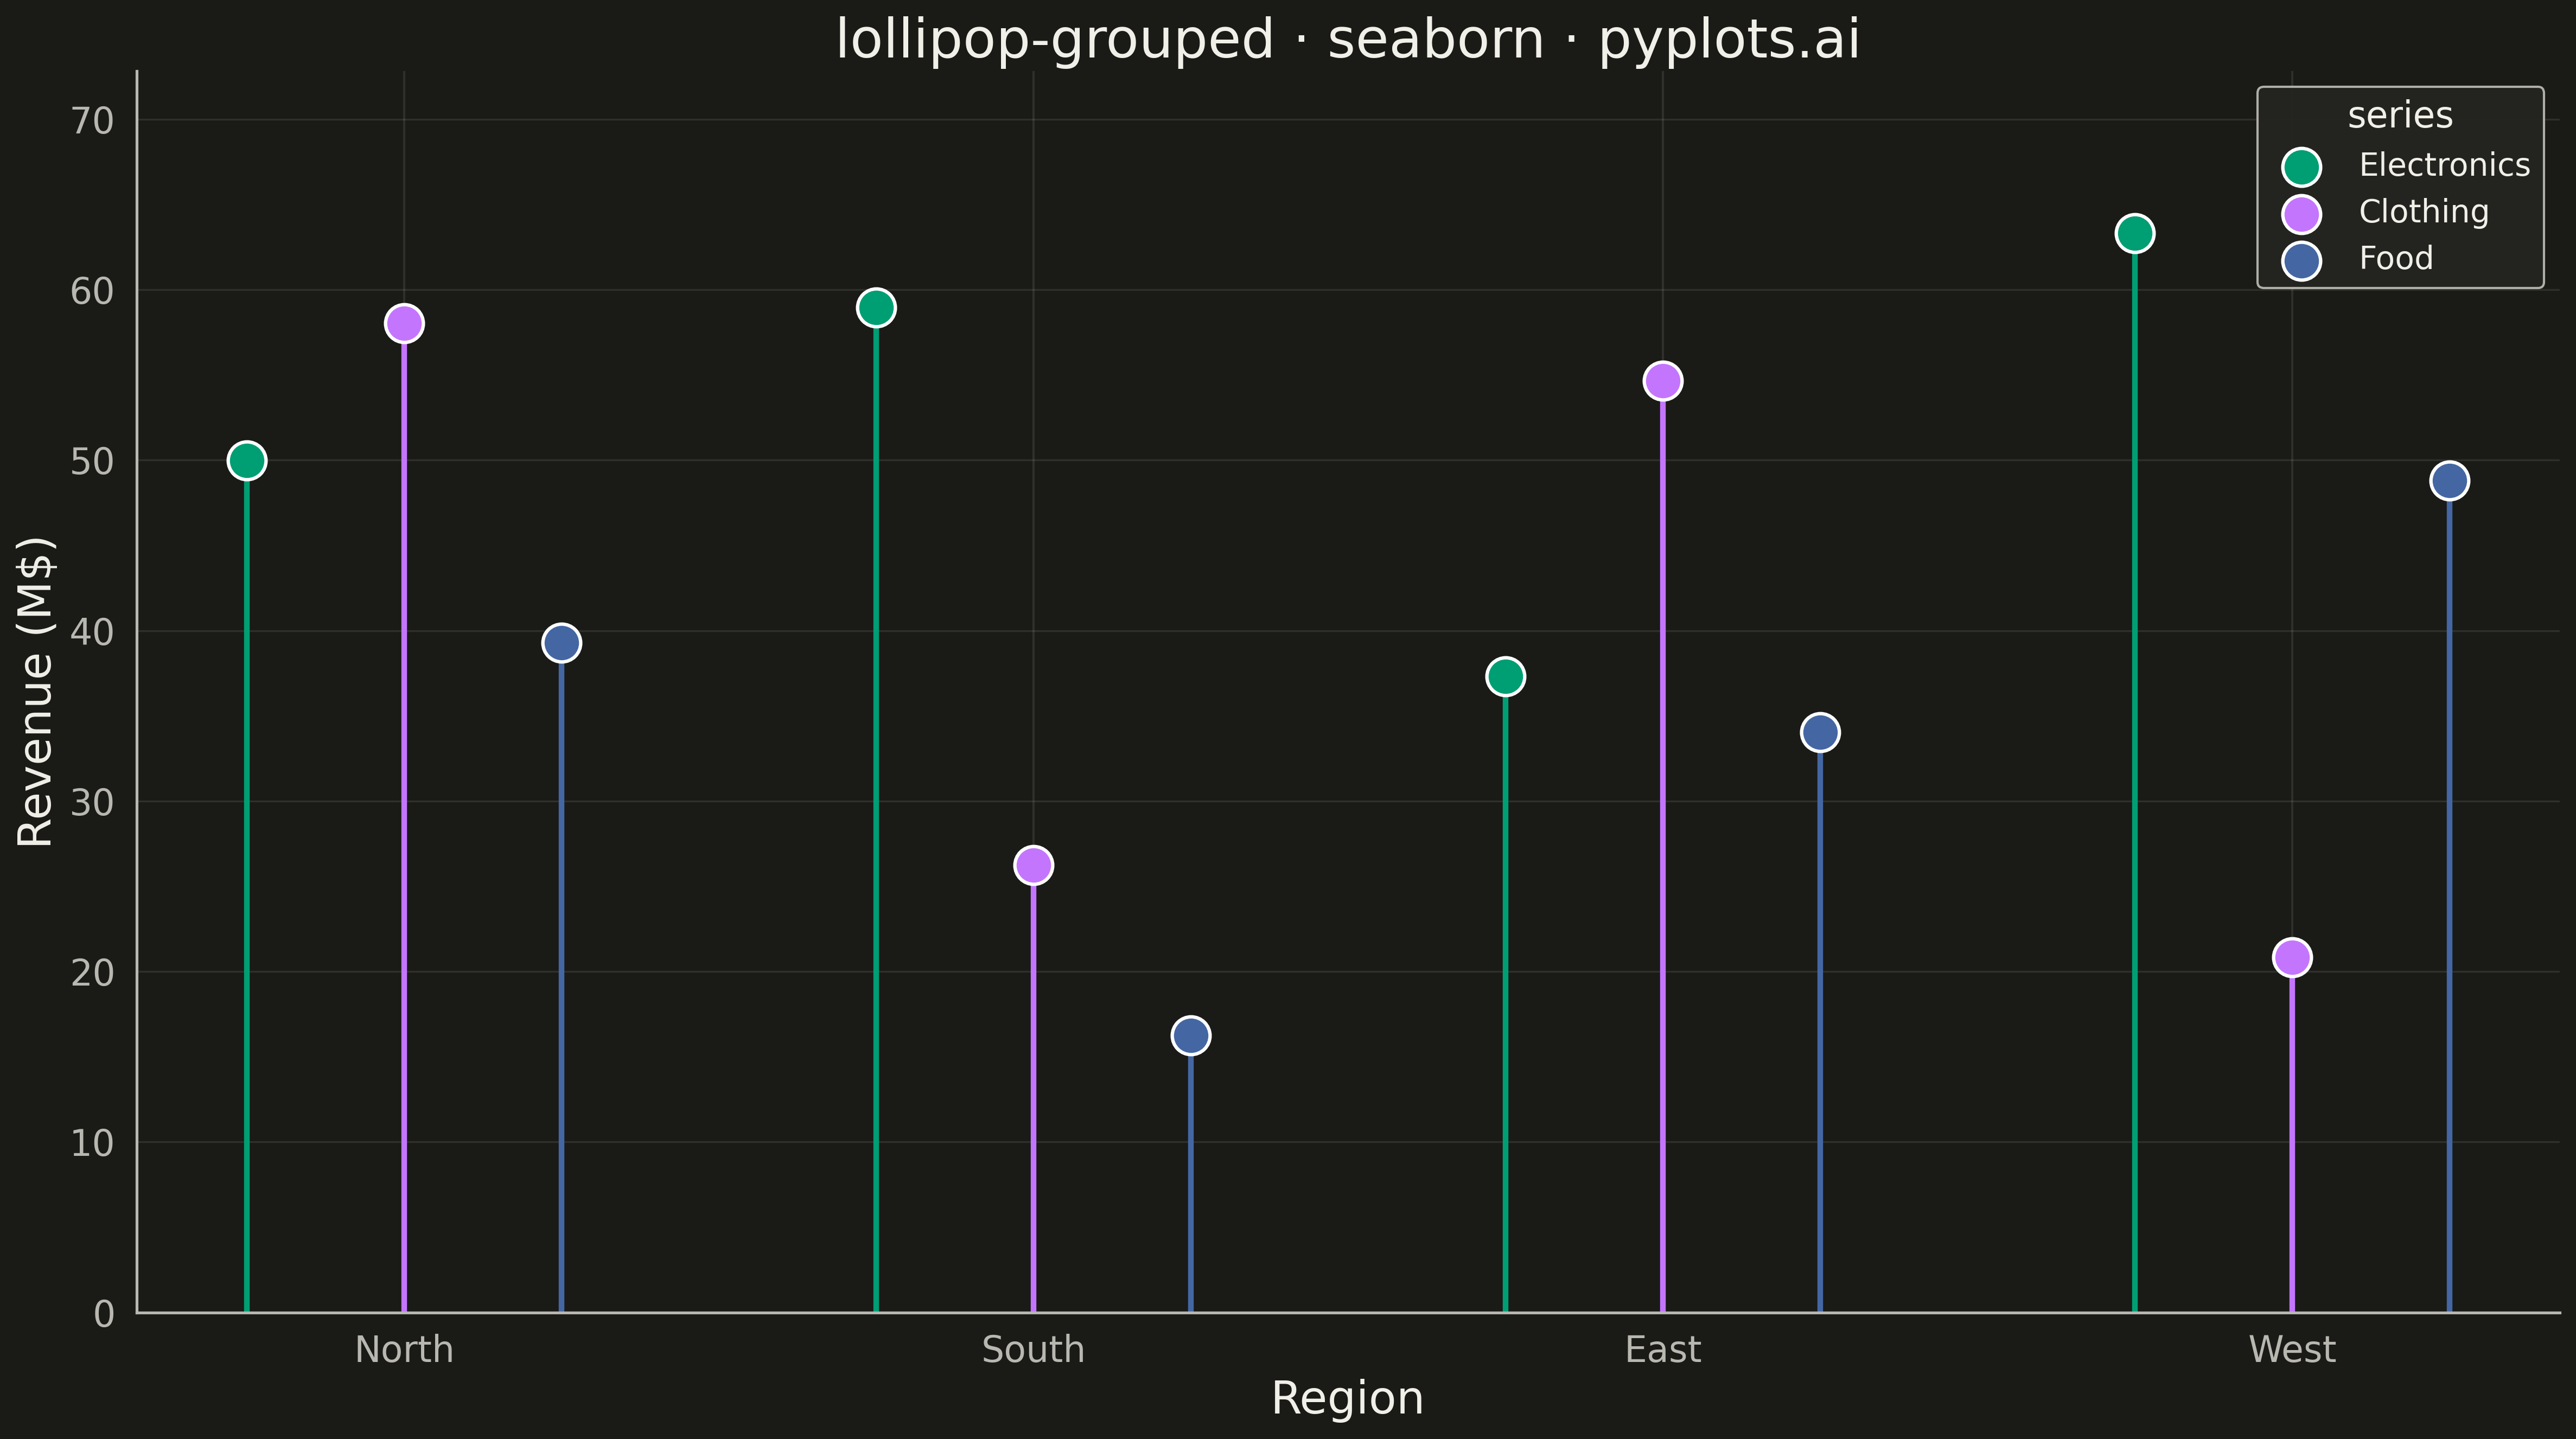
A grouped lollipop chart displays multiple series across categorical variables using thin stems and circular markers arranged in groups. Each category has multiple lollipops side by side, one for each series, enabling direct comparison of metrics across groups. It combines the clarity of dot plots with the organization of grouped bar charts while reducing visual clutter.
""" anyplot.ai
lollipop-grouped: Grouped Lollipop Chart
Library: seaborn 0.13.2 | Python 3.13.13
Quality: 81/100 | Updated: 2026-05-17
"""

import os

import matplotlib.pyplot as plt
import numpy as np
import pandas as pd
import seaborn as sns


# Theme tokens
THEME = os.getenv("ANYPLOT_THEME", "light")
PAGE_BG = "#FAF8F1" if THEME == "light" else "#1A1A17"
ELEVATED_BG = "#FFFDF6" if THEME == "light" else "#242420"
INK = "#1A1A17" if THEME == "light" else "#F0EFE8"
INK_SOFT = "#4A4A44" if THEME == "light" else "#B8B7B0"
RULE = "rgba(26,26,23,0.10)" if THEME == "light" else "rgba(240,239,232,0.10)"

# Apply seaborn theme with theme-adaptive colors
sns.set_theme(
    style="whitegrid",
    rc={
        "figure.facecolor": PAGE_BG,
        "axes.facecolor": PAGE_BG,
        "axes.edgecolor": INK_SOFT,
        "axes.labelcolor": INK,
        "text.color": INK,
        "xtick.color": INK_SOFT,
        "ytick.color": INK_SOFT,
        "grid.color": INK,
        "grid.alpha": 0.10,
        "legend.facecolor": ELEVATED_BG,
        "legend.edgecolor": INK_SOFT,
    },
)

# Data - Quarterly revenue by product line across regions
np.random.seed(42)
categories = ["North", "South", "East", "West"]
series = ["Electronics", "Clothing", "Food"]
n_categories = len(categories)
n_series = len(series)

# Generate realistic revenue data with wider range (in millions)
data = []
base_values = {"Electronics": 50, "Clothing": 35, "Food": 25}
for cat in categories:
    for s in series:
        # Wider range to improve data quality
        value = base_values[s] + np.random.uniform(-15, 25)
        data.append({"Region": cat, "series": s, "Revenue (M$)": value})

df = pd.DataFrame(data)

# Create figure
fig, ax = plt.subplots(figsize=(16, 9))

# Okabe-Ito palette (positions 1, 2, 3) - first series is always #009E73
colors = ["#009E73", "#C475FD", "#4467A3"]

# Calculate positions for grouped lollipops
x = np.arange(n_categories)
width = 0.25
offsets = np.linspace(-width * (n_series - 1) / 2, width * (n_series - 1) / 2, n_series)

# Plot lollipops for each series using seaborn styling + manual positioning
for i, (s, color) in enumerate(zip(series, colors, strict=True)):
    series_data = df[df["series"] == s]
    positions = x + offsets[i]
    values = series_data["Revenue (M$)"].values

    # Draw stems (vertical lines from 0 to value)
    for pos, val in zip(positions, values, strict=True):
        ax.plot([pos, pos], [0, val], color=color, linewidth=2.5, zorder=1)

    # Draw markers at the top with white edges for definition
    ax.scatter(positions, values, s=280, color=color, zorder=2, label=s, edgecolors="white", linewidths=1.5)

# Customize axes
ax.set_xticks(x)
ax.set_xticklabels(categories)
ax.set_xlabel("Region", fontsize=20, color=INK)
ax.set_ylabel("Revenue (M$)", fontsize=20, color=INK)
ax.set_title("lollipop-grouped · seaborn · pyplots.ai", fontsize=24, color=INK)
ax.tick_params(axis="both", labelsize=16, colors=INK_SOFT)

# Set y-axis to start from 0
ax.set_ylim(0, df["Revenue (M$)"].max() * 1.15)

# Grid styling (y-axis only, subtle)
ax.grid(True, axis="y", alpha=0.10, linestyle="-", linewidth=0.8)
ax.set_axisbelow(True)

# Spine styling
ax.spines["top"].set_visible(False)
ax.spines["right"].set_visible(False)
ax.spines["left"].set_color(INK_SOFT)
ax.spines["bottom"].set_color(INK_SOFT)

# Legend styling
legend = ax.legend(title="series", fontsize=14, title_fontsize=16, loc="upper right", framealpha=0.95)
legend.get_frame().set_facecolor(ELEVATED_BG)
legend.get_frame().set_edgecolor(INK_SOFT)
if legend.get_title():
    legend.get_title().set_color(INK)

plt.tight_layout()
plt.savefig(f"plot-{THEME}.png", dpi=300, bbox_inches="tight", facecolor=PAGE_BG)
Runnable source as JSON, for any HTTP client: https://api.anyplot.ai/specs/lollipop-grouped/seaborn/code. Any spec id and library id listed in llms-full.txt fit the same URL shape; every URL below is complete and callable.
{
  "spec_id": "lollipop-grouped",
  "language": "python",
  "library": "seaborn",
  "page": "https://anyplot.ai/lollipop-grouped/python/seaborn",
  "hub": "https://anyplot.ai/lollipop-grouped",
  "code_json": "https://api.anyplot.ai/specs/lollipop-grouped/seaborn/code",
  "spec_json": "https://api.anyplot.ai/specs/lollipop-grouped",
  "render_light_png": "https://storage.googleapis.com/anyplot-images/plots/lollipop-grouped/python/seaborn/plot-light.png",
  "render_dark_png": "https://storage.googleapis.com/anyplot-images/plots/lollipop-grouped/python/seaborn/plot-dark.png",
  "quality_score": 81.0,
  "license": "MIT",
  "guide": "https://anyplot.ai/llms.txt"
}
Part of Grouped Lollipop Chart on anyplot.ai.