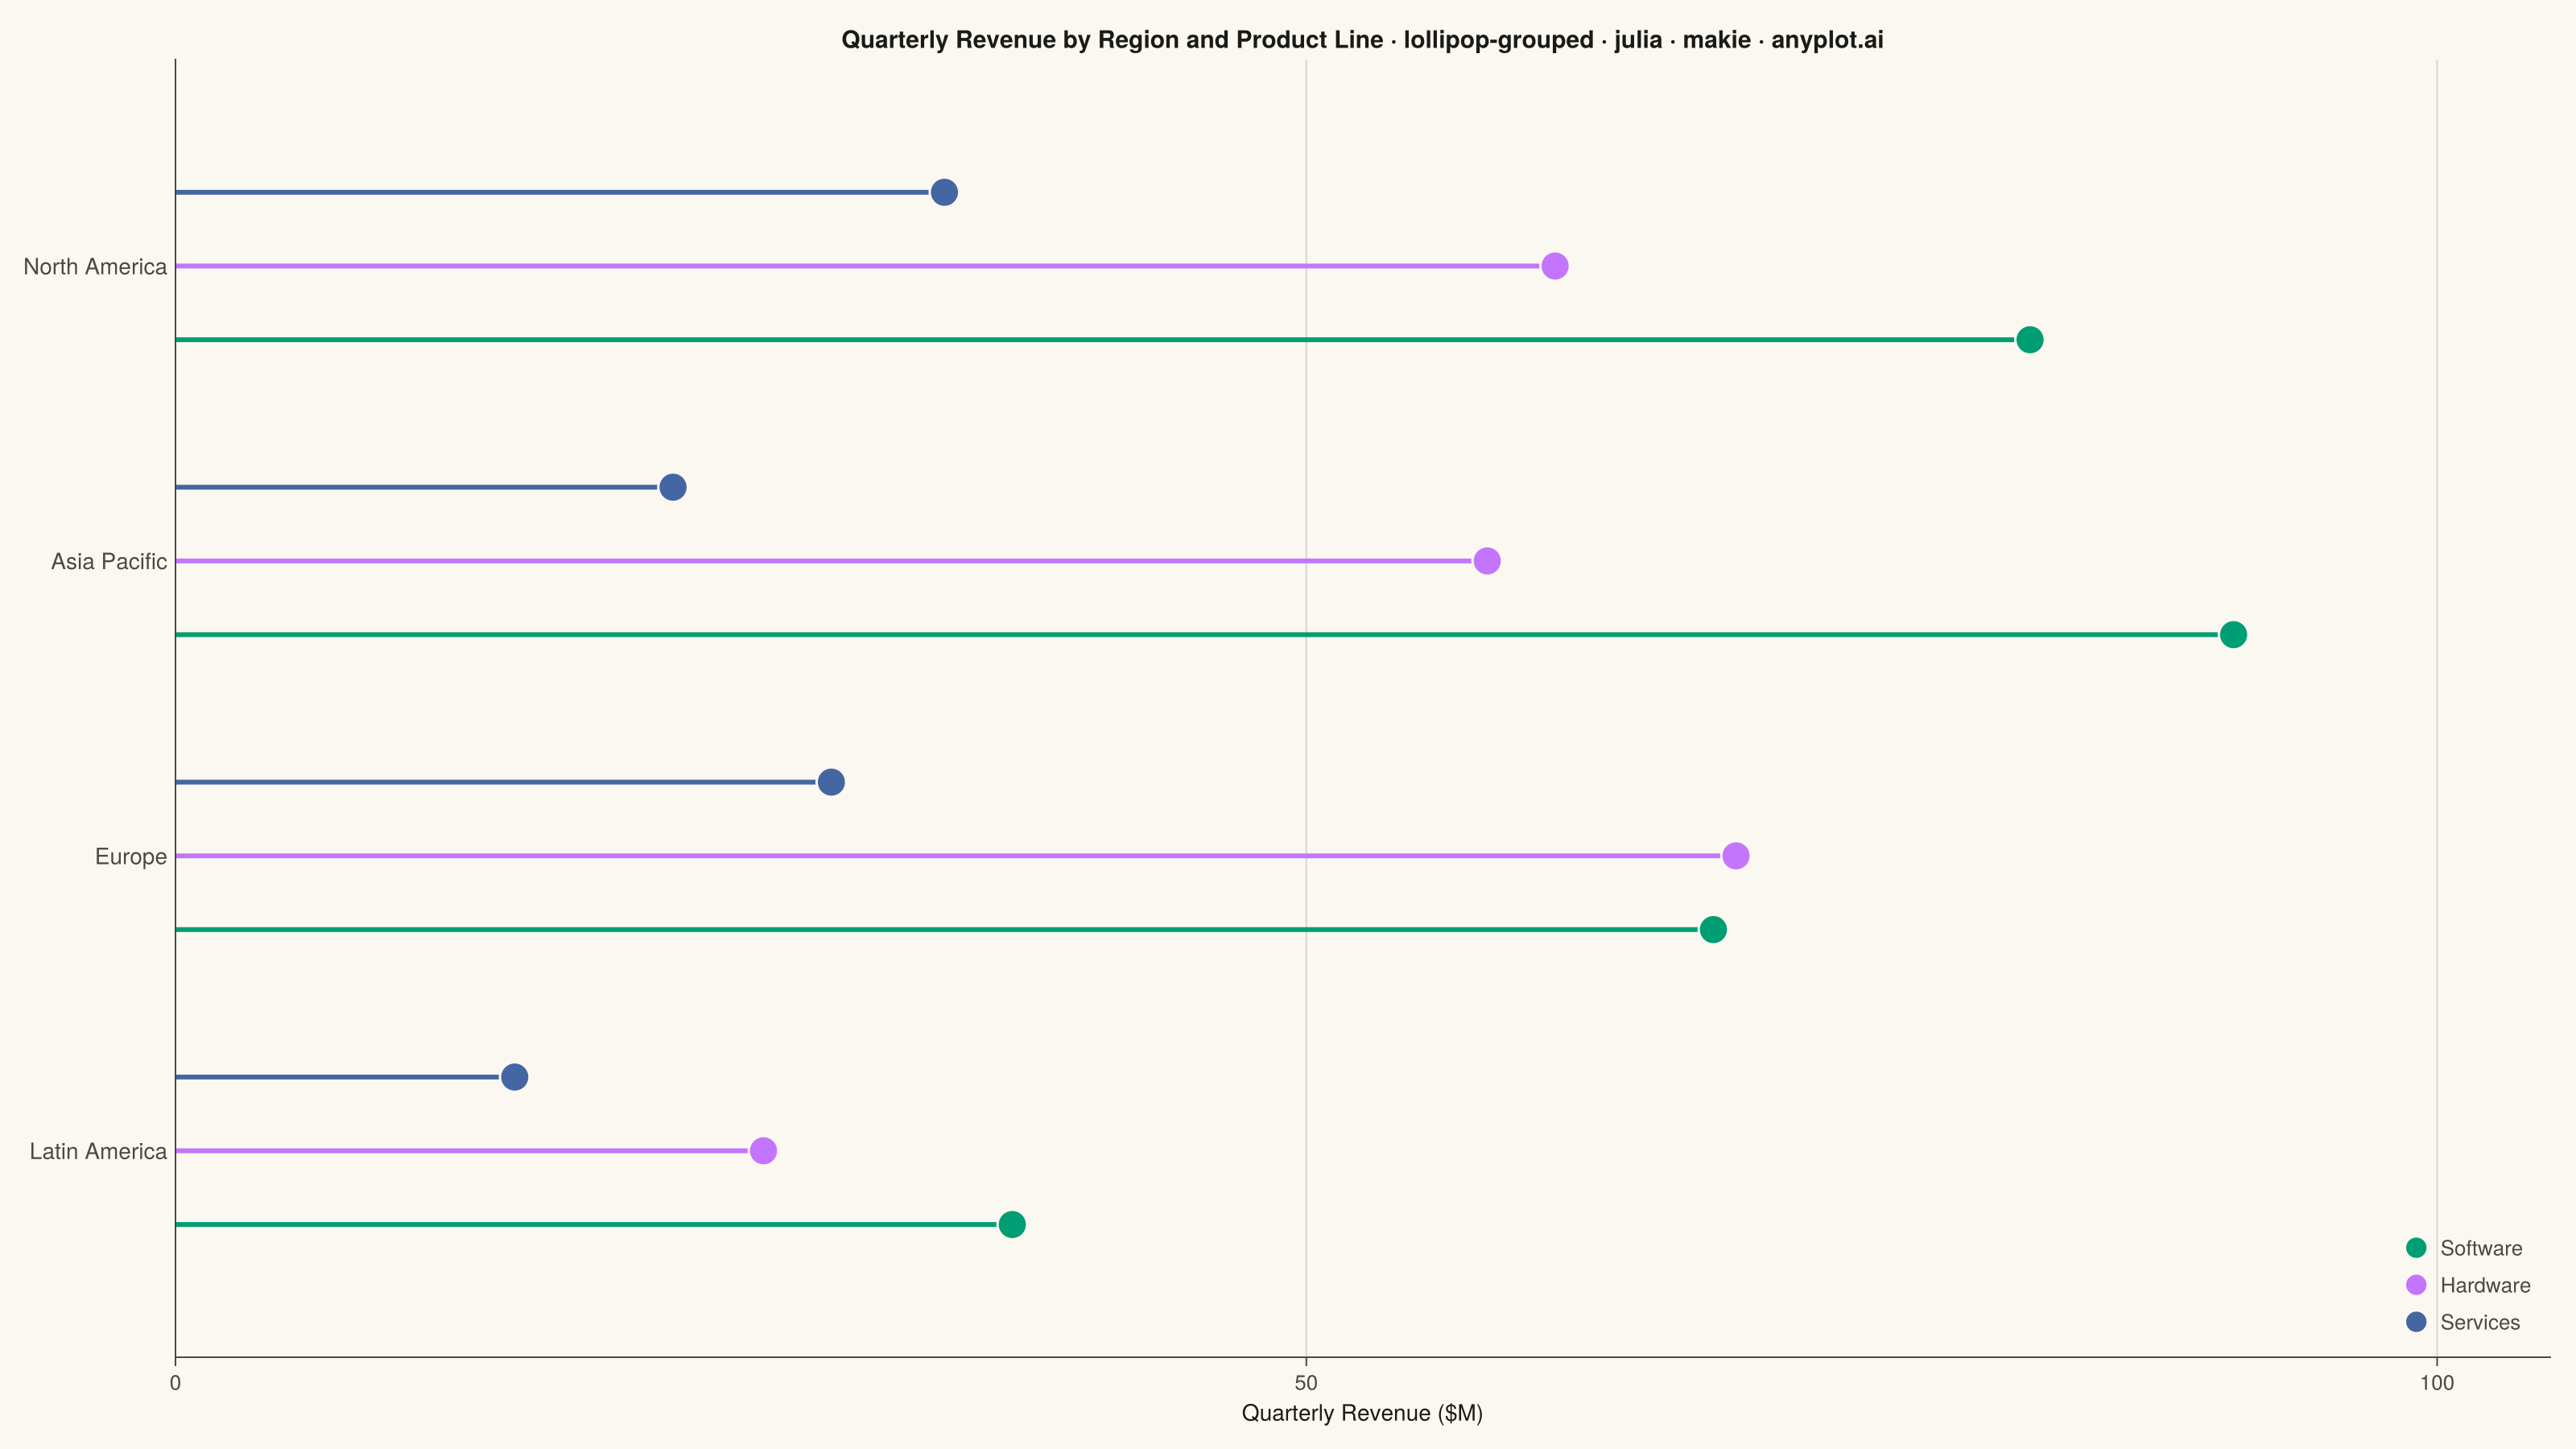
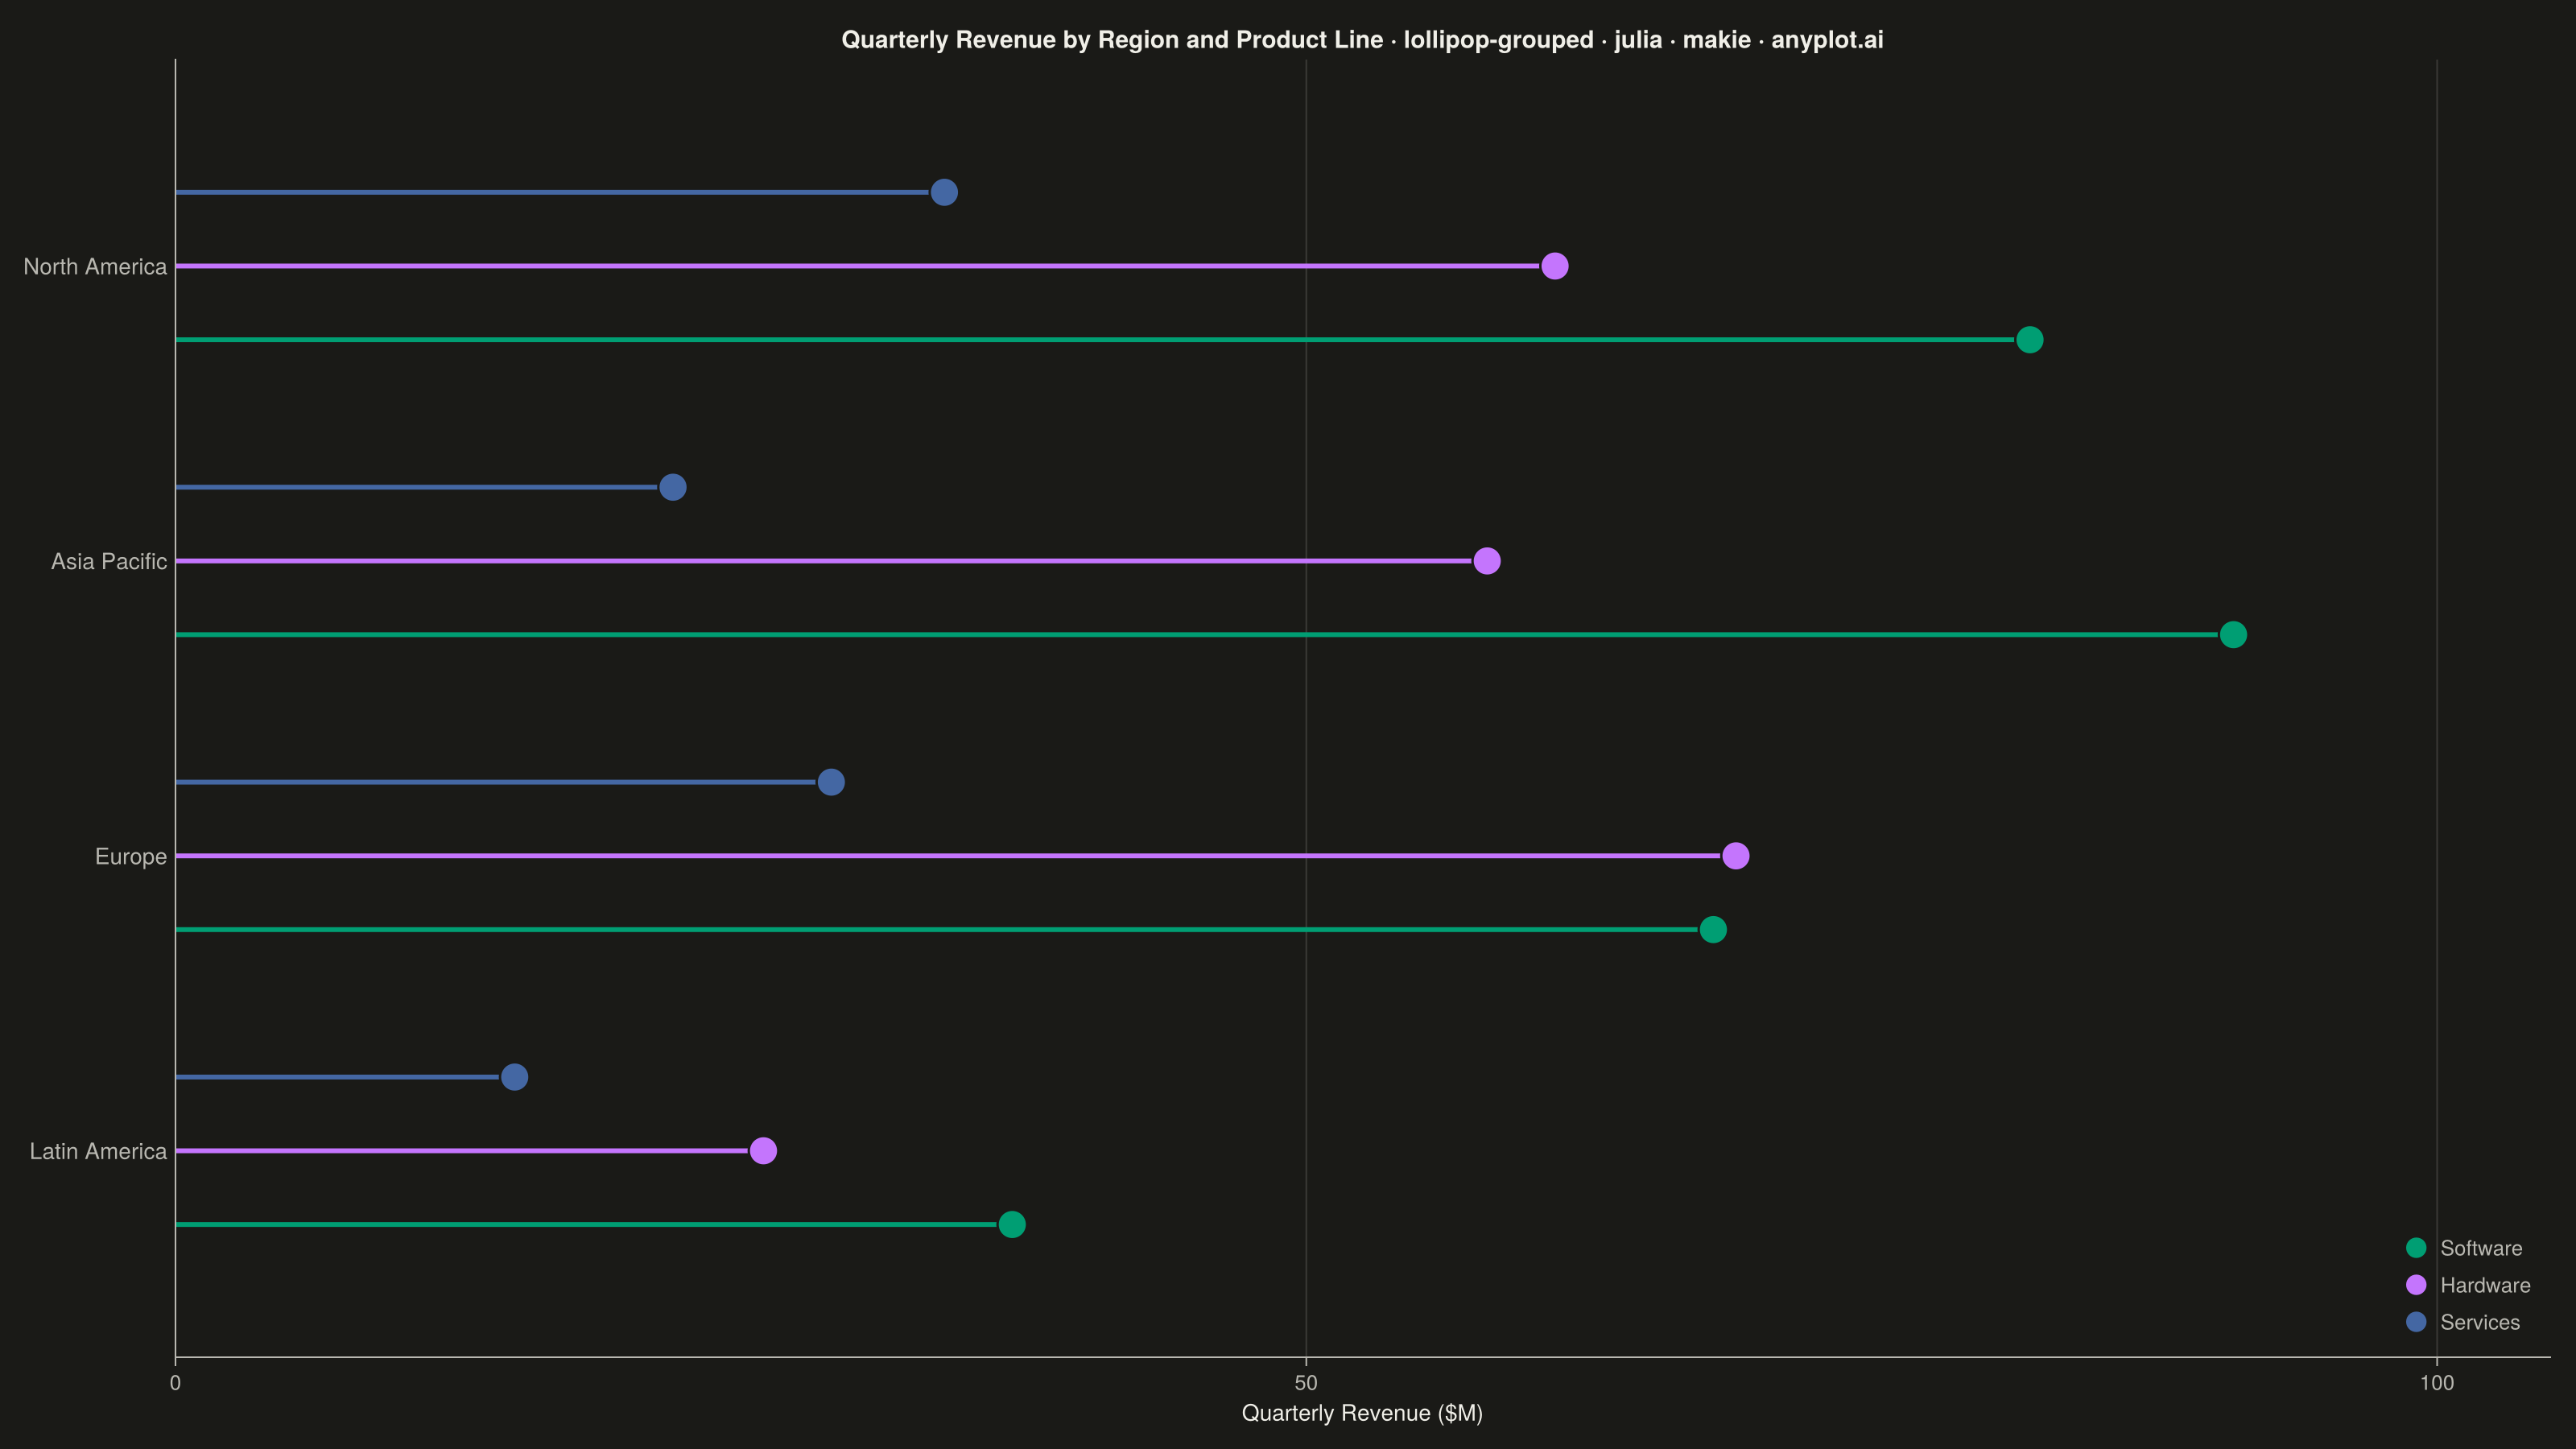
The same plot in 14 other libraries — Python: Altair, Bokeh, lets-plot, Matplotlib, Plotly, plotnine, Pygal, Seaborn; R: ggplot2; JavaScript: Chart.js, D3.js, Apache ECharts, Highcharts, MUI X Charts. Compare all 15 side by side: Grouped Lollipop Chart in Python, R, Julia and JavaScript.
A grouped lollipop chart displays multiple series across categorical variables using thin stems and circular markers arranged in groups. Each category has multiple lollipops side by side, one for each series, enabling direct comparison of metrics across groups. It combines the clarity of dot plots with the organization of grouped bar charts while reducing visual clutter.
# anyplot.ai
# lollipop-grouped: Grouped Lollipop Chart
# Library: makie 0.21.9 | Julia 1.11.9
# Quality: 88/100 | Created: 2026-09-02

using CairoMakie
using Colors
using Random

Random.seed!(42)

# --- Theme tokens -------------------------------------------------------
THEME = get(ENV, "ANYPLOT_THEME", "light")
PAGE_BG = THEME == "light" ? colorant"#FAF8F1" : colorant"#1A1A17"
INK = THEME == "light" ? colorant"#1A1A17" : colorant"#F0EFE8"
INK_SOFT = THEME == "light" ? colorant"#4A4A44" : colorant"#B8B7B0"
GRID_COLOR = RGBAf(INK.r, INK.g, INK.b, 0.15)

IMPRINT_PALETTE = [
    colorant"#009E73", colorant"#C475FD", colorant"#4467A3", colorant"#BD8233",
    colorant"#AE3030", colorant"#2ABCCD", colorant"#954477", colorant"#99B314",
]

# --- Data -----------------------------------------------------------------
# Quarterly revenue ($M) by product line, across regions. Regions are
# pre-sorted by total revenue descending so the chart reveals the ranking.
regions = ["North America", "Asia Pacific", "Europe", "Latin America"]
product_lines = ["Software", "Hardware", "Services"]

revenue = [
    82.0 61.0 34.0
    91.0 58.0 22.0
    68.0 69.0 29.0
    37.0 26.0 15.0
]

n_regions = length(regions)
n_series = length(product_lines)

# Discrete Makie colormap built from the Imprint palette — series are colored
# by mapping their integer index through this colormap (colorrange = (1,
# n_series)) rather than indexing IMPRINT_PALETTE[j] by hand at each call.
series_cmap = cgrad(IMPRINT_PALETTE[1:n_series]; categorical = true)

# Category band centers (top-to-bottom = first-to-last region) with a
# small side-by-side offset per series inside each band.
category_y = collect(n_regions:-1:1)
offsets = range(-0.25, 0.25; length = n_series)

# --- Plot -------------------------------------------------------------------
fig = Figure(
    resolution = (1600, 900),
    fontsize = 14,
    backgroundcolor = PAGE_BG,
)

ax = Axis(
    fig[1, 1];
    title = "Quarterly Revenue by Region and Product Line · lollipop-grouped · julia · makie · anyplot.ai",
    titlesize = 15,
    titlecolor = INK,
    xlabel = "Quarterly Revenue (\$M)",
    xlabelsize = 14,
    xlabelcolor = INK,
    xticklabelsize = 13,
    xticklabelcolor = INK_SOFT,
    yticklabelsize = 14,
    yticklabelcolor = INK_SOFT,
    backgroundcolor = PAGE_BG,
    topspinevisible = false,
    rightspinevisible = false,
    leftspinecolor = INK_SOFT,
    bottomspinecolor = INK_SOFT,
    xtickcolor = INK_SOFT,
    ytickcolor = INK_SOFT,
    yticksvisible = false,
    xgridcolor = GRID_COLOR,
    ygridvisible = false,
    xminorgridvisible = false,
)
ax.yticks = (category_y, regions)
xlims!(ax, 0, 105)
ylims!(ax, 0.3, n_regions + 0.7)

for j in 1:n_series
    ys = [category_y[i] + offsets[j] for i in 1:n_regions]
    xs = [revenue[i, j] for i in 1:n_regions]

    for i in 1:n_regions
        lines!(
            ax, [0.0, xs[i]], [ys[i], ys[i]];
            color = j, colormap = series_cmap, colorrange = (1, n_series),
            linewidth = 3,
        )
    end

    scatter!(
        ax, xs, ys;
        color = fill(j, n_regions),
        colormap = series_cmap,
        colorrange = (1, n_series),
        markersize = 26,
        strokewidth = 1.5,
        strokecolor = PAGE_BG,
    )
end

# Manual legend: colormap-mapped scatter/lines don't expose a per-series
# solid color for axislegend to sample, so the swatches are built explicitly
# from the same Imprint palette slots used for the plotted series.
legend_elements = [
    MarkerElement(; color = IMPRINT_PALETTE[j], marker = :circle, markersize = 18)
    for j in 1:n_series
]
axislegend(
    ax, legend_elements, product_lines;
    position = :rb, framevisible = false, labelcolor = INK_SOFT, labelsize = 13,
)

# --- Save -------------------------------------------------------------------
save("plot-$(THEME).png", fig; px_per_unit = 2)
Runnable source as JSON, for any HTTP client: https://api.anyplot.ai/specs/lollipop-grouped/makie/code. Any spec id and library id listed in llms-full.txt fit the same URL shape; every URL below is complete and callable.
{
  "spec_id": "lollipop-grouped",
  "language": "julia",
  "library": "makie",
  "page": "https://anyplot.ai/lollipop-grouped/julia/makie",
  "hub": "https://anyplot.ai/lollipop-grouped",
  "code_json": "https://api.anyplot.ai/specs/lollipop-grouped/makie/code",
  "spec_json": "https://api.anyplot.ai/specs/lollipop-grouped",
  "render_light_png": "https://storage.googleapis.com/anyplot-images/plots/lollipop-grouped/julia/makie/plot-light.png",
  "render_dark_png": "https://storage.googleapis.com/anyplot-images/plots/lollipop-grouped/julia/makie/plot-dark.png",
  "quality_score": 88.0,
  "license": "MIT",
  "guide": "https://anyplot.ai/llms.txt"
}
Part of Grouped Lollipop Chart on anyplot.ai.