The same plot in 14 other libraries — Python: Altair, Bokeh, lets-plot, Matplotlib, Plotly, plotnine, Pygal, Seaborn; Julia: Makie.jl; JavaScript: Chart.js, D3.js, Apache ECharts, Highcharts, MUI X Charts. Compare all 15 side by side: Grouped Lollipop Chart in Python, R, Julia and JavaScript.
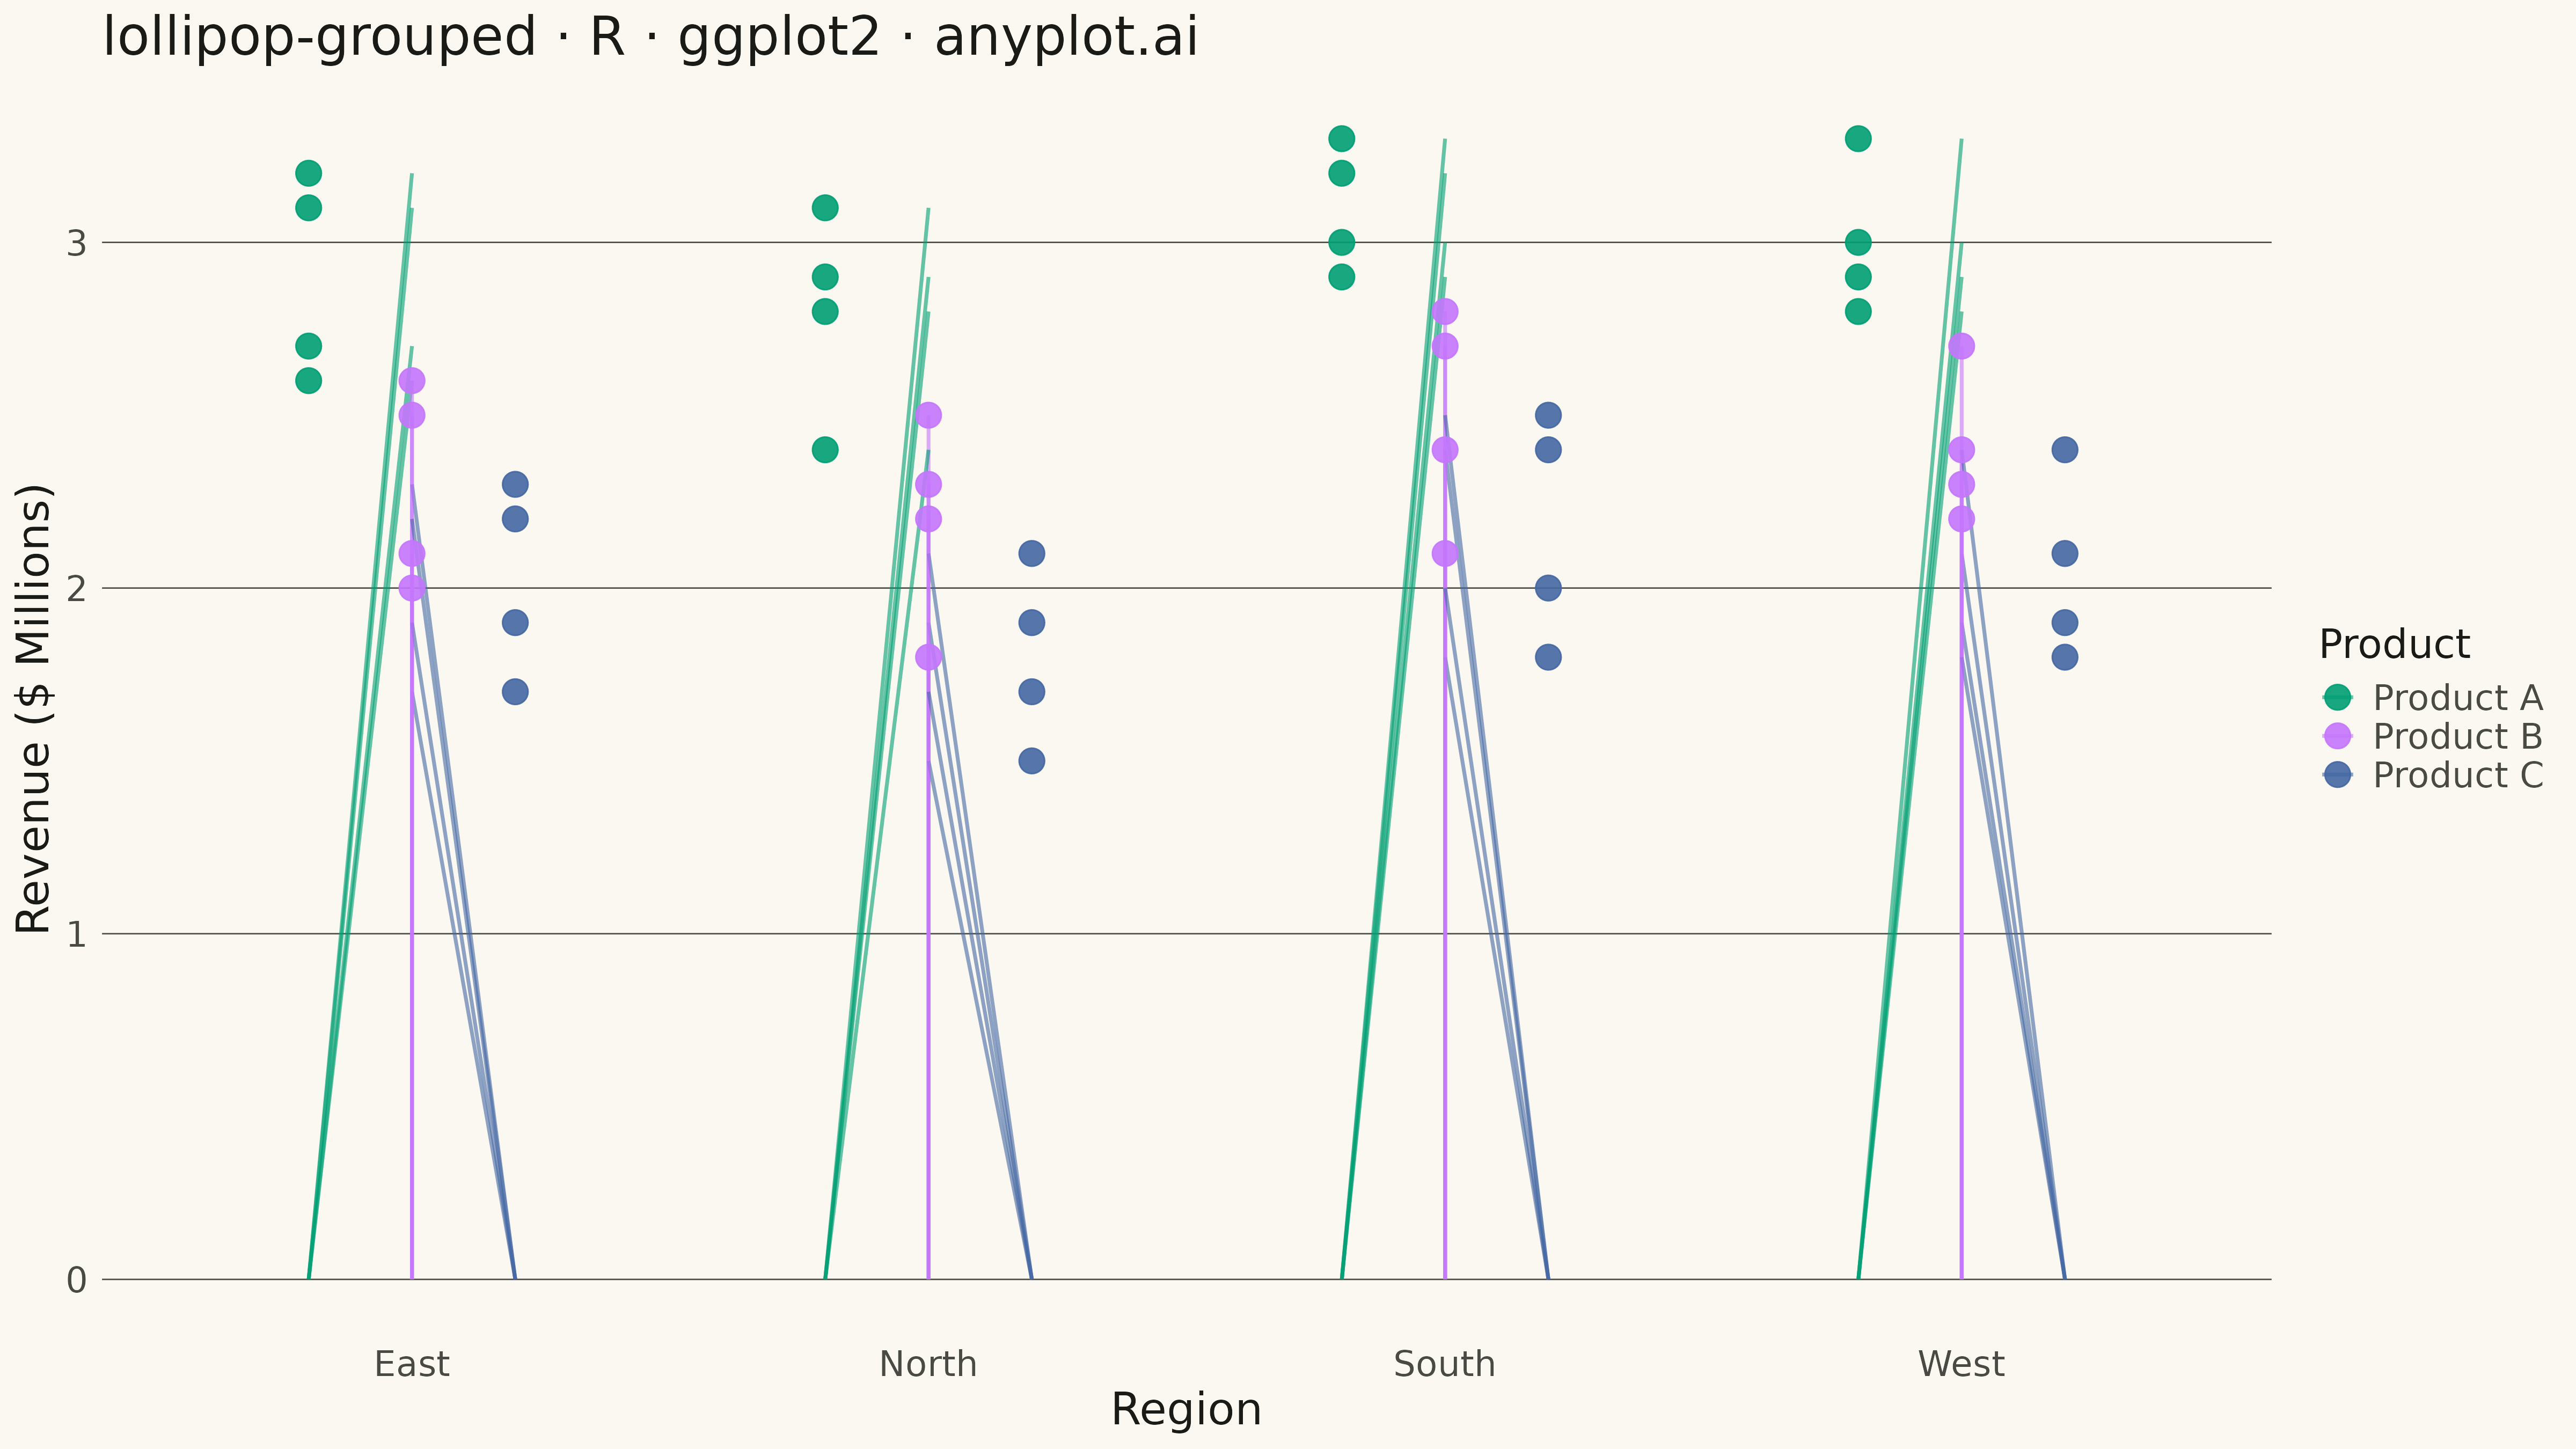
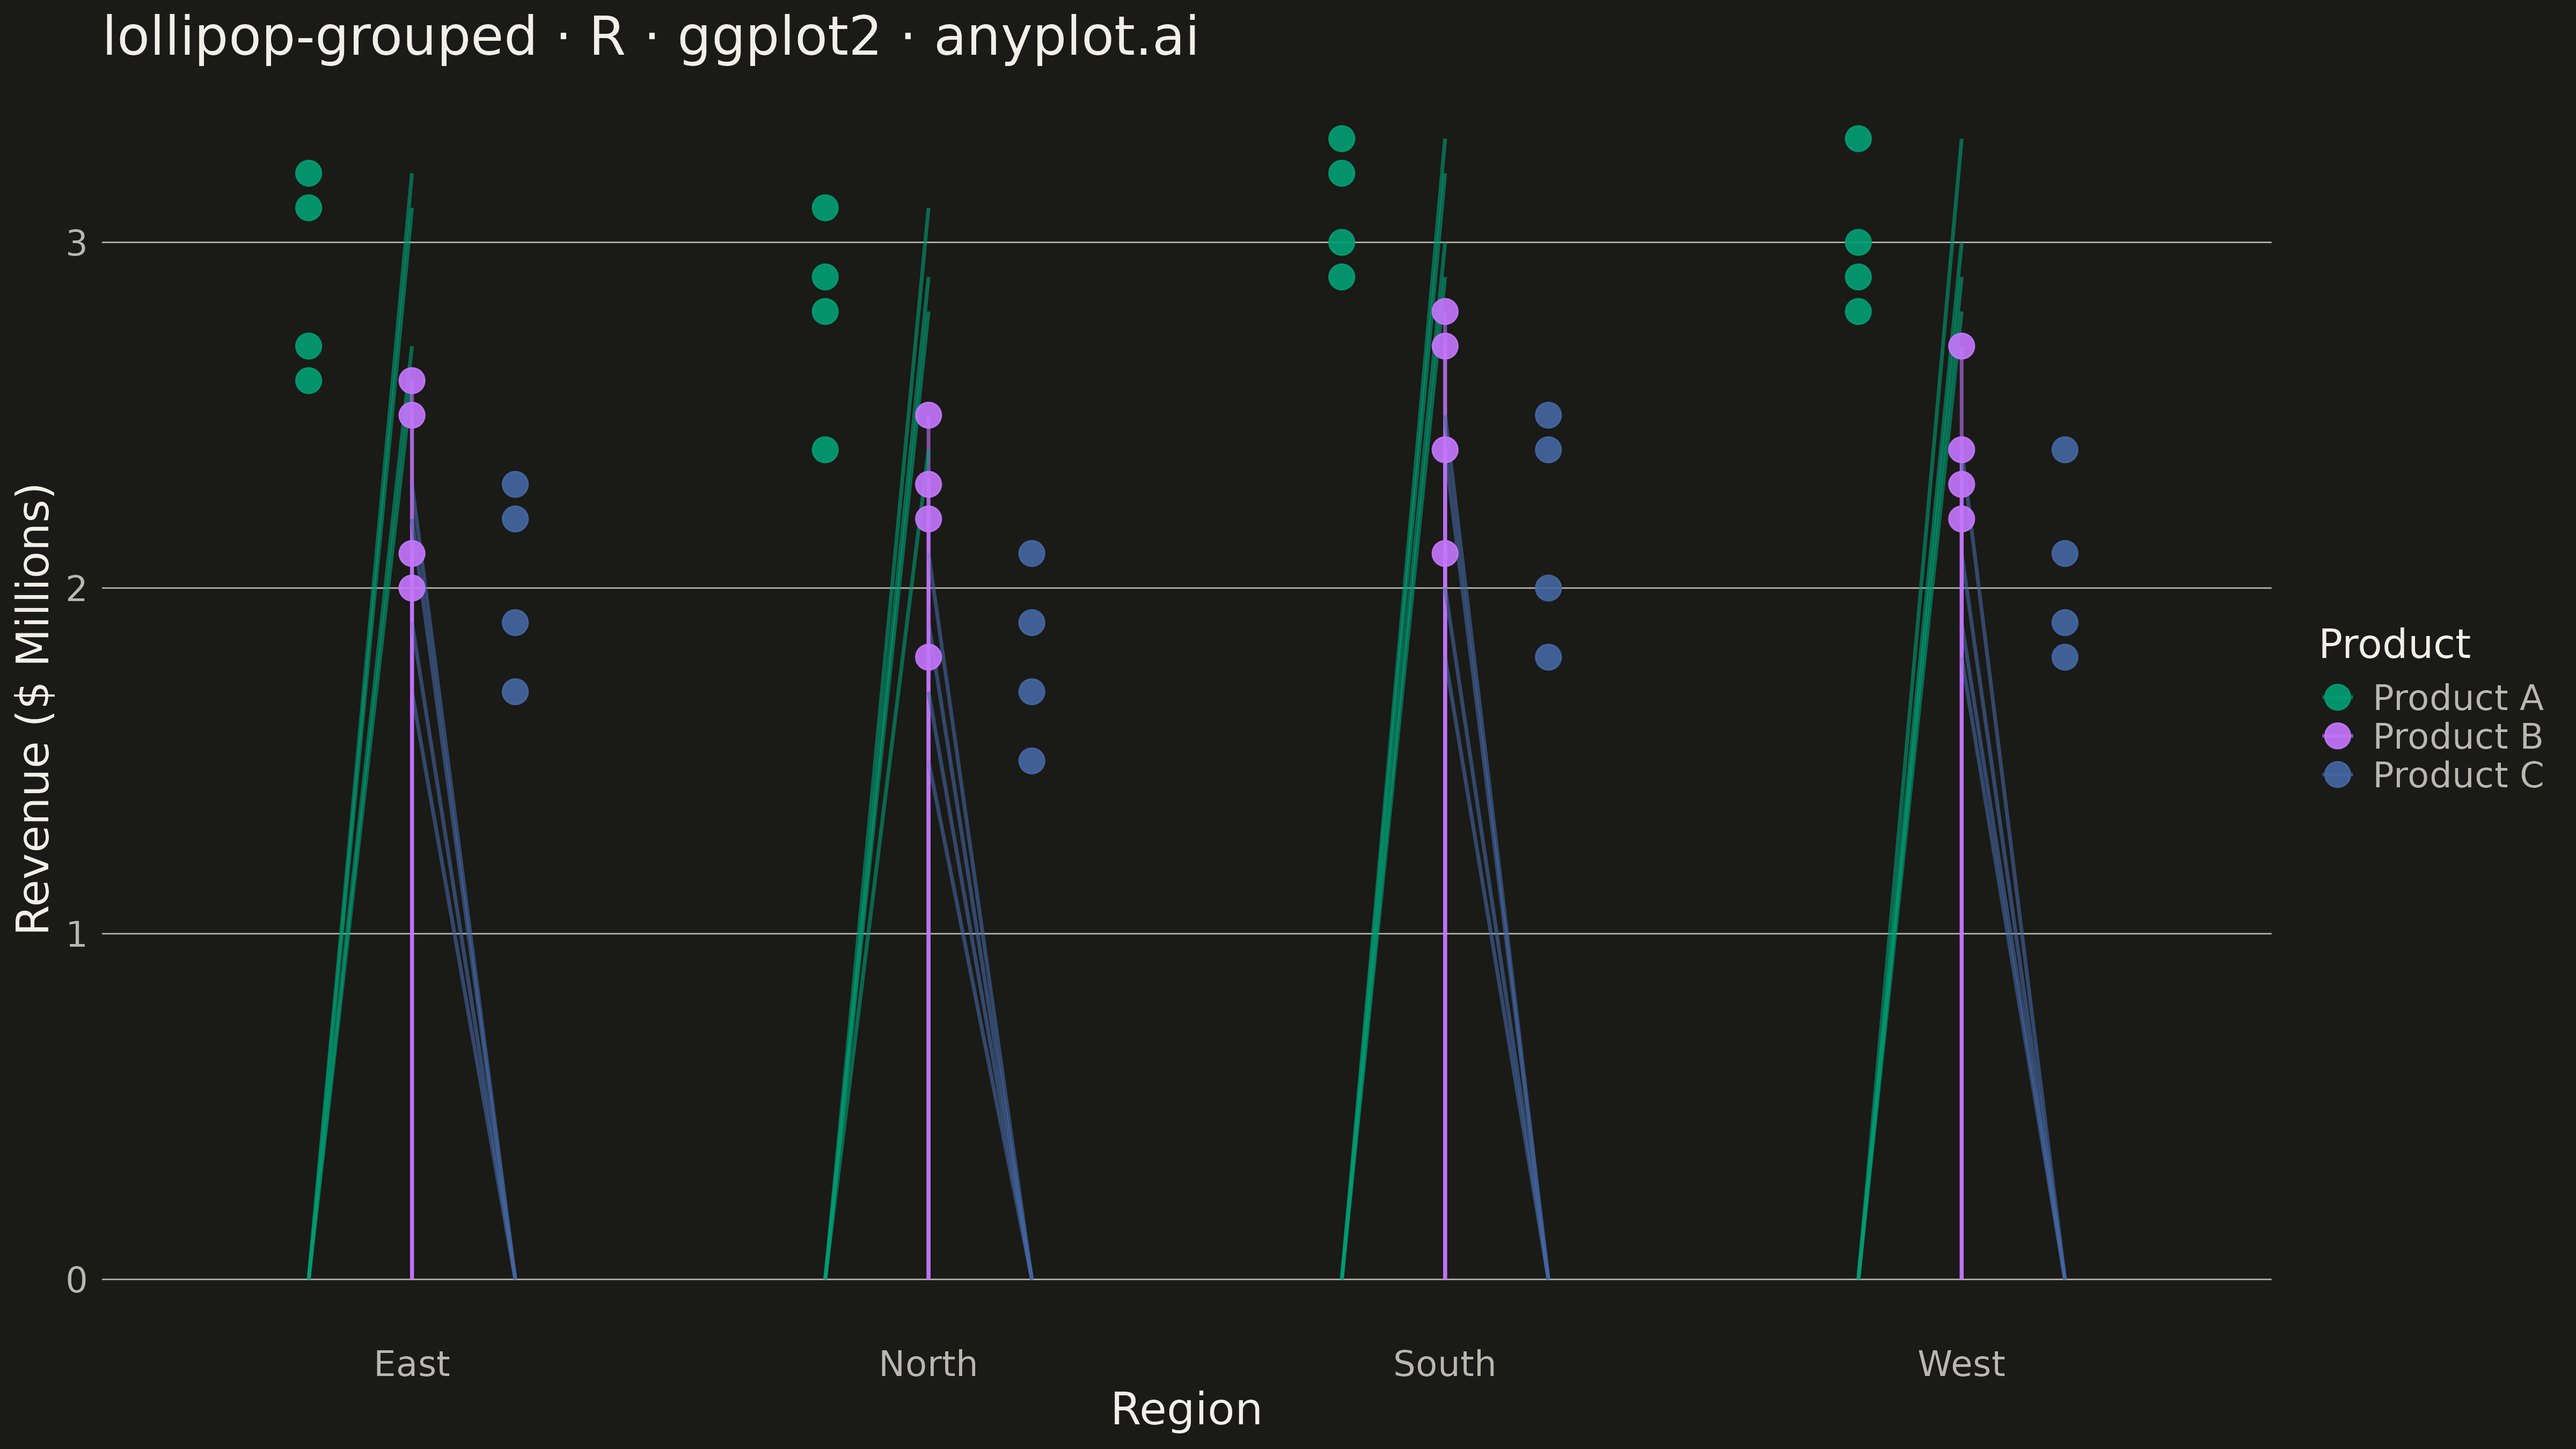
A grouped lollipop chart displays multiple series across categorical variables using thin stems and circular markers arranged in groups. Each category has multiple lollipops side by side, one for each series, enabling direct comparison of metrics across groups. It combines the clarity of dot plots with the organization of grouped bar charts while reducing visual clutter.
#' anyplot.ai
#' lollipop-grouped: Grouped Lollipop Chart
#' Library: ggplot2 3.5.1 | R 4.4.1
#' Quality: 84/100 | Created: 2026-05-17

library(ggplot2)
library(dplyr)
library(ragg)

set.seed(42)

# --- Theme tokens -----------------------------------------------------------
THEME       <- Sys.getenv("ANYPLOT_THEME", "light")
PAGE_BG     <- if (THEME == "light") "#FAF8F1" else "#1A1A17"
INK         <- if (THEME == "light") "#1A1A17" else "#F0EFE8"
INK_SOFT    <- if (THEME == "light") "#4A4A44" else "#B8B7B0"
IMPRINT   <- c("#009E73", "#C475FD", "#4467A3", "#BD8233",
                 "#AE3030", "#2ABCCD", "#954477")

# --- Data -------------------------------------------------------------------
# Sales revenue (millions) by product line across regions
data <- tibble::tibble(
  region = rep(c("North", "South", "East", "West"), each = 12),
  product = rep(rep(c("Product A", "Product B", "Product C"), times = 4), times = 4),
  revenue = c(
    2.8, 2.2, 1.9,  # North
    3.1, 2.5, 2.1,
    2.4, 1.8, 1.5,
    2.9, 2.3, 1.7,

    3.2, 2.7, 2.4,  # South
    2.9, 2.1, 1.8,
    3.3, 2.8, 2.5,
    3.0, 2.4, 2.0,

    2.6, 2.0, 1.7,  # East
    3.2, 2.6, 2.3,
    2.7, 2.1, 1.9,
    3.1, 2.5, 2.2,

    3.0, 2.4, 2.1,  # West
    2.8, 2.3, 1.9,
    2.9, 2.2, 1.8,
    3.3, 2.7, 2.4
  )
)

# --- Plot -------------------------------------------------------------------
p <- ggplot(data, aes(x = region, y = revenue, color = product)) +
  geom_segment(
    aes(xend = region, y = 0, yend = revenue),
    position = position_dodge(width = 0.6),
    linewidth = 0.8,
    alpha = 0.6
  ) +
  geom_point(
    position = position_dodge(width = 0.6),
    size = 5,
    alpha = 0.9
  ) +
  scale_color_manual(
    name = "Product",
    values = c("Product A" = IMPRINT[1],
               "Product B" = IMPRINT[2],
               "Product C" = IMPRINT[3])
  ) +
  labs(
    title = "lollipop-grouped · R · ggplot2 · anyplot.ai",
    x = "Region",
    y = "Revenue ($ Millions)"
  ) +
  theme_minimal(base_size = 14) +
  theme(
    plot.background   = element_rect(fill = PAGE_BG, color = PAGE_BG),
    panel.background  = element_rect(fill = PAGE_BG, color = NA),
    panel.grid.major.y = element_line(color = INK_SOFT, linewidth = 0.3),
    panel.grid.minor  = element_blank(),
    panel.grid.major.x = element_blank(),
    axis.title        = element_text(color = INK, size = 20),
    axis.text         = element_text(color = INK_SOFT, size = 16),
    plot.title        = element_text(color = INK, size = 24),
    legend.background = element_rect(fill = PAGE_BG, color = NA),
    legend.text       = element_text(color = INK_SOFT, size = 16),
    legend.title      = element_text(color = INK, size = 18),
    legend.position   = "right"
  )

# --- Save -------------------------------------------------------------------
ggsave(
  filename = sprintf("plot-%s.png", THEME),
  plot     = p,
  device   = ragg::agg_png,
  width    = 16,
  height   = 9,
  units    = "in",
  dpi      = 300
)
Runnable source as JSON, for any HTTP client: https://api.anyplot.ai/specs/lollipop-grouped/ggplot2/code. Any spec id and library id listed in llms-full.txt fit the same URL shape; every URL below is complete and callable.
{
  "spec_id": "lollipop-grouped",
  "language": "r",
  "library": "ggplot2",
  "page": "https://anyplot.ai/lollipop-grouped/r/ggplot2",
  "hub": "https://anyplot.ai/lollipop-grouped",
  "code_json": "https://api.anyplot.ai/specs/lollipop-grouped/ggplot2/code",
  "spec_json": "https://api.anyplot.ai/specs/lollipop-grouped",
  "render_light_png": "https://storage.googleapis.com/anyplot-images/plots/lollipop-grouped/r/ggplot2/plot-light.png",
  "render_dark_png": "https://storage.googleapis.com/anyplot-images/plots/lollipop-grouped/r/ggplot2/plot-dark.png",
  "quality_score": 84.0,
  "license": "MIT",
  "guide": "https://anyplot.ai/llms.txt"
}
Part of Grouped Lollipop Chart on anyplot.ai.