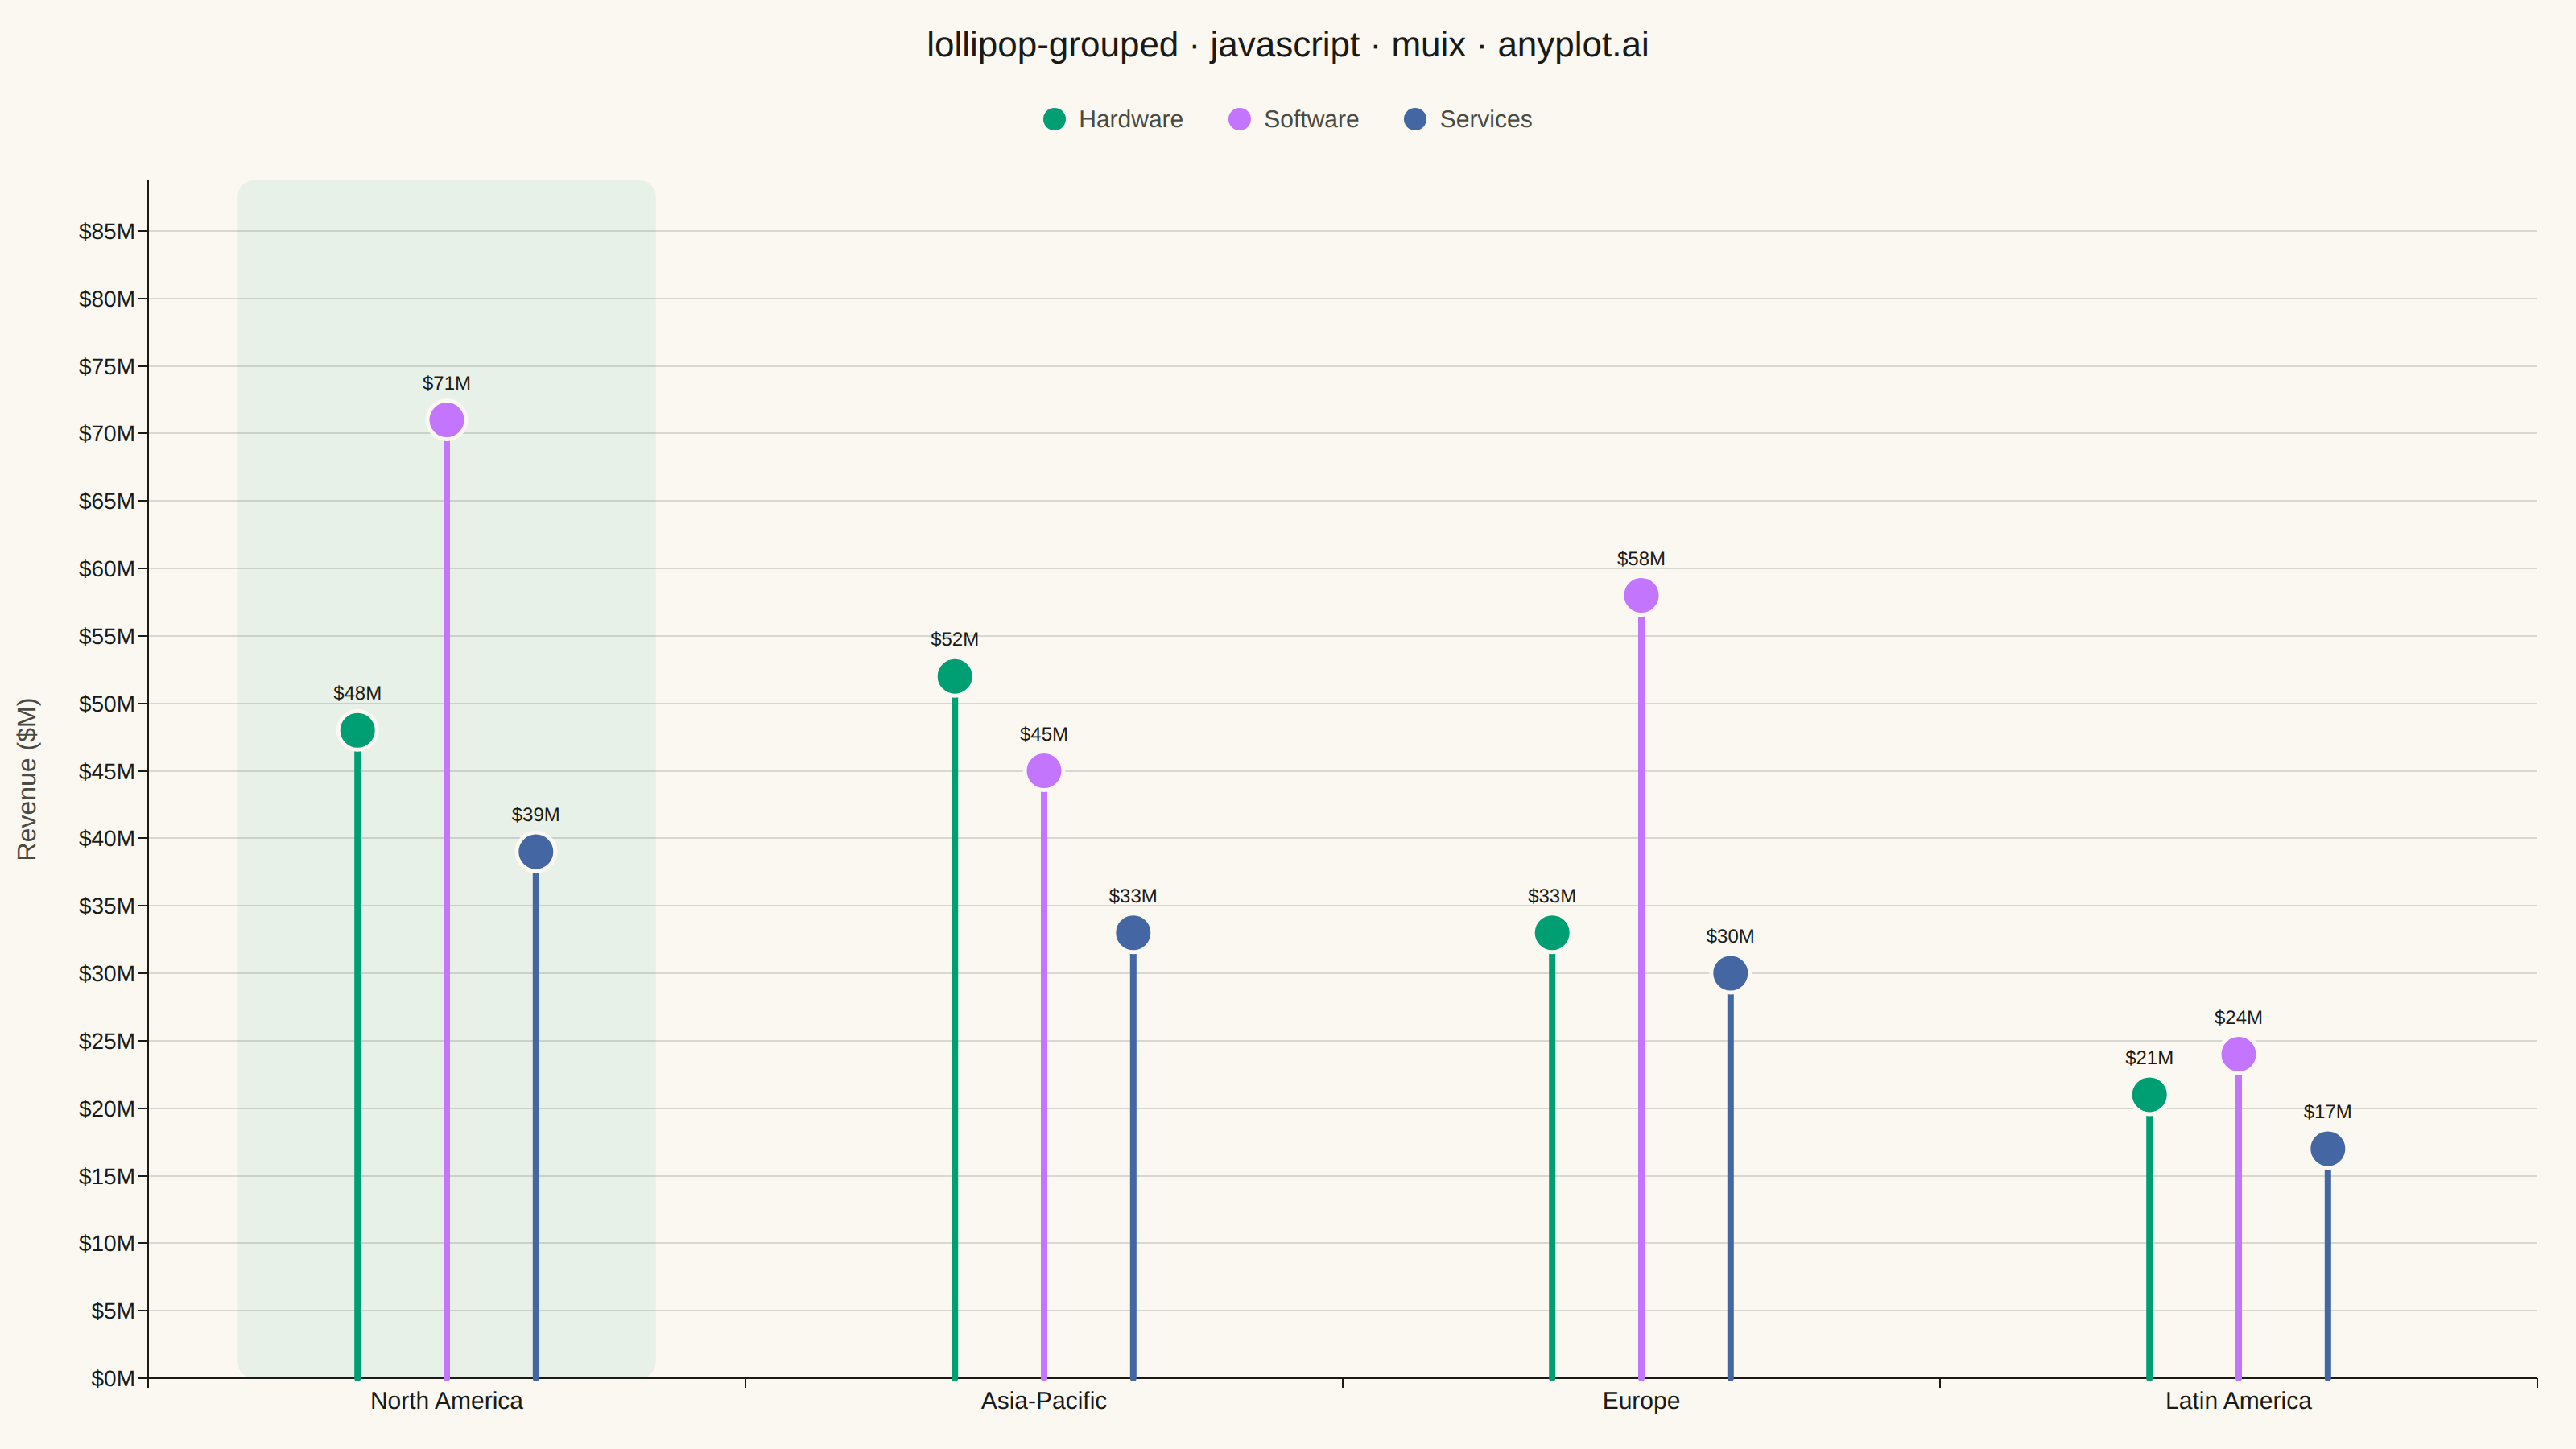
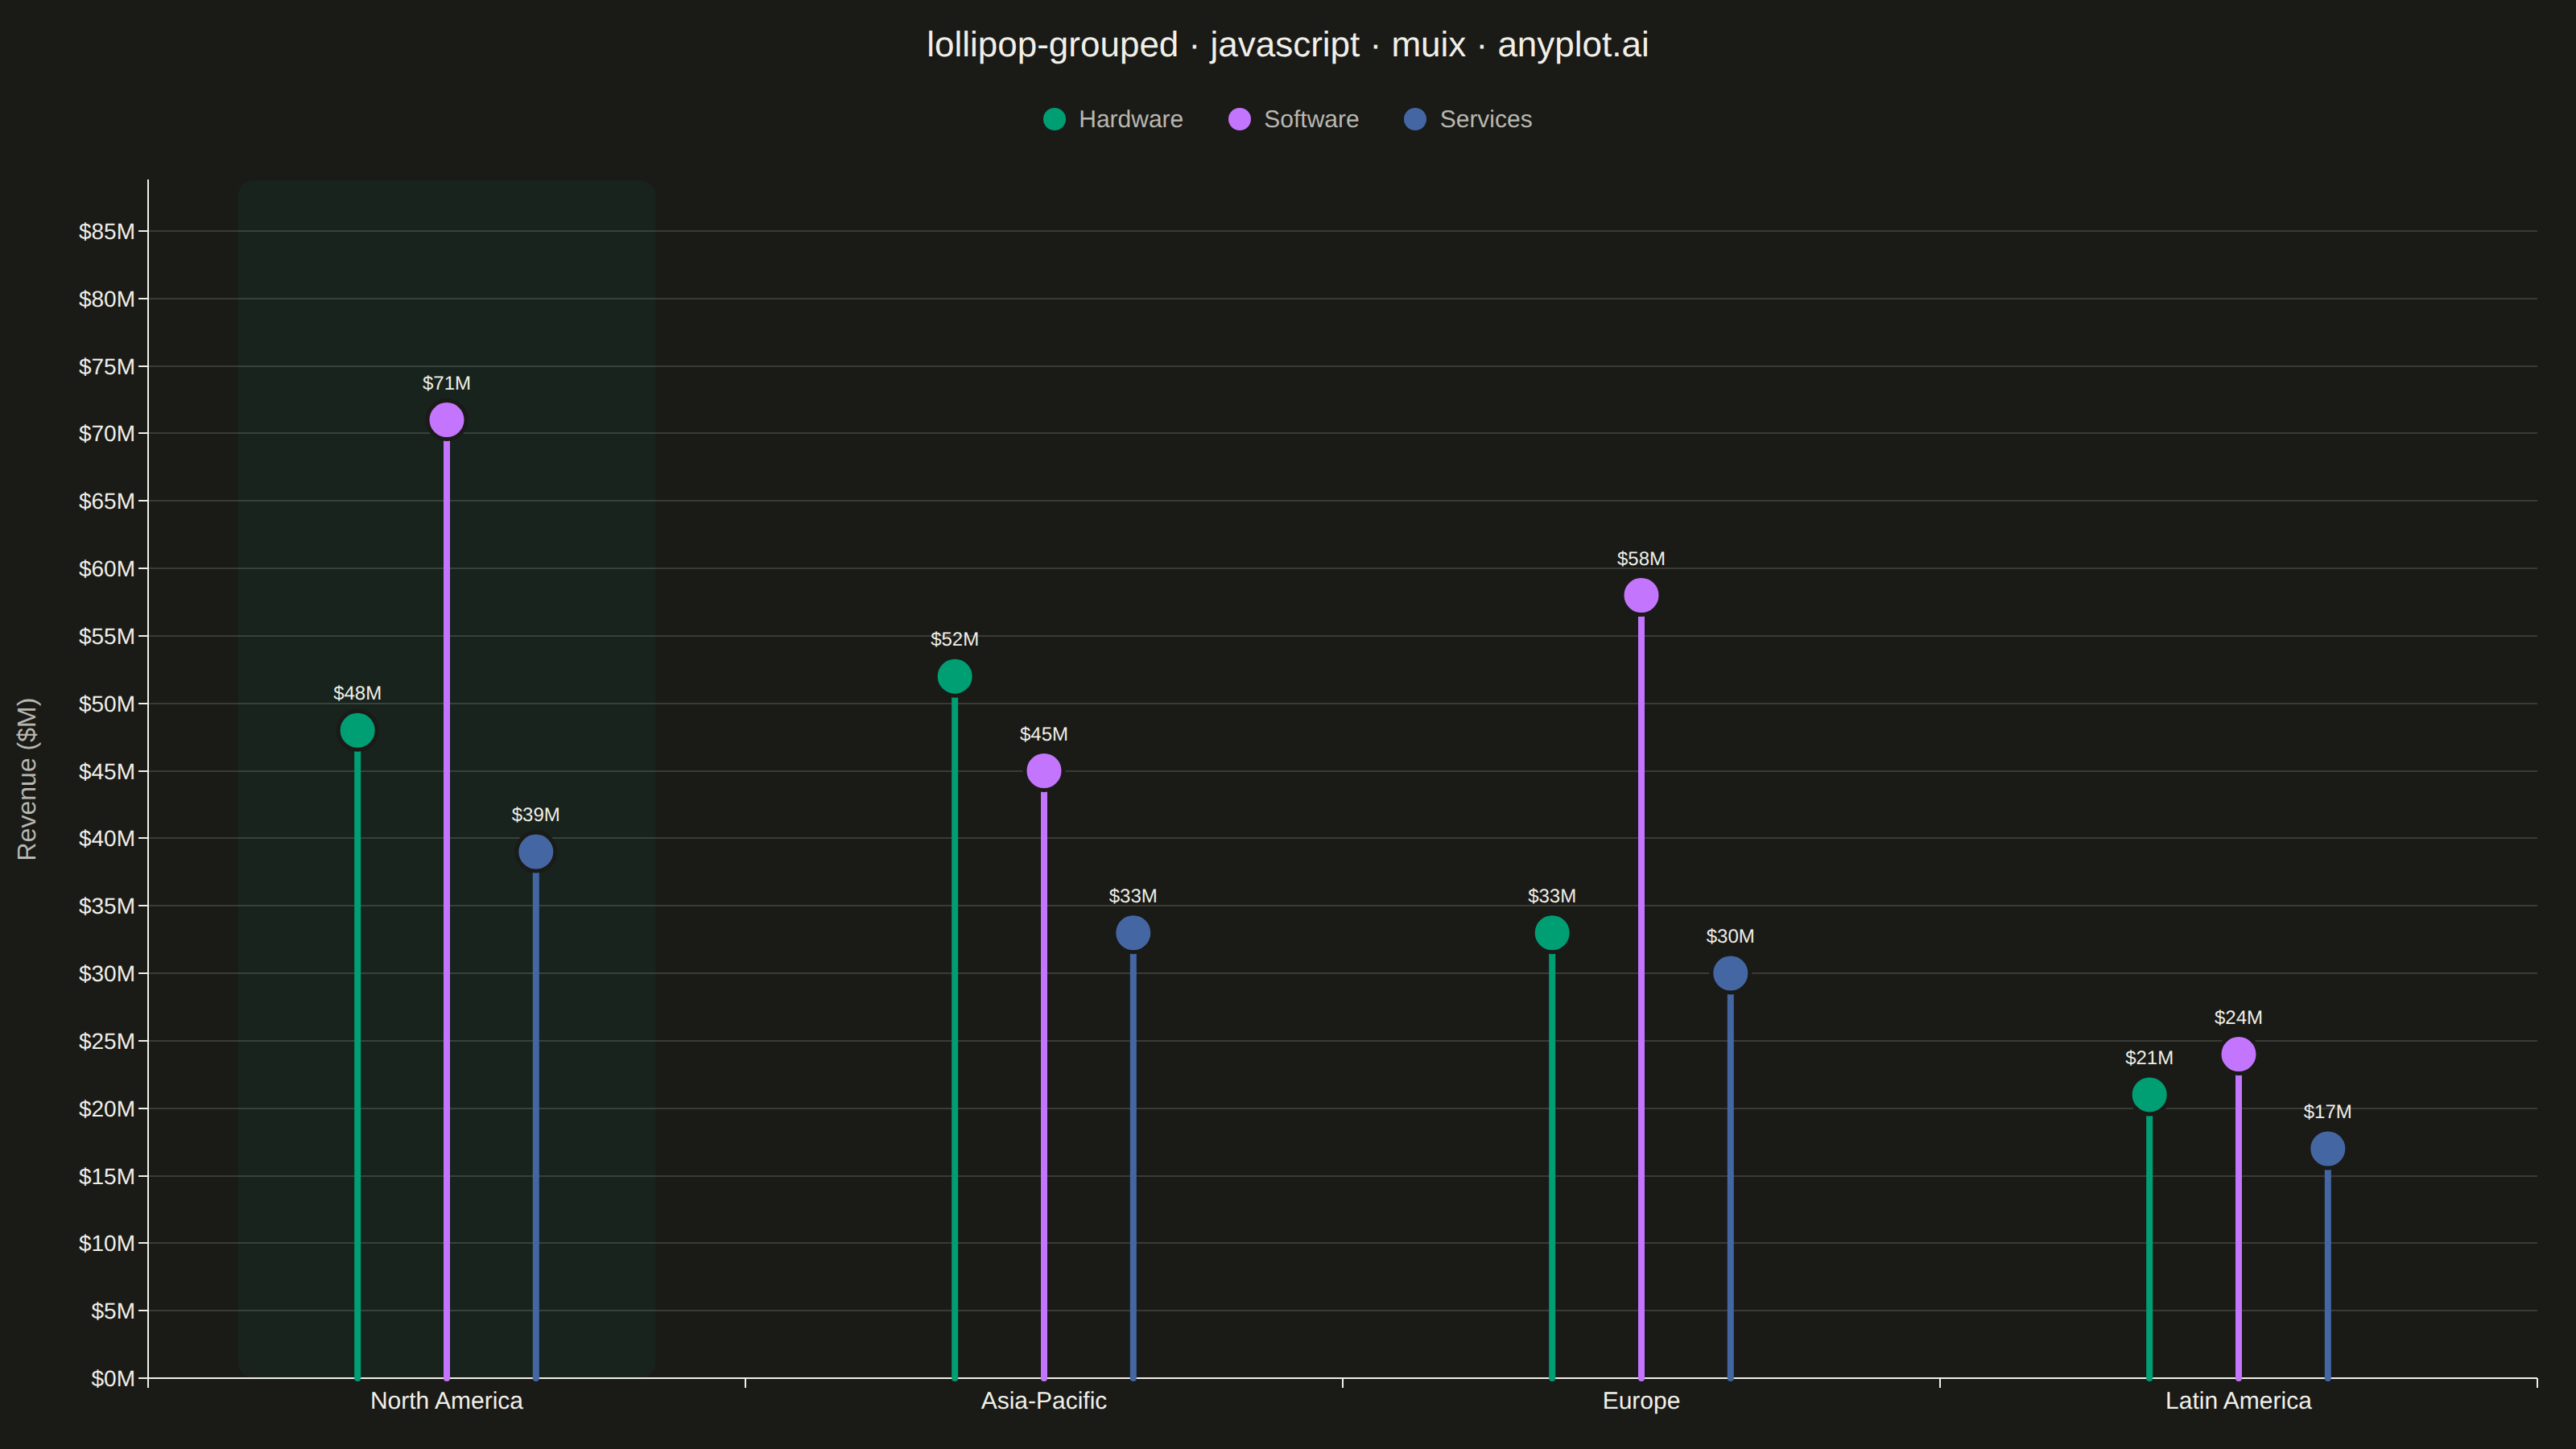
The same plot in 14 other libraries — JavaScript: Chart.js, D3.js, Apache ECharts, Highcharts; Python: Altair, Bokeh, lets-plot, Matplotlib, Plotly, plotnine, Pygal, Seaborn; R: ggplot2; Julia: Makie.jl. Compare all 15 side by side: Grouped Lollipop Chart in Python, R, Julia and JavaScript.
A grouped lollipop chart displays multiple series across categorical variables using thin stems and circular markers arranged in groups. Each category has multiple lollipops side by side, one for each series, enabling direct comparison of metrics across groups. It combines the clarity of dot plots with the organization of grouped bar charts while reducing visual clutter.
// anyplot.ai
// lollipop-grouped: Grouped Lollipop Chart
// Library: muix 7.29.1 | JavaScript 22.23.2
// Quality: 93/100 | Created: 2026-09-02
import { ChartContainer } from "@mui/x-charts/ChartContainer";
import { ChartsXAxis } from "@mui/x-charts/ChartsXAxis";
import { ChartsYAxis } from "@mui/x-charts/ChartsYAxis";
import { ChartsGrid } from "@mui/x-charts/ChartsGrid";
import { useXScale, useYScale, useDrawingArea } from "@mui/x-charts/hooks";

const t = window.ANYPLOT_TOKENS;

// --- Data (in-memory, deterministic) ---------------------------------------
// Quarterly revenue ($M) by product line, across regions — sorted by total
// revenue descending to reveal the regional ranking at a glance. Asia-Pacific
// (a hardware-manufacturing hub) leads with Hardware rather than Software,
// so the cross-group comparison isn't a flat repeat of the same ranking.
const regions = ["North America", "Asia-Pacific", "Europe", "Latin America"];
const productLines = ["Hardware", "Software", "Services"];
const revenueByRegion = [
  [48, 71, 39],
  [52, 45, 33],
  [33, 58, 30],
  [21, 24, 17],
];
const focalRegion = "North America";
const seriesColors = [t.palette[0], t.palette[1], t.palette[2]];
const maxRevenue = Math.max(...revenueByRegion.flat());

// --- Focal-region highlight: a subtle band behind the top-revenue region ---
function FocalHighlight() {
  const xScale = useXScale();
  const { top, height } = useDrawingArea();
  const x0 = xScale(focalRegion) ?? 0;
  return <rect x={x0} y={top} width={xScale.bandwidth()} height={height} fill={t.palette[0]} opacity={0.07} rx={10} />;
}

// --- Custom marks: thin stems + circular heads, grouped per category -------
// MUI X community has no built-in lollipop series, so the stems/markers are
// drawn as plain SVG using the ChartContainer's own band/linear scales — this
// guarantees the marks line up exactly with the shared axes.
function Lollipops() {
  const xScale = useXScale();
  const yScale = useYScale();
  const bandwidth = xScale.bandwidth();
  const groupPadding = bandwidth * 0.18;
  const slotWidth = (bandwidth - 2 * groupPadding) / productLines.length;
  const baselineY = yScale(0);

  return (
    <>
      {regions.map((region, ri) =>
        productLines.map((_, si) => {
          const value = revenueByRegion[ri][si];
          const cx = (xScale(region) ?? 0) + groupPadding + slotWidth * (si + 0.5);
          const cy = yScale(value);
          return (
            <g key={`${region}-${si}`}>
              <line
                x1={cx}
                y1={baselineY}
                x2={cx}
                y2={cy}
                stroke={seriesColors[si]}
                strokeWidth={4}
                strokeLinecap="round"
              />
              <circle cx={cx} cy={cy} r={12} fill={seriesColors[si]} stroke={t.pageBg} strokeWidth={2.5} />
              <text x={cx} y={cy - 19} textAnchor="middle" fontSize={12} fill={t.ink}>
                {`$${value}M`}
              </text>
            </g>
          );
        }),
      )}
    </>
  );
}

// --- Y-axis title (manual — ChartsYAxis's built-in `label` offset formula
// assumes narrow tick text and overlaps wide "$NNM" tick labels here) --------
function YAxisTitle({ text }) {
  const { top, height } = useDrawingArea();
  const cx = 22;
  const cy = top + height / 2;
  return (
    <text x={cx} y={cy} transform={`rotate(-90, ${cx}, ${cy})`} textAnchor="middle" fontSize={16} fill={t.inkSoft}>
      {text}
    </text>
  );
}

// --- Legend (manual — custom marks aren't registered as chart series) ------
function Legend() {
  return (
    <div style={{ display: "flex", justifyContent: "center", gap: 28, height: 36, alignItems: "center" }}>
      {productLines.map((name, i) => (
        <div key={name} style={{ display: "flex", alignItems: "center", gap: 8 }}>
          <span
            style={{
              width: 14,
              height: 14,
              borderRadius: "50%",
              background: seriesColors[i],
              display: "inline-block",
            }}
          />
          <span style={{ fontSize: 15, color: t.inkSoft }}>{name}</span>
        </div>
      ))}
    </div>
  );
}

// --- Chart (default-exported component — the harness mounts it) -------------
export default function Chart() {
  const { width, height } = window.ANYPLOT_SIZE;
  const titleHeight = 56;
  const legendHeight = 36;
  const chartHeight = height - titleHeight - legendHeight;

  return (
    <div style={{ width, height, display: "flex", flexDirection: "column" }}>
      <div
        style={{
          height: titleHeight,
          display: "flex",
          alignItems: "center",
          justifyContent: "center",
          fontSize: 22,
          fontWeight: 500,
          color: t.ink,
        }}
      >
        lollipop-grouped · javascript · muix · anyplot.ai
      </div>
      <Legend />
      <ChartContainer
        width={width}
        height={chartHeight}
        series={[]}
        skipAnimation
        margin={{ top: 20, bottom: 44, left: 92, right: 24 }}
        xAxis={[{ id: "region-axis", scaleType: "band", data: regions, categoryGapRatio: 0.3 }]}
        yAxis={[
          {
            id: "revenue-axis",
            scaleType: "linear",
            min: 0,
            max: maxRevenue * 1.25,
            valueFormatter: (v) => `$${v}M`,
          },
        ]}
      >
        <FocalHighlight />
        <ChartsGrid horizontal />
        <ChartsXAxis axisId="region-axis" tickLabelStyle={{ fontSize: 15 }} />
        <ChartsYAxis axisId="revenue-axis" tickLabelStyle={{ fontSize: 14 }} />
        <YAxisTitle text="Revenue ($M)" />
        <Lollipops />
      </ChartContainer>
    </div>
  );
}
Runnable source as JSON, for any HTTP client: https://api.anyplot.ai/specs/lollipop-grouped/muix/code. Any spec id and library id listed in llms-full.txt fit the same URL shape; every URL below is complete and callable.
{
  "spec_id": "lollipop-grouped",
  "language": "javascript",
  "library": "muix",
  "page": "https://anyplot.ai/lollipop-grouped/javascript/muix",
  "hub": "https://anyplot.ai/lollipop-grouped",
  "code_json": "https://api.anyplot.ai/specs/lollipop-grouped/muix/code",
  "spec_json": "https://api.anyplot.ai/specs/lollipop-grouped",
  "render_light_png": "https://storage.googleapis.com/anyplot-images/plots/lollipop-grouped/javascript/muix/plot-light.png",
  "render_dark_png": "https://storage.googleapis.com/anyplot-images/plots/lollipop-grouped/javascript/muix/plot-dark.png",
  "interactive_light_html": "https://storage.googleapis.com/anyplot-images/plots/lollipop-grouped/javascript/muix/plot-light.html",
  "interactive_dark_html": "https://storage.googleapis.com/anyplot-images/plots/lollipop-grouped/javascript/muix/plot-dark.html",
  "quality_score": 93.0,
  "license": "MIT",
  "guide": "https://anyplot.ai/llms.txt"
}
Part of Grouped Lollipop Chart on anyplot.ai.