The same plot in 14 other libraries — JavaScript: Chart.js, D3.js, Highcharts, MUI X Charts; Python: Altair, Bokeh, lets-plot, Matplotlib, Plotly, plotnine, Pygal, Seaborn; R: ggplot2; Julia: Makie.jl. Compare all 15 side by side: Grouped Lollipop Chart in Python, R, Julia and JavaScript.
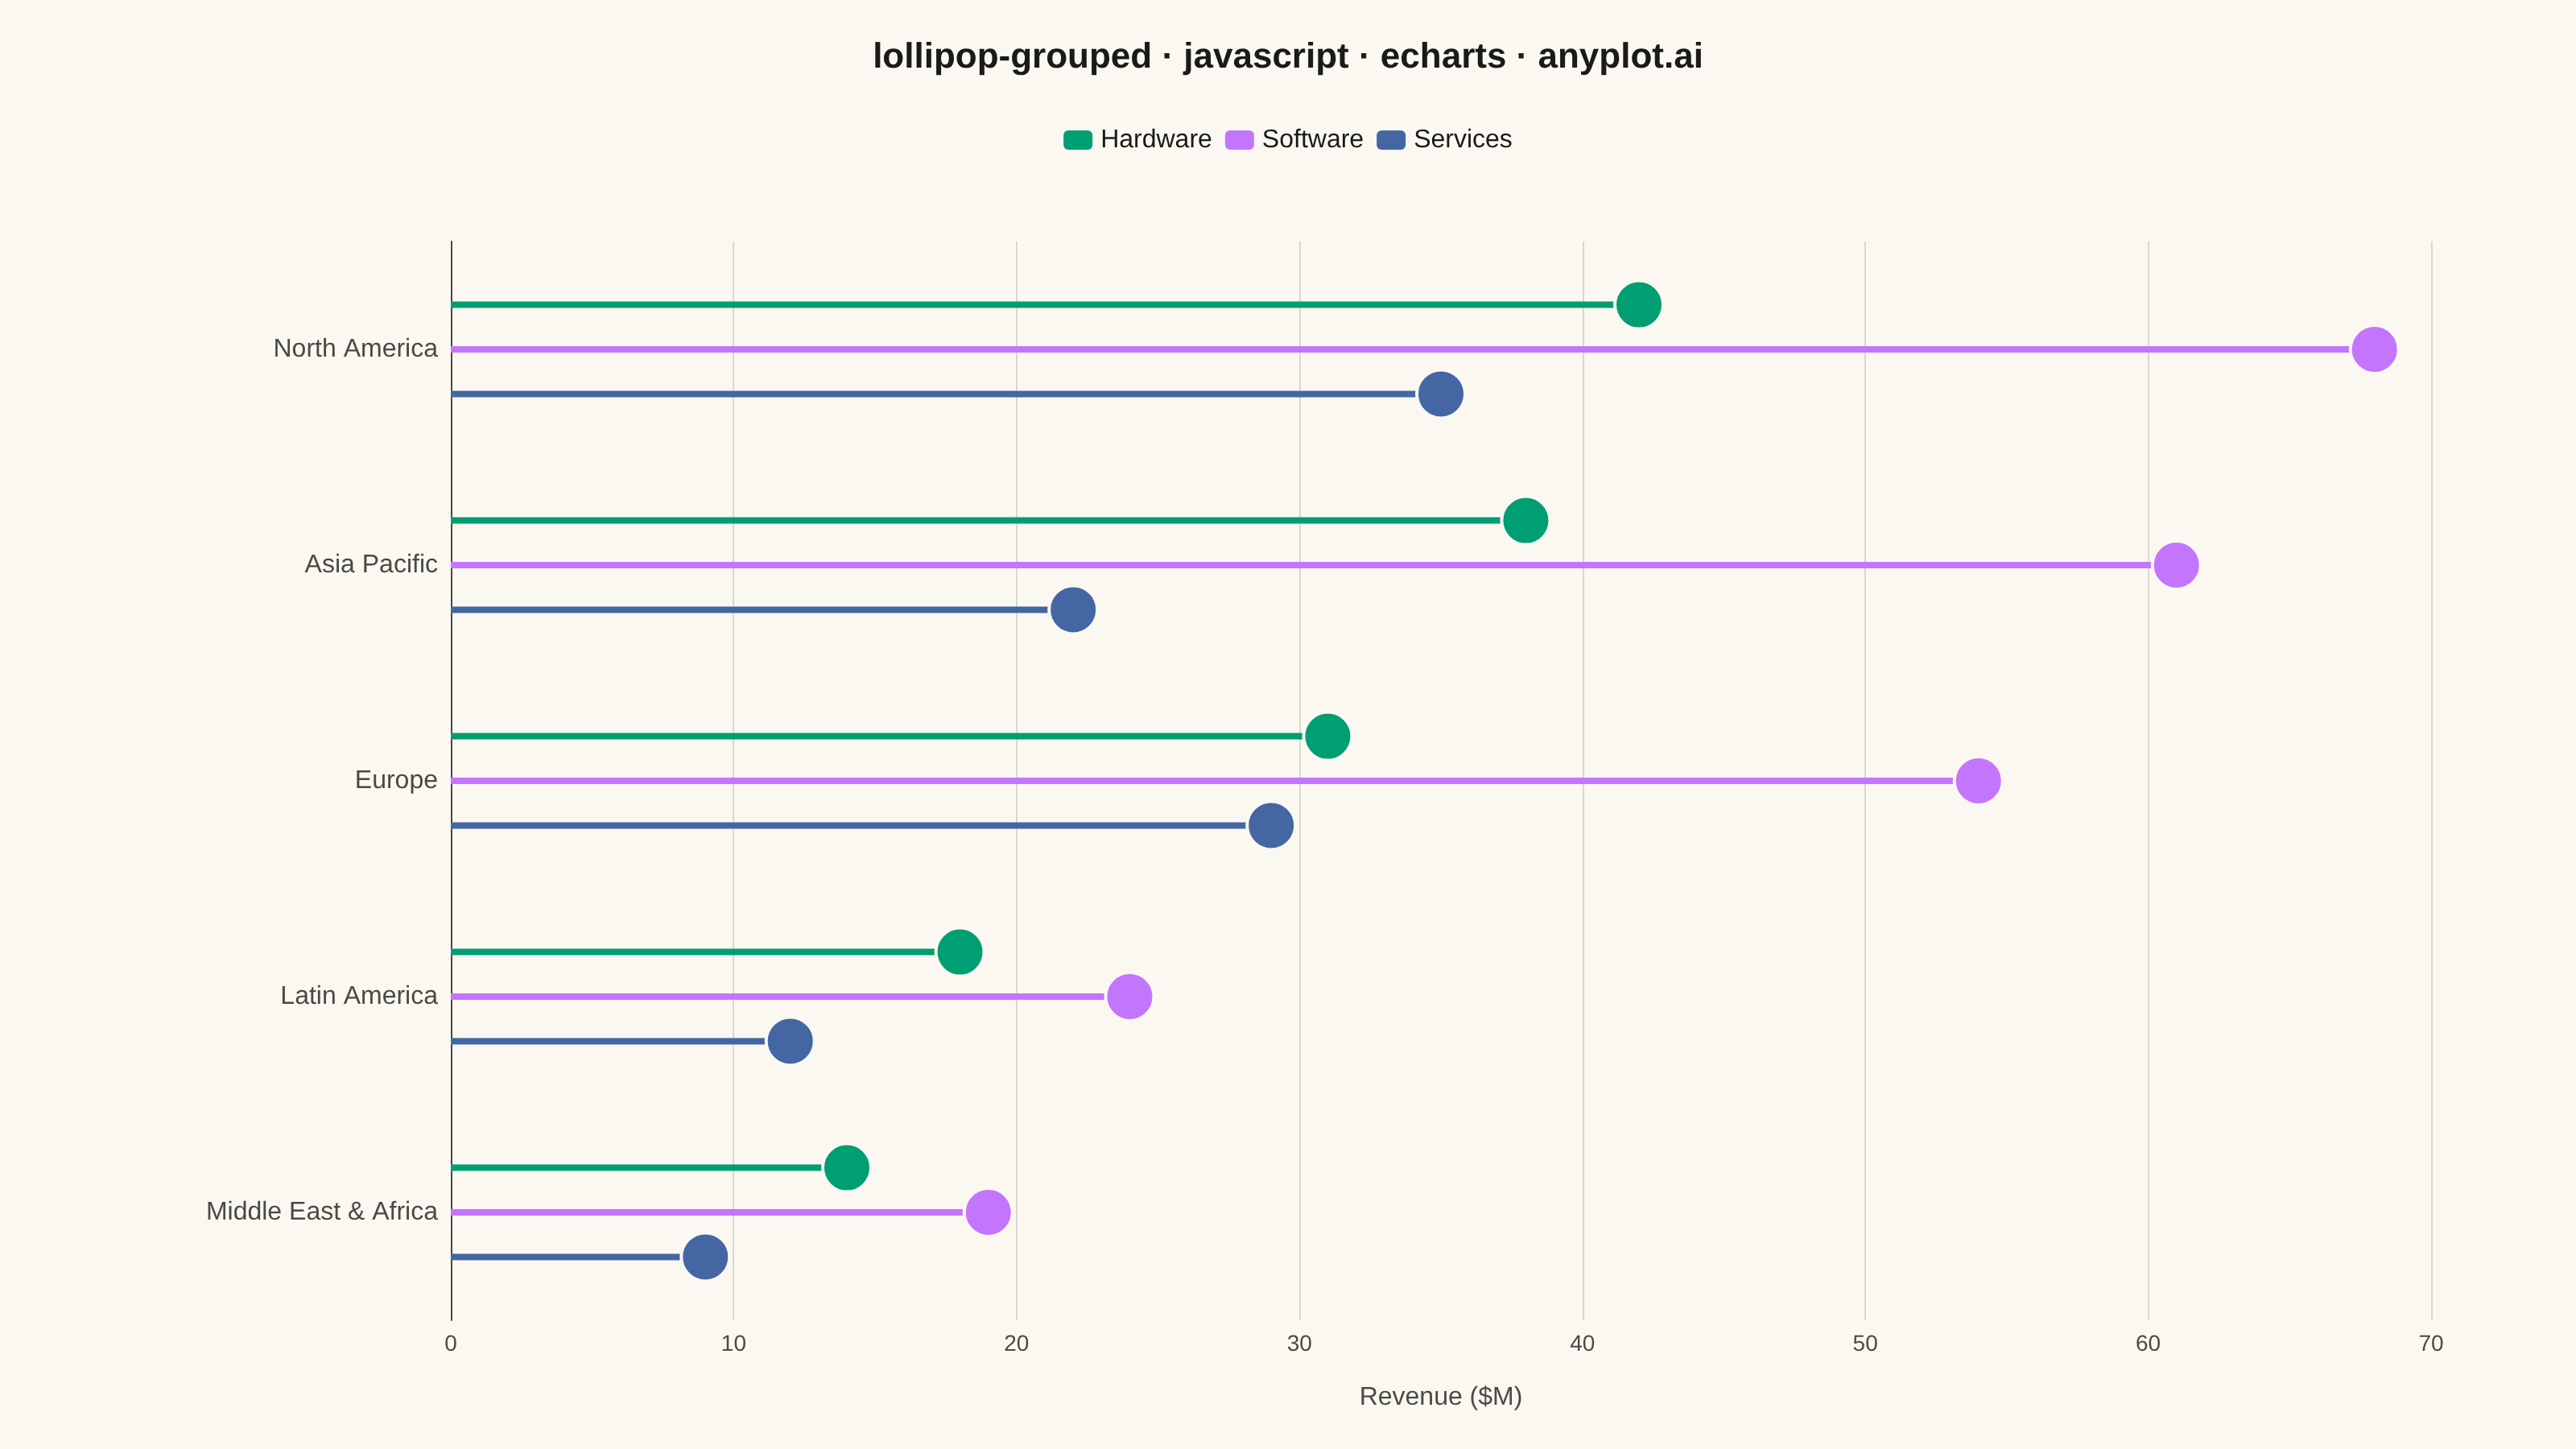
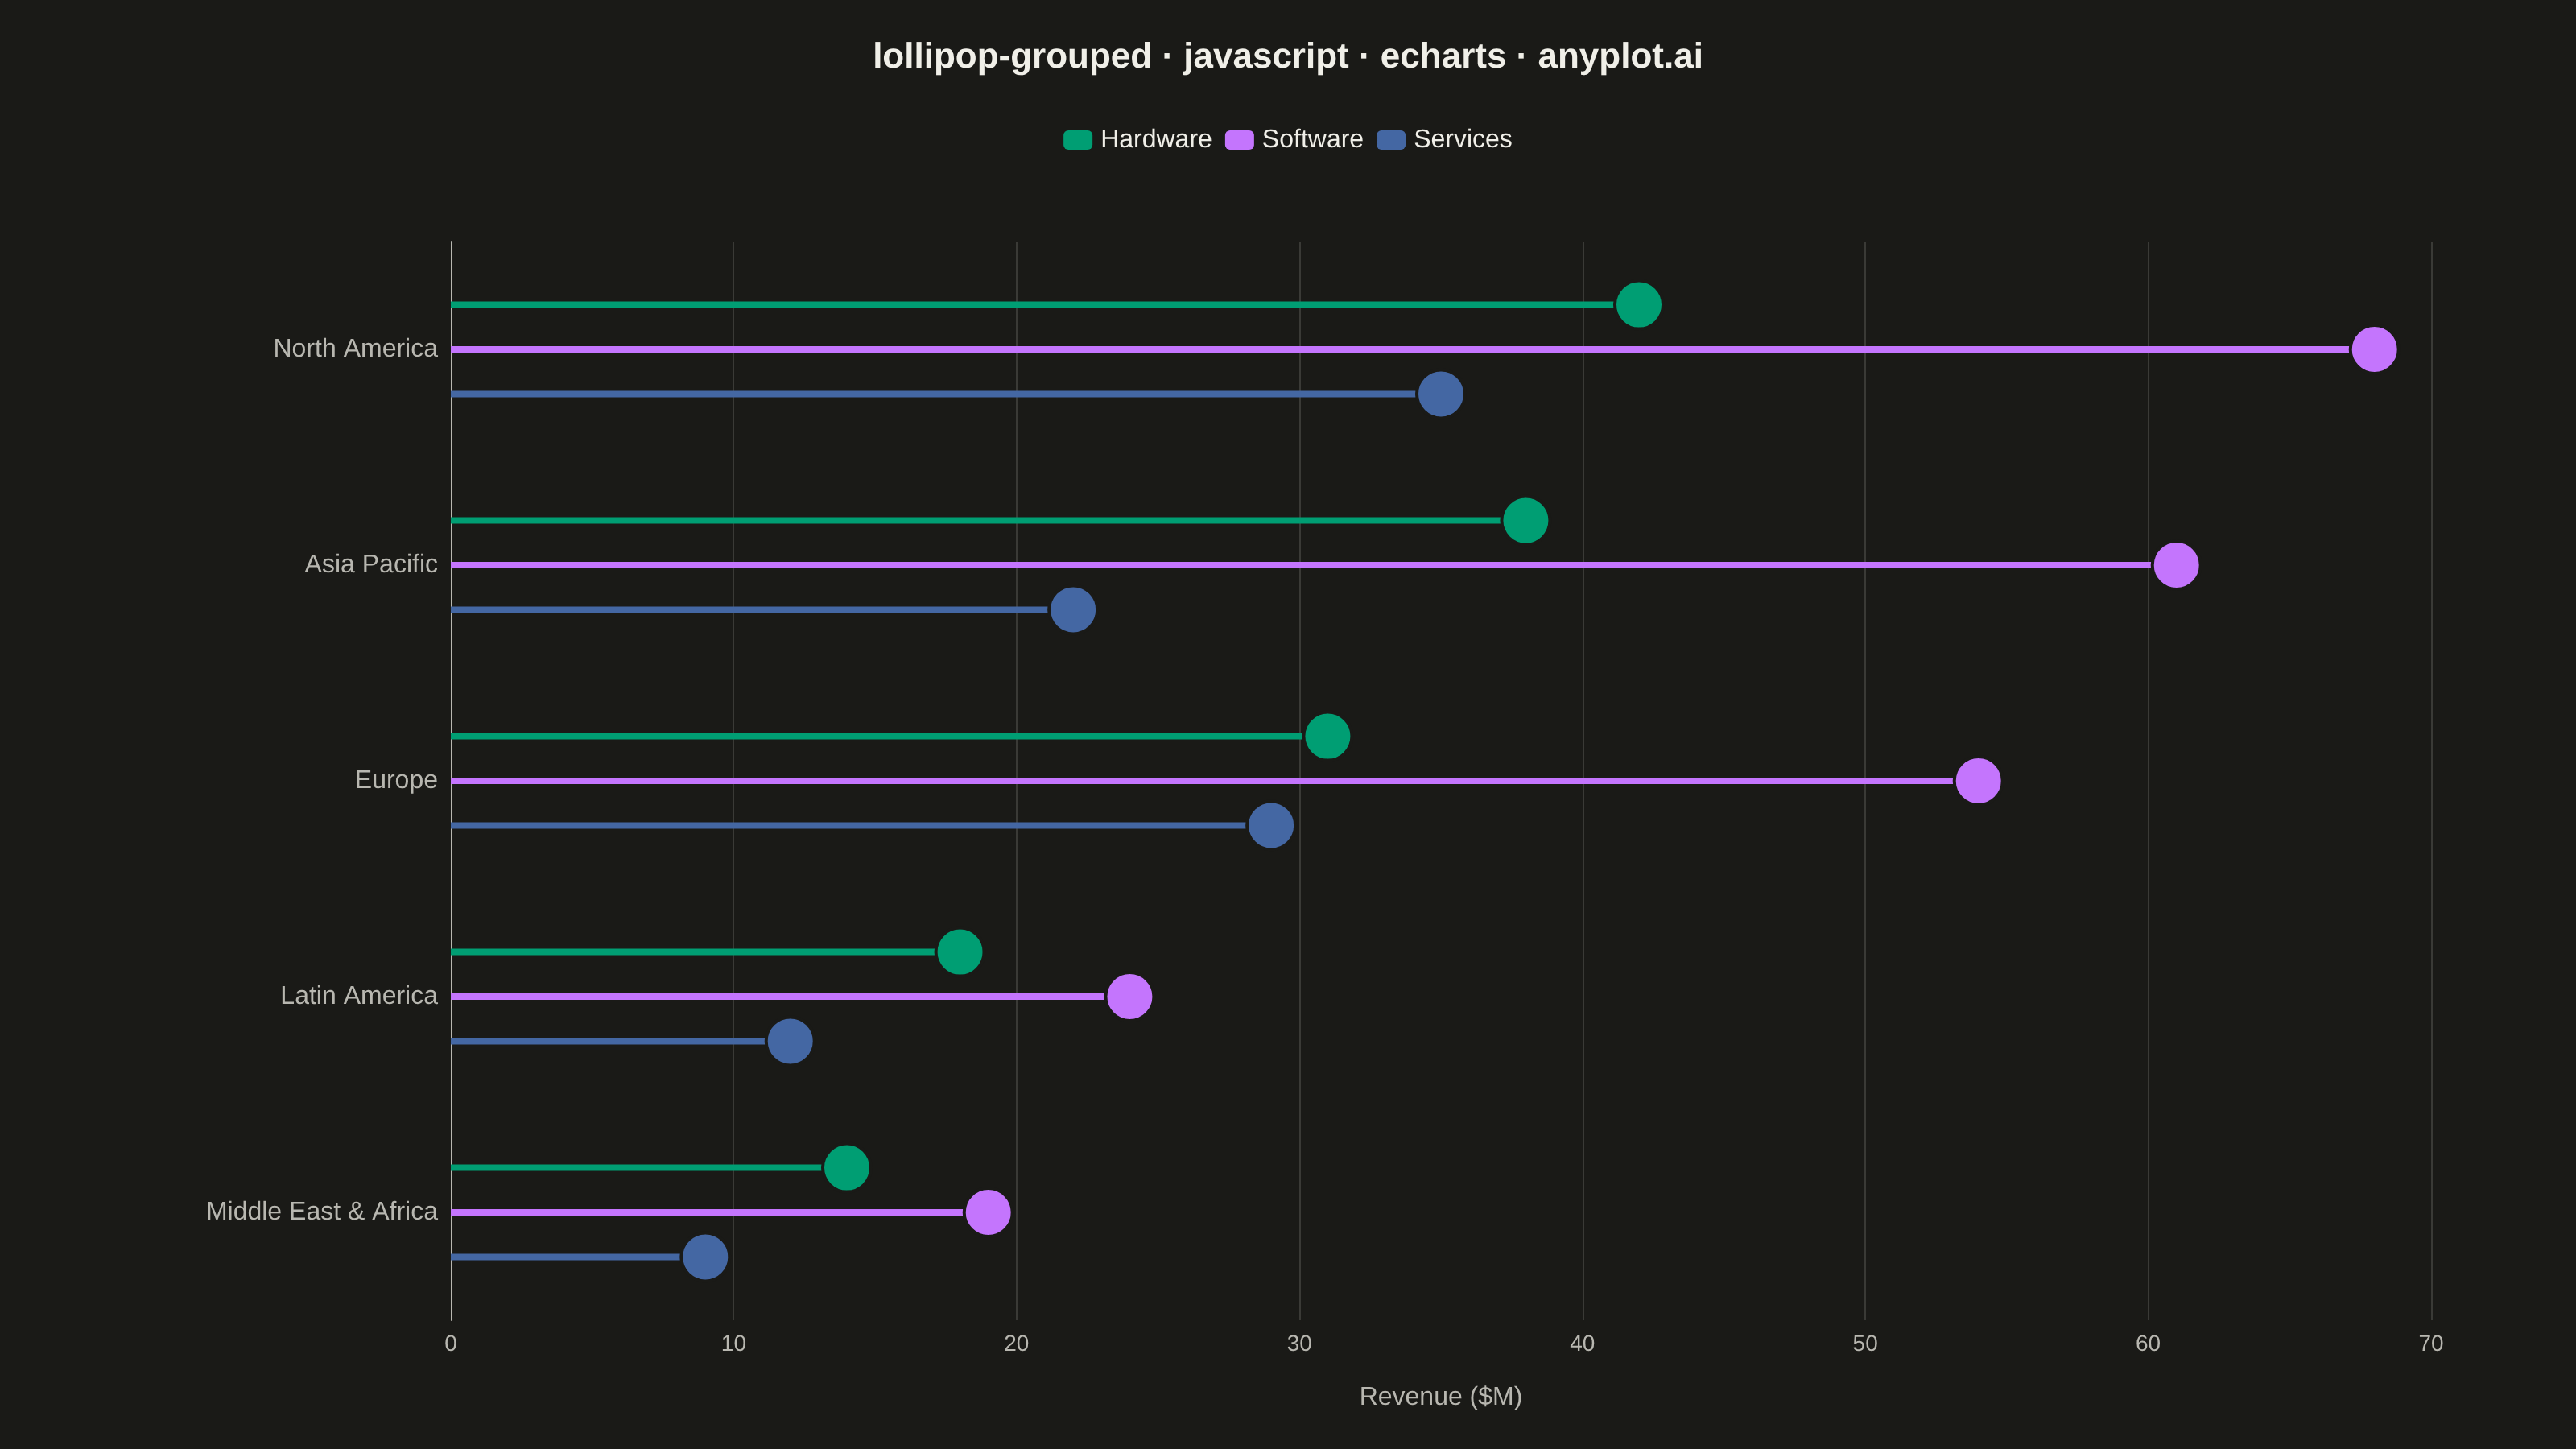
A grouped lollipop chart displays multiple series across categorical variables using thin stems and circular markers arranged in groups. Each category has multiple lollipops side by side, one for each series, enabling direct comparison of metrics across groups. It combines the clarity of dot plots with the organization of grouped bar charts while reducing visual clutter.
// anyplot.ai
// lollipop-grouped: Grouped Lollipop Chart
// Library: echarts 6.1.0 | JavaScript 22.23.2
// Quality: 91/100 | Created: 2026-09-02

const t = window.ANYPLOT_TOKENS;

// --- Data (in-memory, deterministic) ----------------------------------------
// Revenue by product line across regions, sorted by total revenue descending.
const seriesNames = ["Hardware", "Software", "Services"];
const regions = [
  { name: "North America", values: [42, 68, 35] },
  { name: "Asia Pacific", values: [38, 61, 22] },
  { name: "Europe", values: [31, 54, 29] },
  { name: "Latin America", values: [18, 24, 12] },
  { name: "Middle East & Africa", values: [14, 19, 9] },
];
const categories = regions.map((r) => r.name);

// --- Custom lollipop renderer -----------------------------------------------
// ECharts has no built-in lollipop series; a "custom" series drawing a thin
// stem + circular head per data point is the native way to build one. Each
// series gets a small horizontal offset within its category band so the
// lollipops for a category sit side by side, mirroring grouped-bar layout.
const GROUP_RATIO = 0.62;
const DOT_RADIUS = 15;
const STEM_WIDTH = 4;

function makeRenderItem(seriesIndex) {
  return function (params, api) {
    const categoryIndex = api.value(0);
    const value = api.value(1);
    const start = api.coord([0, categoryIndex]);
    const end = api.coord([value, categoryIndex]);
    const bandHeight = api.size([0, 1])[1];
    const step = (bandHeight * GROUP_RATIO) / seriesNames.length;
    const offset = (seriesIndex - (seriesNames.length - 1) / 2) * step;
    start[1] += offset;
    end[1] += offset;
    const color = t.palette[seriesIndex];
    return {
      type: "group",
      children: [
        {
          type: "line",
          shape: { x1: start[0], y1: start[1], x2: end[0], y2: end[1] },
          style: { stroke: color, lineWidth: STEM_WIDTH },
        },
        {
          type: "circle",
          shape: { cx: end[0], cy: end[1], r: DOT_RADIUS },
          style: { fill: color, stroke: t.pageBg, lineWidth: 2 },
        },
      ],
    };
  };
}

const series = seriesNames.map((name, seriesIndex) => ({
  name,
  type: "custom",
  renderItem: makeRenderItem(seriesIndex),
  encode: { x: 1, y: 0 },
  data: categories.map((_, categoryIndex) => [
    categoryIndex,
    regions[categoryIndex].values[seriesIndex],
  ]),
  z: 2,
}));

// --- Init --------------------------------------------------------------------
const chart = echarts.init(document.getElementById("container"));

// --- Option -------------------------------------------------------------------
chart.setOption({
  animation: false,
  color: t.palette,
  backgroundColor: "transparent",
  title: {
    text: "lollipop-grouped · javascript · echarts · anyplot.ai",
    left: "center",
    top: 20,
    textStyle: { color: t.ink, fontSize: 22 },
  },
  legend: {
    data: seriesNames,
    top: 74,
    left: "center",
    itemWidth: 18,
    itemHeight: 12,
    textStyle: { color: t.ink, fontSize: 16 },
  },
  tooltip: {
    trigger: "item",
    backgroundColor: t.elevatedBg,
    borderColor: t.grid,
    textStyle: { color: t.ink },
    formatter: (p) =>
      `${p.seriesName} — ${categories[p.value[0]]}<br/>$${p.value[1]}M`,
  },
  grid: { left: 280, right: 90, top: 150, bottom: 80 },
  xAxis: {
    type: "value",
    name: "Revenue ($M)",
    nameLocation: "center",
    nameGap: 40,
    nameTextStyle: { color: t.inkSoft, fontSize: 16 },
    axisLabel: { color: t.inkSoft, fontSize: 14 },
    axisLine: { lineStyle: { color: t.inkSoft } },
    splitLine: { lineStyle: { color: t.grid } },
  },
  yAxis: {
    type: "category",
    data: categories,
    inverse: true,
    axisLabel: { color: t.inkSoft, fontSize: 16 },
    axisLine: { lineStyle: { color: t.inkSoft } },
    axisTick: { show: false },
    splitLine: { show: false },
  },
  series,
});
Runnable source as JSON, for any HTTP client: https://api.anyplot.ai/specs/lollipop-grouped/echarts/code. Any spec id and library id listed in llms-full.txt fit the same URL shape; every URL below is complete and callable.
{
  "spec_id": "lollipop-grouped",
  "language": "javascript",
  "library": "echarts",
  "page": "https://anyplot.ai/lollipop-grouped/javascript/echarts",
  "hub": "https://anyplot.ai/lollipop-grouped",
  "code_json": "https://api.anyplot.ai/specs/lollipop-grouped/echarts/code",
  "spec_json": "https://api.anyplot.ai/specs/lollipop-grouped",
  "render_light_png": "https://storage.googleapis.com/anyplot-images/plots/lollipop-grouped/javascript/echarts/plot-light.png",
  "render_dark_png": "https://storage.googleapis.com/anyplot-images/plots/lollipop-grouped/javascript/echarts/plot-dark.png",
  "interactive_light_html": "https://storage.googleapis.com/anyplot-images/plots/lollipop-grouped/javascript/echarts/plot-light.html",
  "interactive_dark_html": "https://storage.googleapis.com/anyplot-images/plots/lollipop-grouped/javascript/echarts/plot-dark.html",
  "quality_score": 91.0,
  "license": "MIT",
  "guide": "https://anyplot.ai/llms.txt"
}
Part of Grouped Lollipop Chart on anyplot.ai.