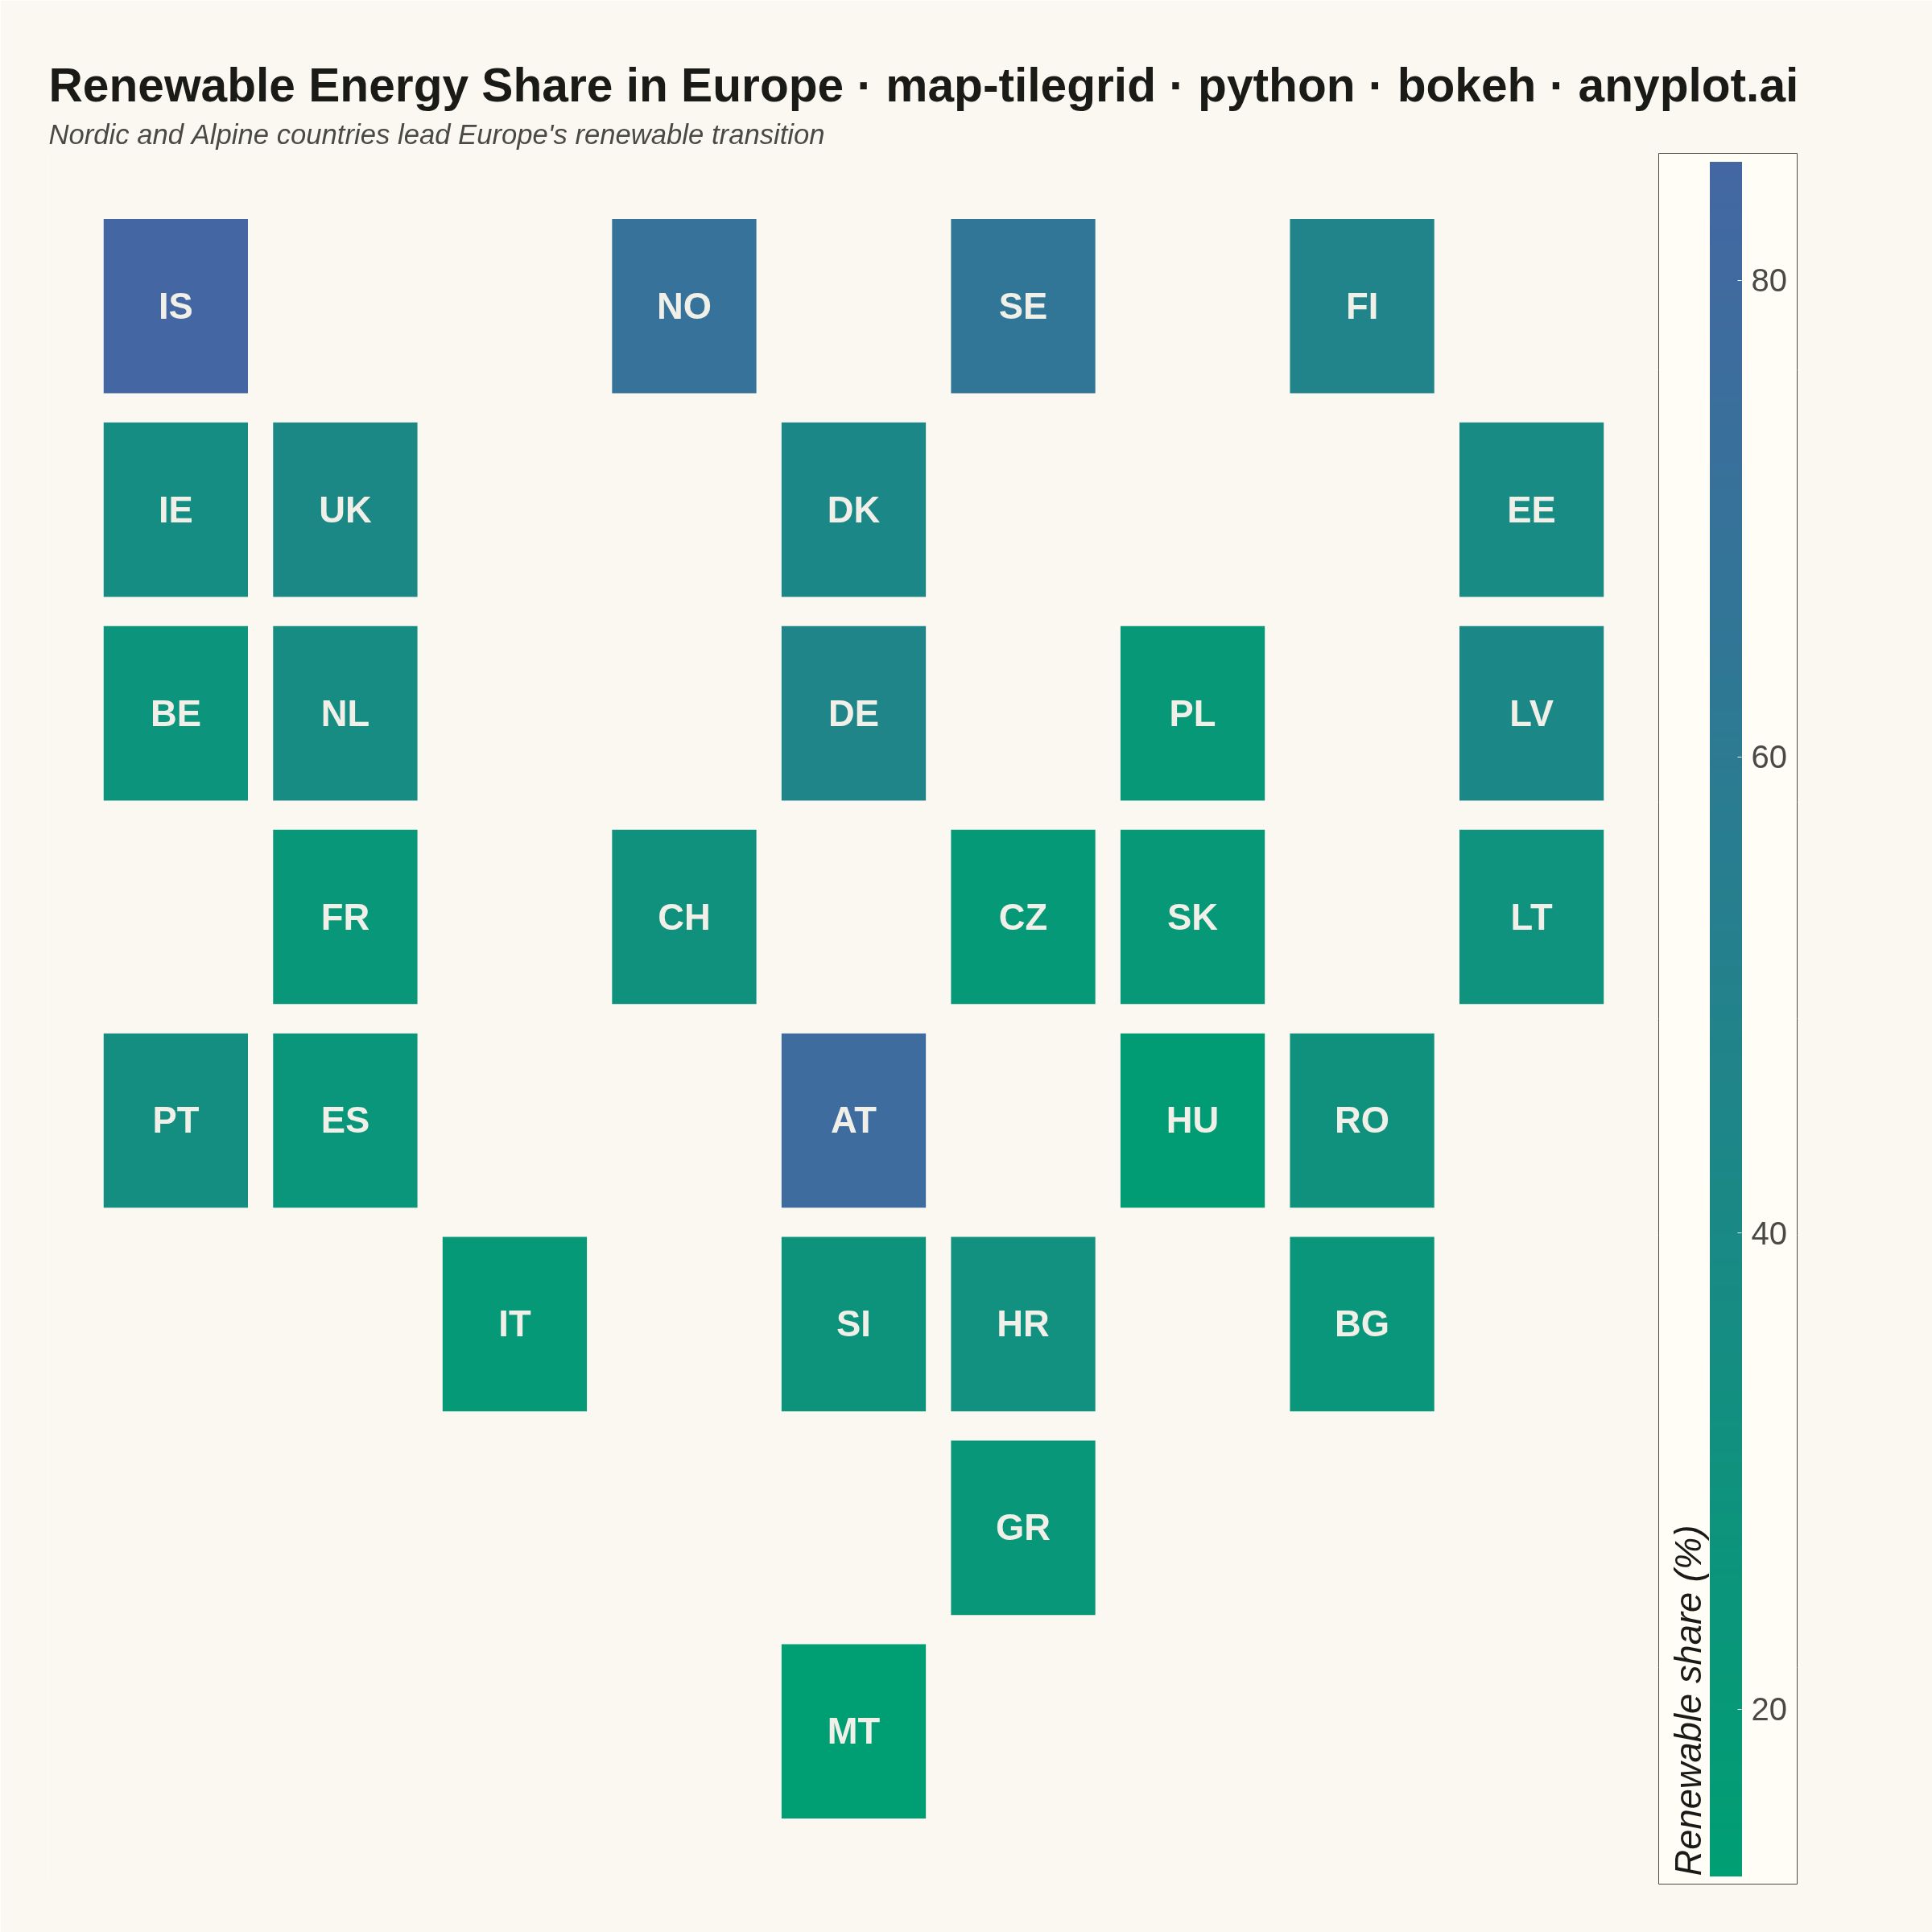
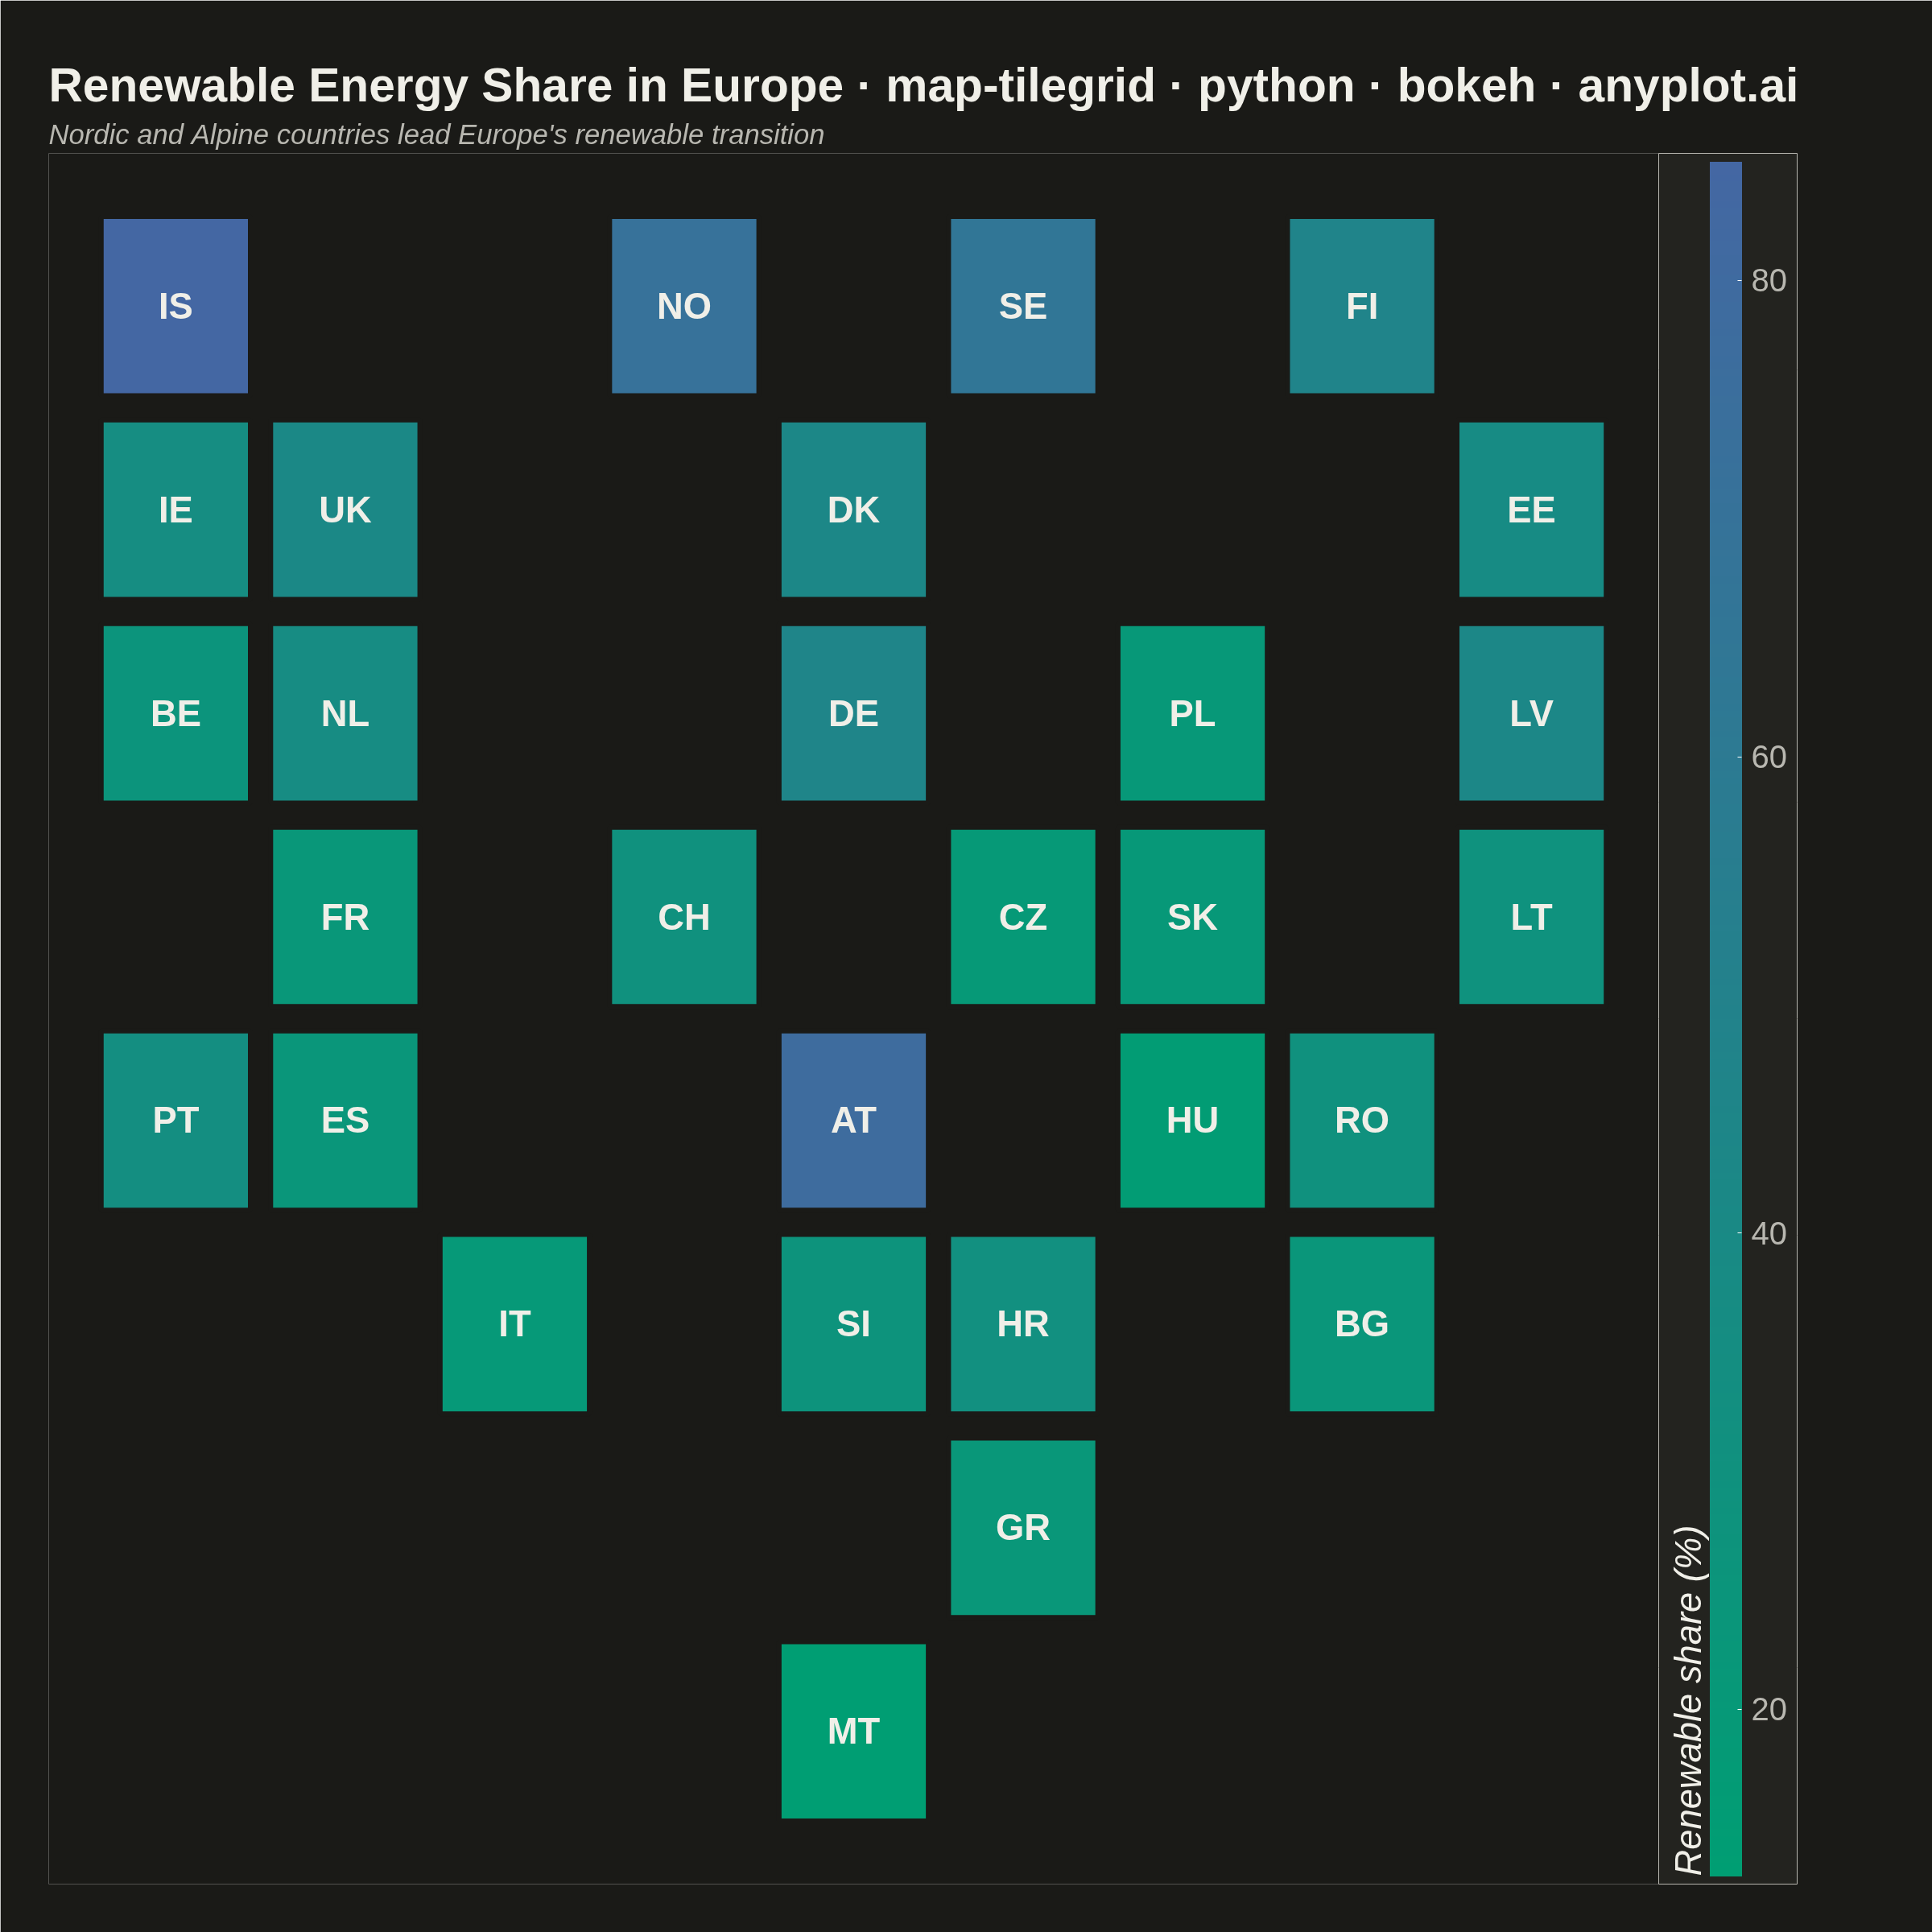
Source code in 15 libraries — Python: Altair, Bokeh, lets-plot, Matplotlib, Plotly, plotnine, Pygal, Seaborn; R: ggplot2; Julia: Makie.jl; JavaScript: Chart.js, D3.js, Apache ECharts, Highcharts, MUI X Charts.
A tile grid map represents geographic regions (states, countries, provinces) as equally-sized tiles — squares or hexagons — arranged to approximate their real-world geographic positions. Unlike choropleth maps where large-area regions dominate visually, every region receives identical visual weight, making tile grid maps ideal for per-capita or per-region comparisons where the statistic matters more than physical area. Tiles are colored by a data variable and labeled with region abbreviations for identification.
Preview render from the Bokeh implementation.