The same plot in 14 other libraries — JavaScript: Chart.js, D3.js, Apache ECharts, MUI X Charts; Python: Altair, Bokeh, lets-plot, Matplotlib, Plotly, plotnine, Pygal, Seaborn; R: ggplot2; Julia: Makie.jl. Compare all 15 side by side: Tile Grid Map for Equal-Area Geographic Comparison in Python, R, Julia and JavaScript.
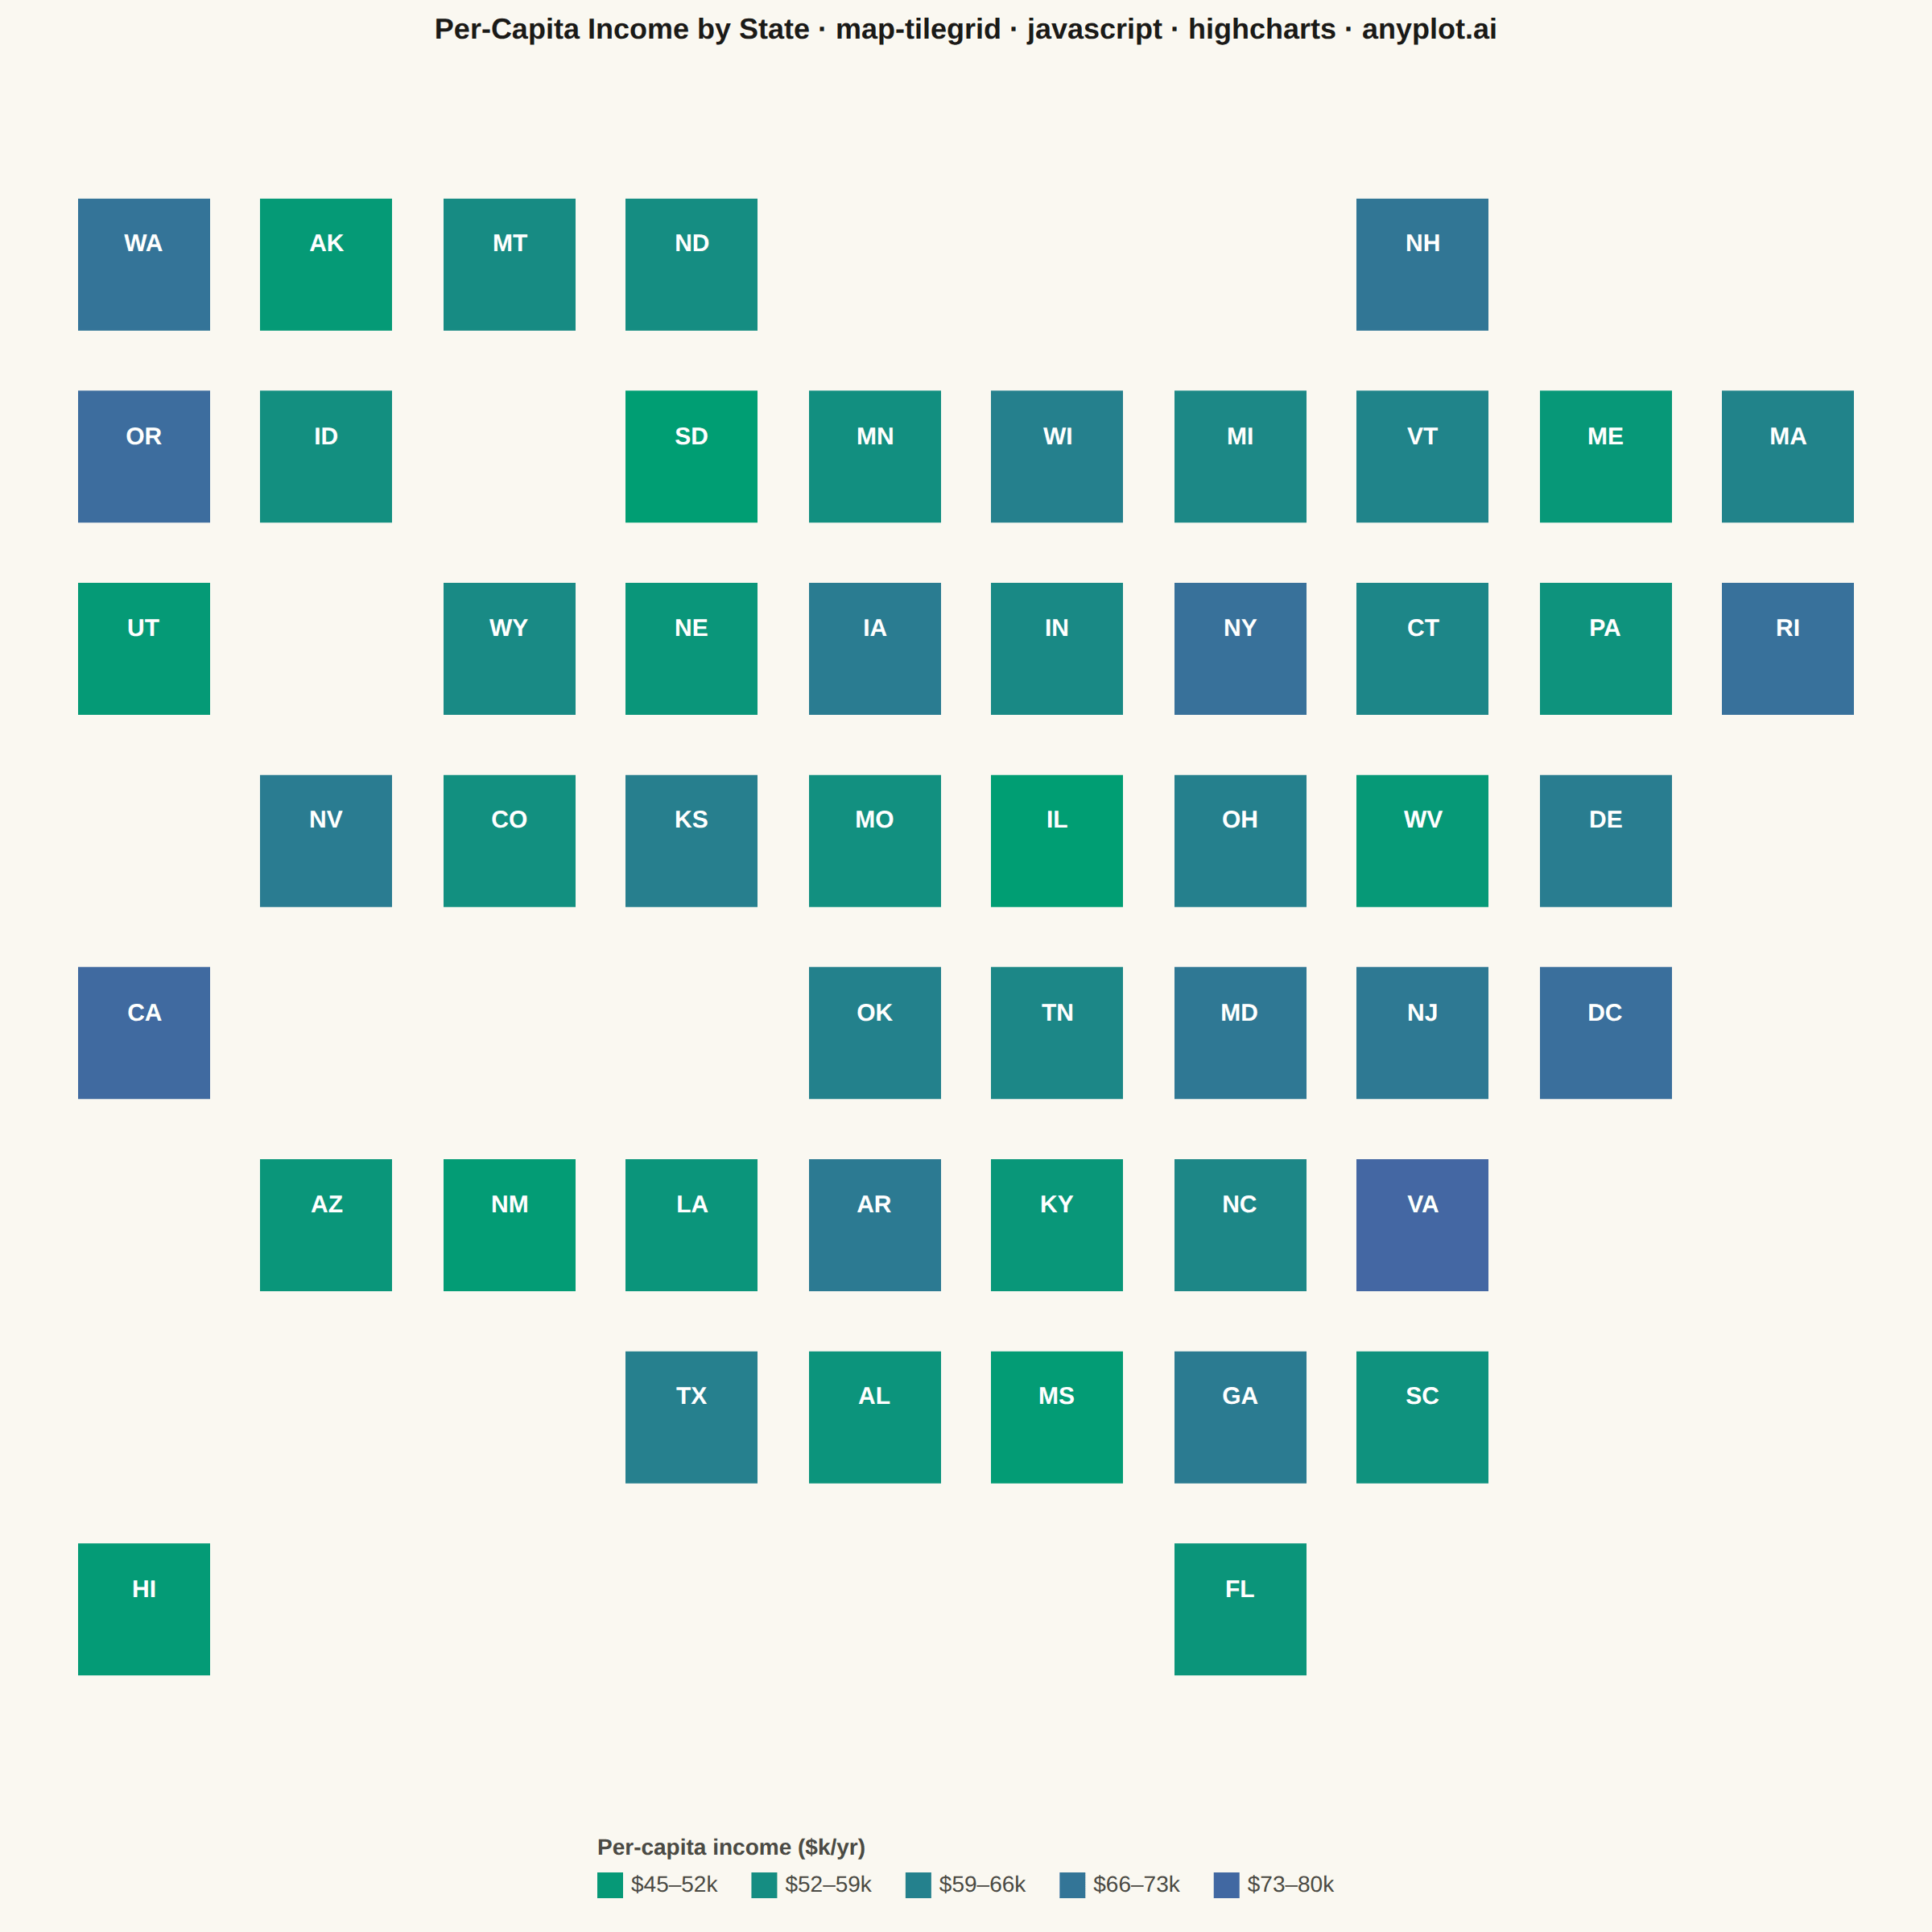
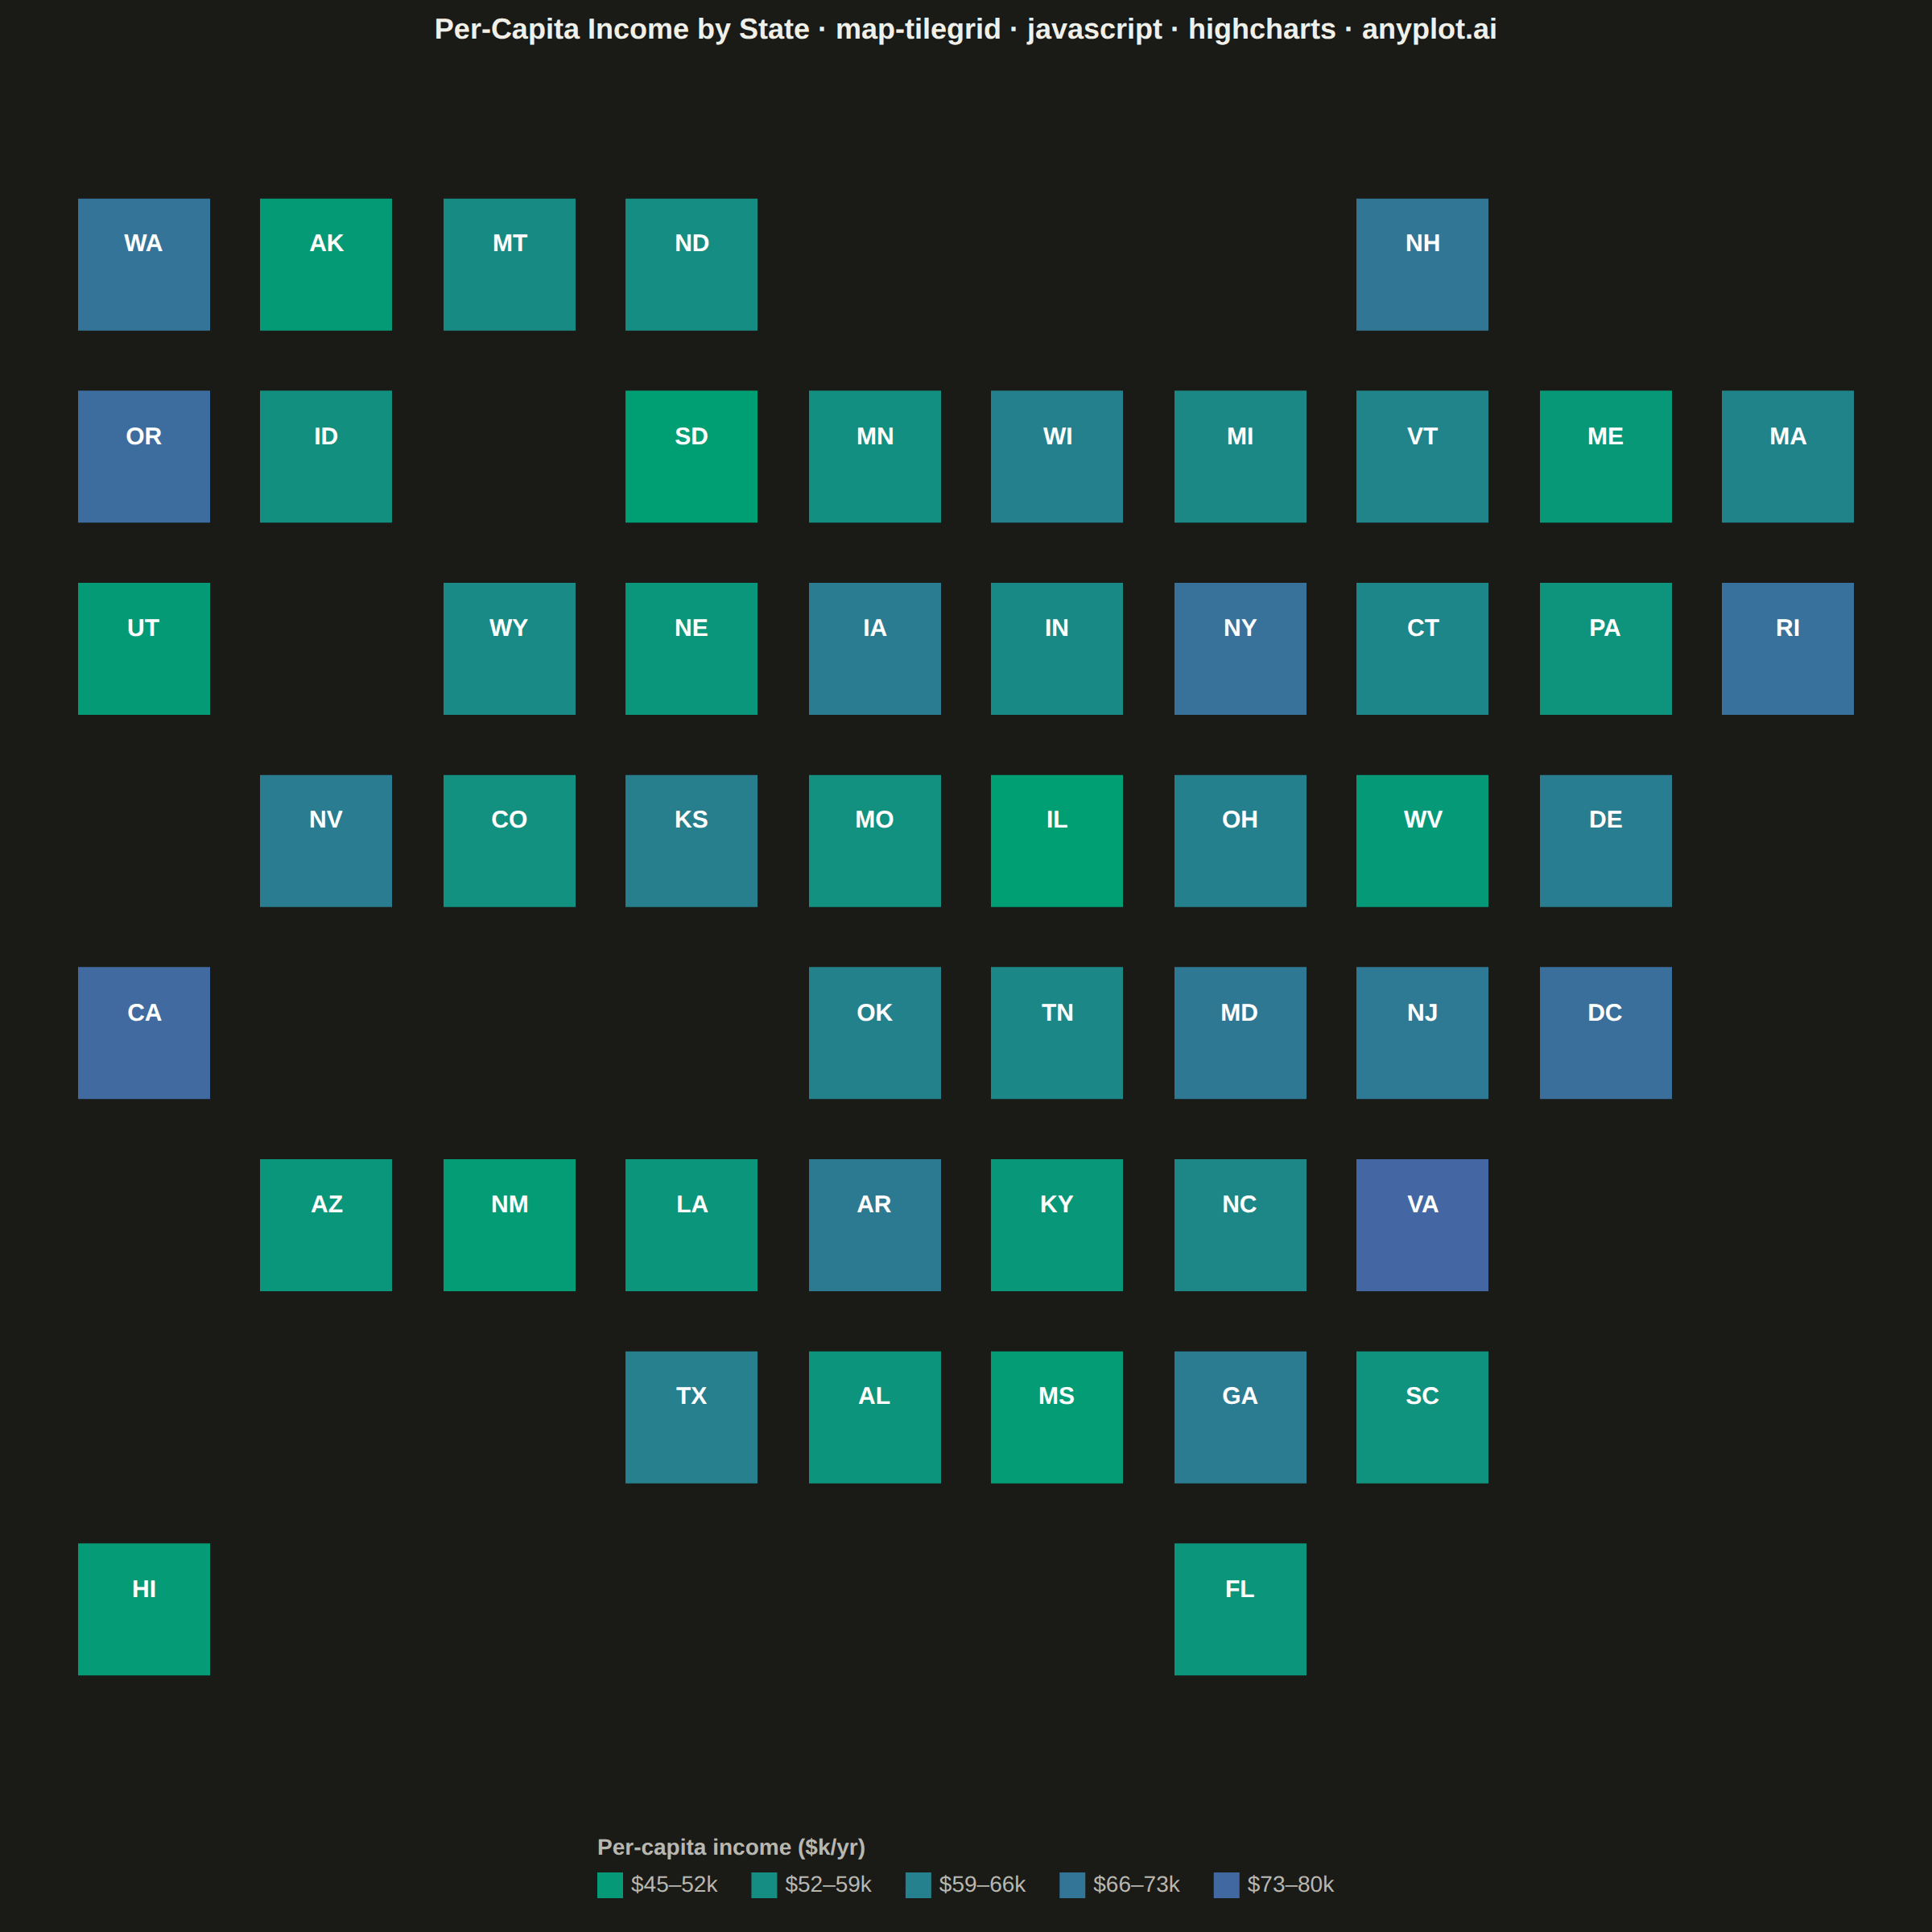
A tile grid map represents geographic regions (states, countries, provinces) as equally-sized tiles — squares or hexagons — arranged to approximate their real-world geographic positions. Unlike choropleth maps where large-area regions dominate visually, every region receives identical visual weight, making tile grid maps ideal for per-capita or per-region comparisons where the statistic matters more than physical area. Tiles are colored by a data variable and labeled with region abbreviations for identification.
// anyplot.ai
// map-tilegrid: Tile Grid Map for Equal-Area Geographic Comparison
// Library: highcharts 12.6.0 | JavaScript 22.23.2
// Quality: 88/100 | Created: 2026-09-05

//# anyplot-orientation: square
const t = window.ANYPLOT_TOKENS;

// --- Data: US state tile grid, per-capita income ($k) ----------------------
// Grid positions approximate real-world geography (row 0 = north, col 0 = west);
// AK and HI sit in their conventional detached top-left / bottom-left slots.
// Values are deterministic synthetic per-capita income figures, not census data.
const states = [
  { region: "WA", name: "Washington", row: 0, col: 0, value: 69.8 },
  { region: "AK", name: "Alaska", row: 0, col: 1, value: 48.0 },
  { region: "MT", name: "Montana", row: 0, col: 2, value: 56.4 },
  { region: "ND", name: "North Dakota", row: 0, col: 3, value: 55.3 },
  { region: "NH", name: "New Hampshire", row: 0, col: 7, value: 68.4 },
  { region: "OR", name: "Oregon", row: 1, col: 0, value: 74.1 },
  { region: "ID", name: "Idaho", row: 1, col: 1, value: 54.3 },
  { region: "SD", name: "South Dakota", row: 1, col: 3, value: 45.7 },
  { region: "MN", name: "Minnesota", row: 1, col: 4, value: 54.2 },
  { region: "WI", name: "Wisconsin", row: 1, col: 5, value: 62.8 },
  { region: "MI", name: "Michigan", row: 1, col: 6, value: 58.5 },
  { region: "VT", name: "Vermont", row: 1, col: 7, value: 60.7 },
  { region: "ME", name: "Maine", row: 1, col: 8, value: 49.0 },
  { region: "MA", name: "Massachusetts", row: 1, col: 9, value: 61.1 },
  { region: "UT", name: "Utah", row: 2, col: 0, value: 47.9 },
  { region: "WY", name: "Wyoming", row: 2, col: 2, value: 57.4 },
  { region: "NE", name: "Nebraska", row: 2, col: 3, value: 50.5 },
  { region: "IA", name: "Iowa", row: 2, col: 4, value: 65.2 },
  { region: "IN", name: "Indiana", row: 2, col: 5, value: 57.5 },
  { region: "NY", name: "New York", row: 2, col: 6, value: 71.5 },
  { region: "CT", name: "Connecticut", row: 2, col: 7, value: 59.4 },
  { region: "PA", name: "Pennsylvania", row: 2, col: 8, value: 52.2 },
  { region: "RI", name: "Rhode Island", row: 2, col: 9, value: 71.8 },
  { region: "NV", name: "Nevada", row: 3, col: 1, value: 65.2 },
  { region: "CO", name: "Colorado", row: 3, col: 2, value: 54.0 },
  { region: "KS", name: "Kansas", row: 3, col: 3, value: 63.7 },
  { region: "MO", name: "Missouri", row: 3, col: 4, value: 54.0 },
  { region: "IL", name: "Illinois", row: 3, col: 5, value: 45.7 },
  { region: "OH", name: "Ohio", row: 3, col: 6, value: 62.7 },
  { region: "WV", name: "West Virginia", row: 3, col: 7, value: 48.3 },
  { region: "DE", name: "Delaware", row: 3, col: 8, value: 64.9 },
  { region: "CA", name: "California", row: 4, col: 0, value: 75.4 },
  { region: "OK", name: "Oklahoma", row: 4, col: 4, value: 62.1 },
  { region: "TN", name: "Tennessee", row: 4, col: 5, value: 58.7 },
  { region: "MD", name: "Maryland", row: 4, col: 6, value: 67.6 },
  { region: "NJ", name: "New Jersey", row: 4, col: 7, value: 66.9 },
  { region: "DC", name: "District of Columbia", row: 4, col: 8, value: 72.5 },
  { region: "AZ", name: "Arizona", row: 5, col: 1, value: 50.4 },
  { region: "NM", name: "New Mexico", row: 5, col: 2, value: 47.0 },
  { region: "LA", name: "Louisiana", row: 5, col: 3, value: 50.8 },
  { region: "AR", name: "Arkansas", row: 5, col: 4, value: 66.2 },
  { region: "KY", name: "Kentucky", row: 5, col: 5, value: 49.9 },
  { region: "NC", name: "North Carolina", row: 5, col: 6, value: 59.1 },
  { region: "VA", name: "Virginia", row: 5, col: 7, value: 77.3 },
  { region: "TX", name: "Texas", row: 6, col: 3, value: 63.2 },
  { region: "AL", name: "Alabama", row: 6, col: 4, value: 51.5 },
  { region: "MS", name: "Mississippi", row: 6, col: 5, value: 47.1 },
  { region: "GA", name: "Georgia", row: 6, col: 6, value: 65.6 },
  { region: "SC", name: "South Carolina", row: 6, col: 7, value: 52.8 },
  { region: "HI", name: "Hawaii", row: 7, col: 0, value: 47.7 },
  { region: "FL", name: "Florida", row: 7, col: 6, value: 50.6 },
];

const maxCol = Math.max(...states.map((s) => s.col));
const maxRow = Math.max(...states.map((s) => s.row));
const valueMin = Math.min(...states.map((s) => s.value));
const valueMax = Math.max(...states.map((s) => s.value));

const title = "Per-Capita Income by State · map-tilegrid · javascript · highcharts · anyplot.ai";
const titleFontSize = Math.max(15, Math.round(22 * Math.min(1, 67 / title.length)));

// --- imprint_seq colormap (only core bundle is loaded — no coloraxis module,
// so the value → color mapping is computed by hand and applied per point) ---
function hexToRgb(hex) {
  const n = parseInt(hex.slice(1), 16);
  return [(n >> 16) & 255, (n >> 8) & 255, n & 255];
}
function imprintSeq(frac) {
  const [r1, g1, b1] = hexToRgb(t.seq[0]);
  const [r2, g2, b2] = hexToRgb(t.seq[1]);
  const mix = (a, b) => Math.round(a + (b - a) * frac);
  const toHex = (c) => c.toString(16).padStart(2, "0");
  return `#${toHex(mix(r1, r2))}${toHex(mix(g1, g2))}${toHex(mix(b1, b2))}`;
}
const colorFor = (value) => imprintSeq((value - valueMin) / (valueMax - valueMin));

// Discrete legend bins (5 buckets across the observed range, $5k-aligned edges)
const binStart = Math.floor(valueMin / 5) * 5;
const binEnd = Math.ceil(valueMax / 5) * 5;
const binWidth = (binEnd - binStart) / 5;
const legendBins = Array.from({ length: 5 }, (_, i) => {
  const lo = binStart + i * binWidth;
  const hi = lo + binWidth;
  return { label: `$${Math.round(lo)}–${Math.round(hi)}k`, color: colorFor((lo + hi) / 2) };
});

// Notable extremes, called out in the subtitle for an immediate takeaway.
const maxState = states.reduce((a, b) => (b.value > a.value ? b : a));
const minState = states.reduce((a, b) => (b.value < a.value ? b : a));
const subtitle = `Highest: ${maxState.name} ($${maxState.value.toFixed(1)}k) · Lowest: ${minState.name} ($${minState.value.toFixed(1)}k)`;

// --- Chart -------------------------------------------------------------------
Highcharts.chart("container", {
  chart: {
    type: "scatter",
    backgroundColor: "transparent",
    animation: false,
    style: { fontFamily: "inherit" },
  },
  credits: { enabled: false },
  title: {
    text: title,
    margin: 28,
    style: { color: t.ink, fontSize: `${titleFontSize}px`, fontWeight: "600" },
  },
  subtitle: {
    text: subtitle,
    style: { color: t.inkSoft, fontSize: "14px", fontStyle: "italic" },
  },
  xAxis: {
    min: -0.7,
    max: maxCol + 0.7,
    gridLineWidth: 0,
    lineWidth: 0,
    tickWidth: 0,
    labels: { enabled: false },
    title: { text: null },
  },
  yAxis: {
    min: -0.7,
    max: maxRow + 0.7,
    reversed: true,
    gridLineWidth: 0,
    lineWidth: 0,
    tickWidth: 0,
    labels: { enabled: false },
    title: { text: null },
  },
  legend: {
    layout: "horizontal",
    align: "center",
    verticalAlign: "bottom",
    itemStyle: { color: t.inkSoft, fontSize: "14px" },
    itemHoverStyle: { color: t.ink },
    symbolWidth: 18,
    symbolHeight: 18,
    symbolRadius: 4,
    itemMarginBottom: 4,
    title: {
      text: "Per-capita income ($k/yr)",
      style: { color: t.inkSoft, fontSize: "14px" },
    },
  },
  tooltip: {
    backgroundColor: t.elevatedBg,
    borderColor: t.grid,
    useHTML: true,
    style: { color: t.ink, fontSize: "13px" },
    formatter() {
      const rank = states.filter((s) => s.value > this.point.value).length + 1;
      return (
        `<div style="min-width:170px">` +
        `<span style="display:inline-block;width:10px;height:10px;border-radius:2px;` +
        `background:${this.point.color};margin-right:6px"></span>` +
        `<b>${this.point.name}</b><br/>` +
        `$${this.point.value.toFixed(1)}k per capita<br/>` +
        `<span style="color:${t.inkSoft}">Rank ${rank} of ${states.length}</span>` +
        `</div>`
      );
    },
  },
  plotOptions: {
    series: {
      animation: false,
      showInLegend: false,
      marker: {
        symbol: "square",
        radius: 42,
        lineWidth: 2,
        lineColor: t.pageBg,
      },
      dataLabels: {
        enabled: true,
        format: "{point.region}",
        style: {
          color: "#FFFFFF",
          fontSize: "15px",
          fontWeight: "600",
          textOutline: "none",
        },
      },
      states: { hover: { enabled: false } },
    },
  },
  series: [
    {
      name: "States",
      data: states.map((s) => ({
        x: s.col,
        y: s.row,
        value: s.value,
        name: s.name,
        region: s.region,
        color: colorFor(s.value),
      })),
    },
    ...legendBins.map((bin) => ({
      name: bin.label,
      color: bin.color,
      data: [],
      showInLegend: true,
      marker: { symbol: "square", radius: 9, lineWidth: 1, lineColor: t.grid },
      dataLabels: { enabled: false },
    })),
  ],
});
Runnable source as JSON, for any HTTP client: https://api.anyplot.ai/specs/map-tilegrid/highcharts/code. Any spec id and library id listed in llms-full.txt fit the same URL shape; every URL below is complete and callable.
{
  "spec_id": "map-tilegrid",
  "language": "javascript",
  "library": "highcharts",
  "page": "https://anyplot.ai/map-tilegrid/javascript/highcharts",
  "hub": "https://anyplot.ai/map-tilegrid",
  "code_json": "https://api.anyplot.ai/specs/map-tilegrid/highcharts/code",
  "spec_json": "https://api.anyplot.ai/specs/map-tilegrid",
  "render_light_png": "https://storage.googleapis.com/anyplot-images/plots/map-tilegrid/javascript/highcharts/plot-light.png",
  "render_dark_png": "https://storage.googleapis.com/anyplot-images/plots/map-tilegrid/javascript/highcharts/plot-dark.png",
  "interactive_light_html": "https://storage.googleapis.com/anyplot-images/plots/map-tilegrid/javascript/highcharts/plot-light.html",
  "interactive_dark_html": "https://storage.googleapis.com/anyplot-images/plots/map-tilegrid/javascript/highcharts/plot-dark.html",
  "quality_score": 88.0,
  "license": "MIT",
  "guide": "https://anyplot.ai/llms.txt"
}
Part of Tile Grid Map for Equal-Area Geographic Comparison on anyplot.ai.