The same plot in 14 other libraries — JavaScript: Chart.js, Apache ECharts, Highcharts, MUI X Charts; Python: Altair, Bokeh, lets-plot, Matplotlib, Plotly, plotnine, Pygal, Seaborn; R: ggplot2; Julia: Makie.jl. Compare all 15 side by side: Tile Grid Map for Equal-Area Geographic Comparison in Python, R, Julia and JavaScript.
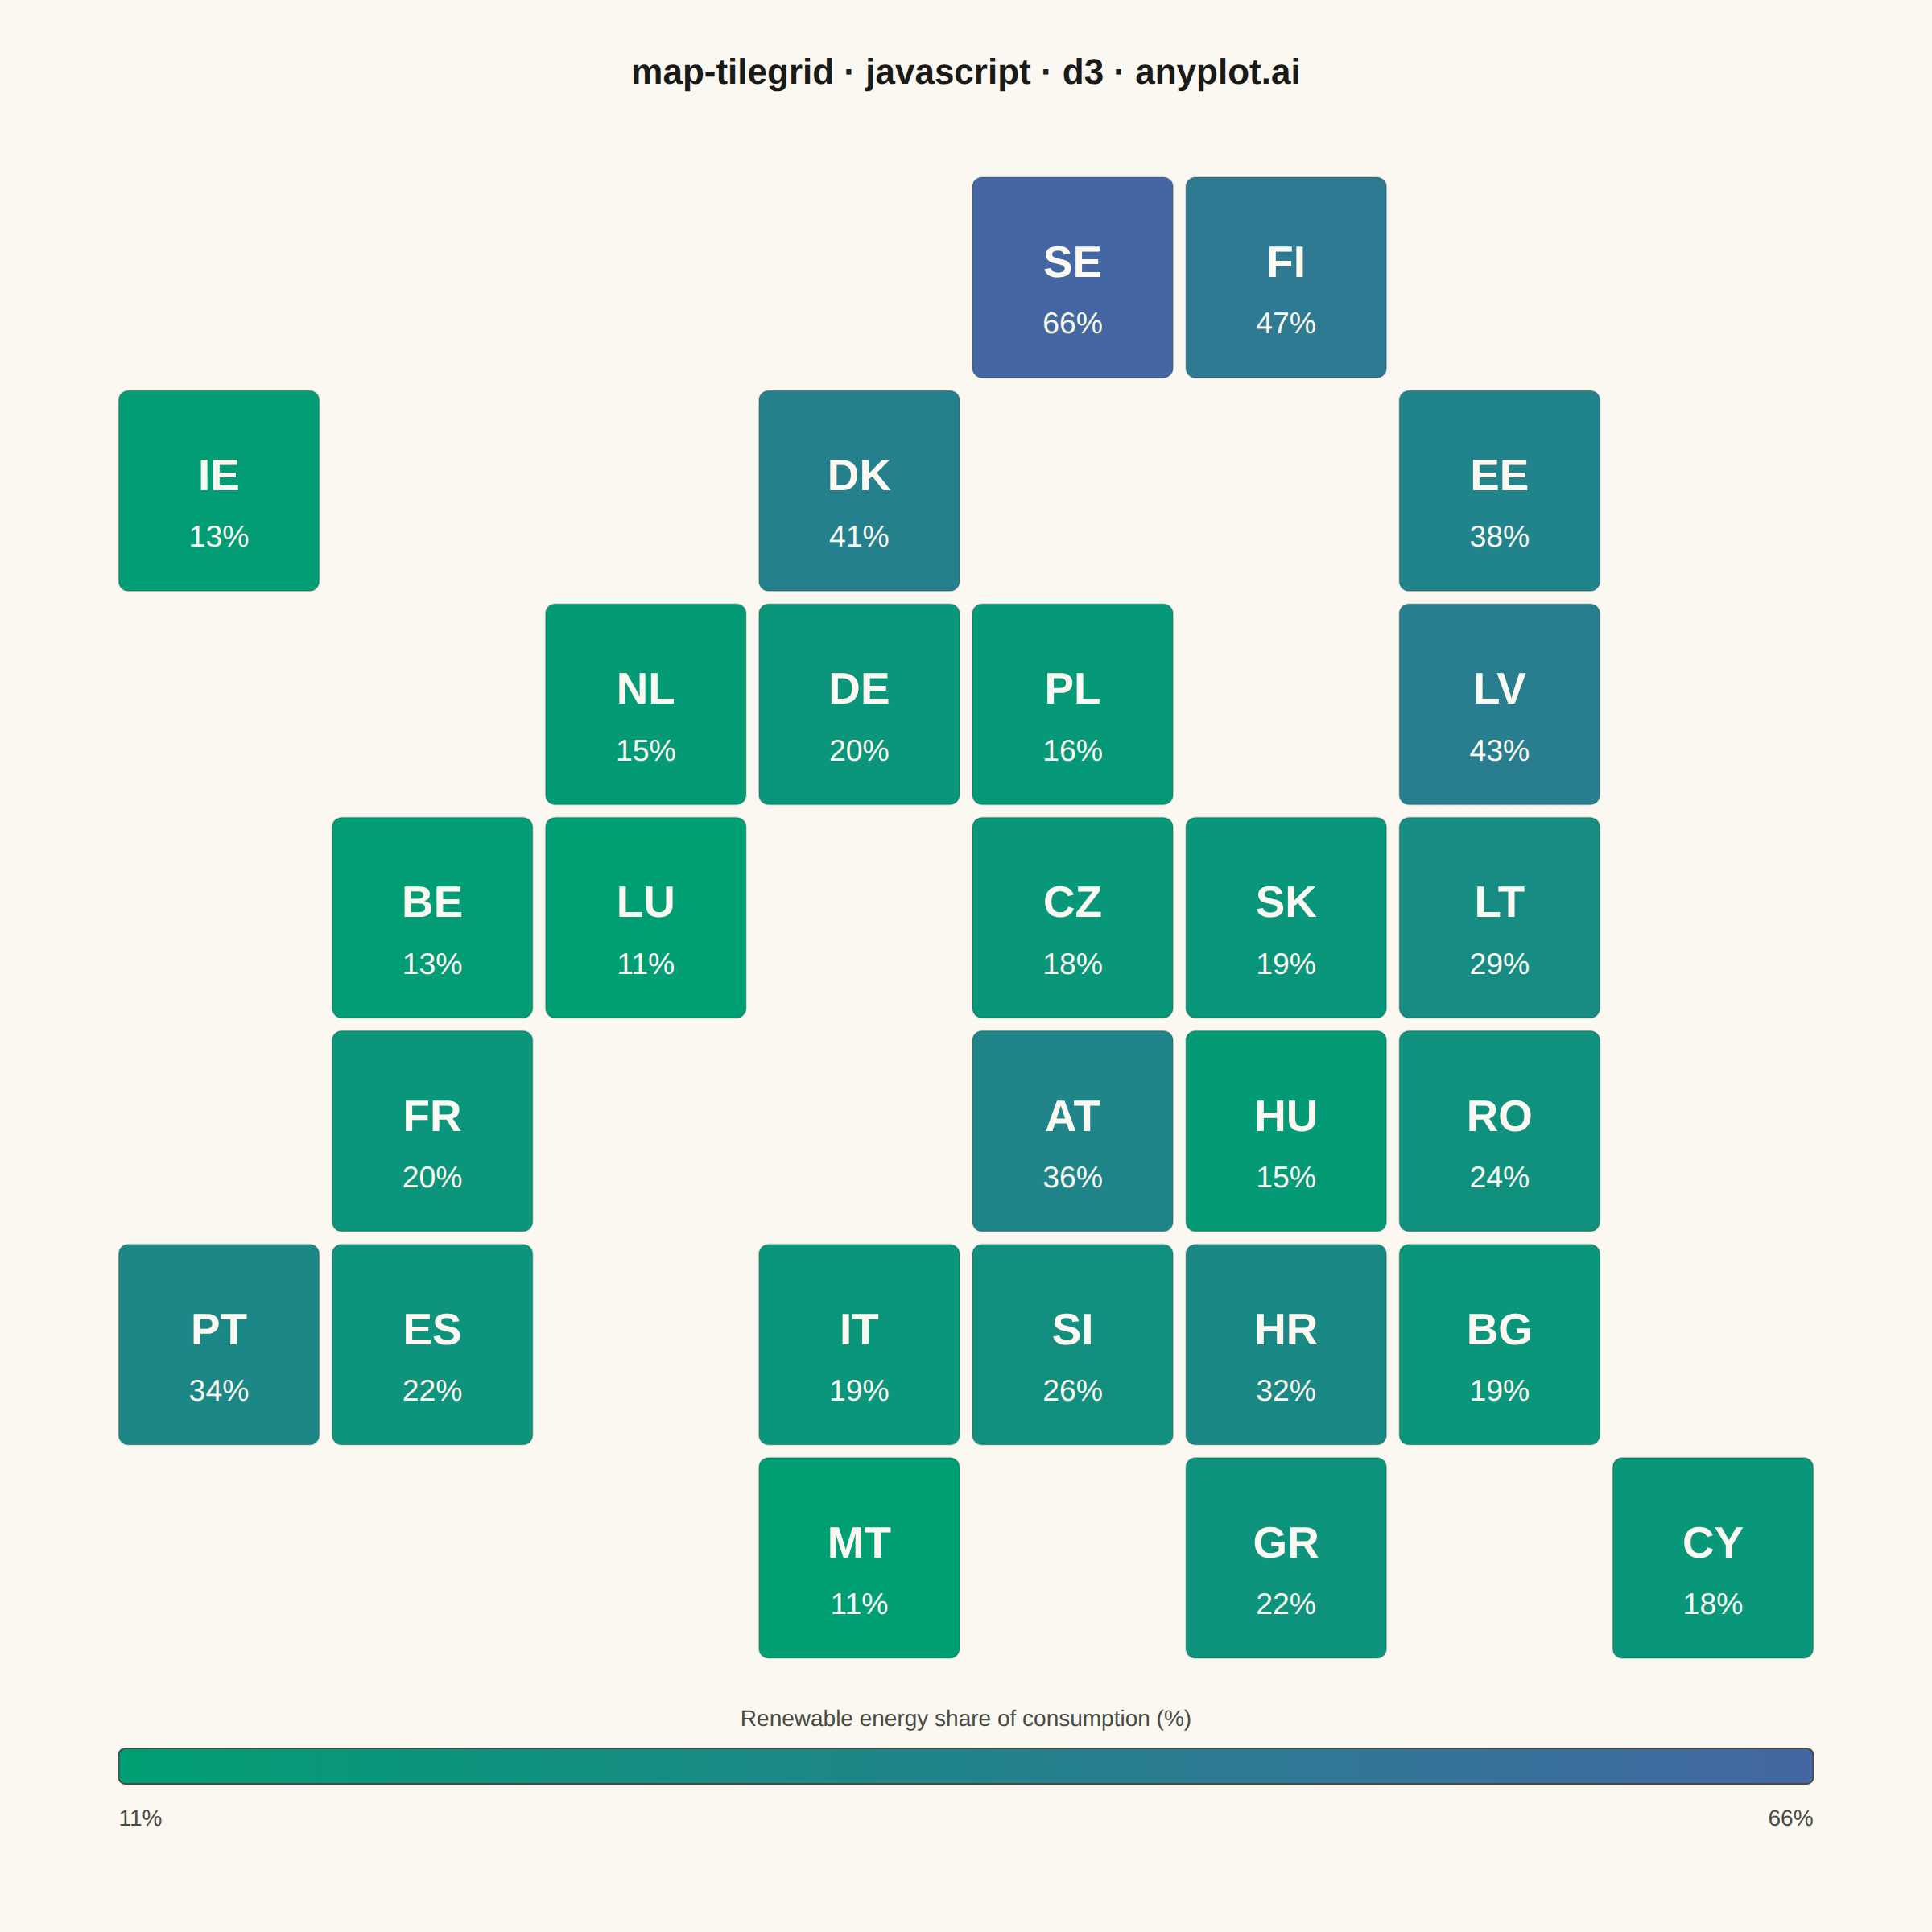
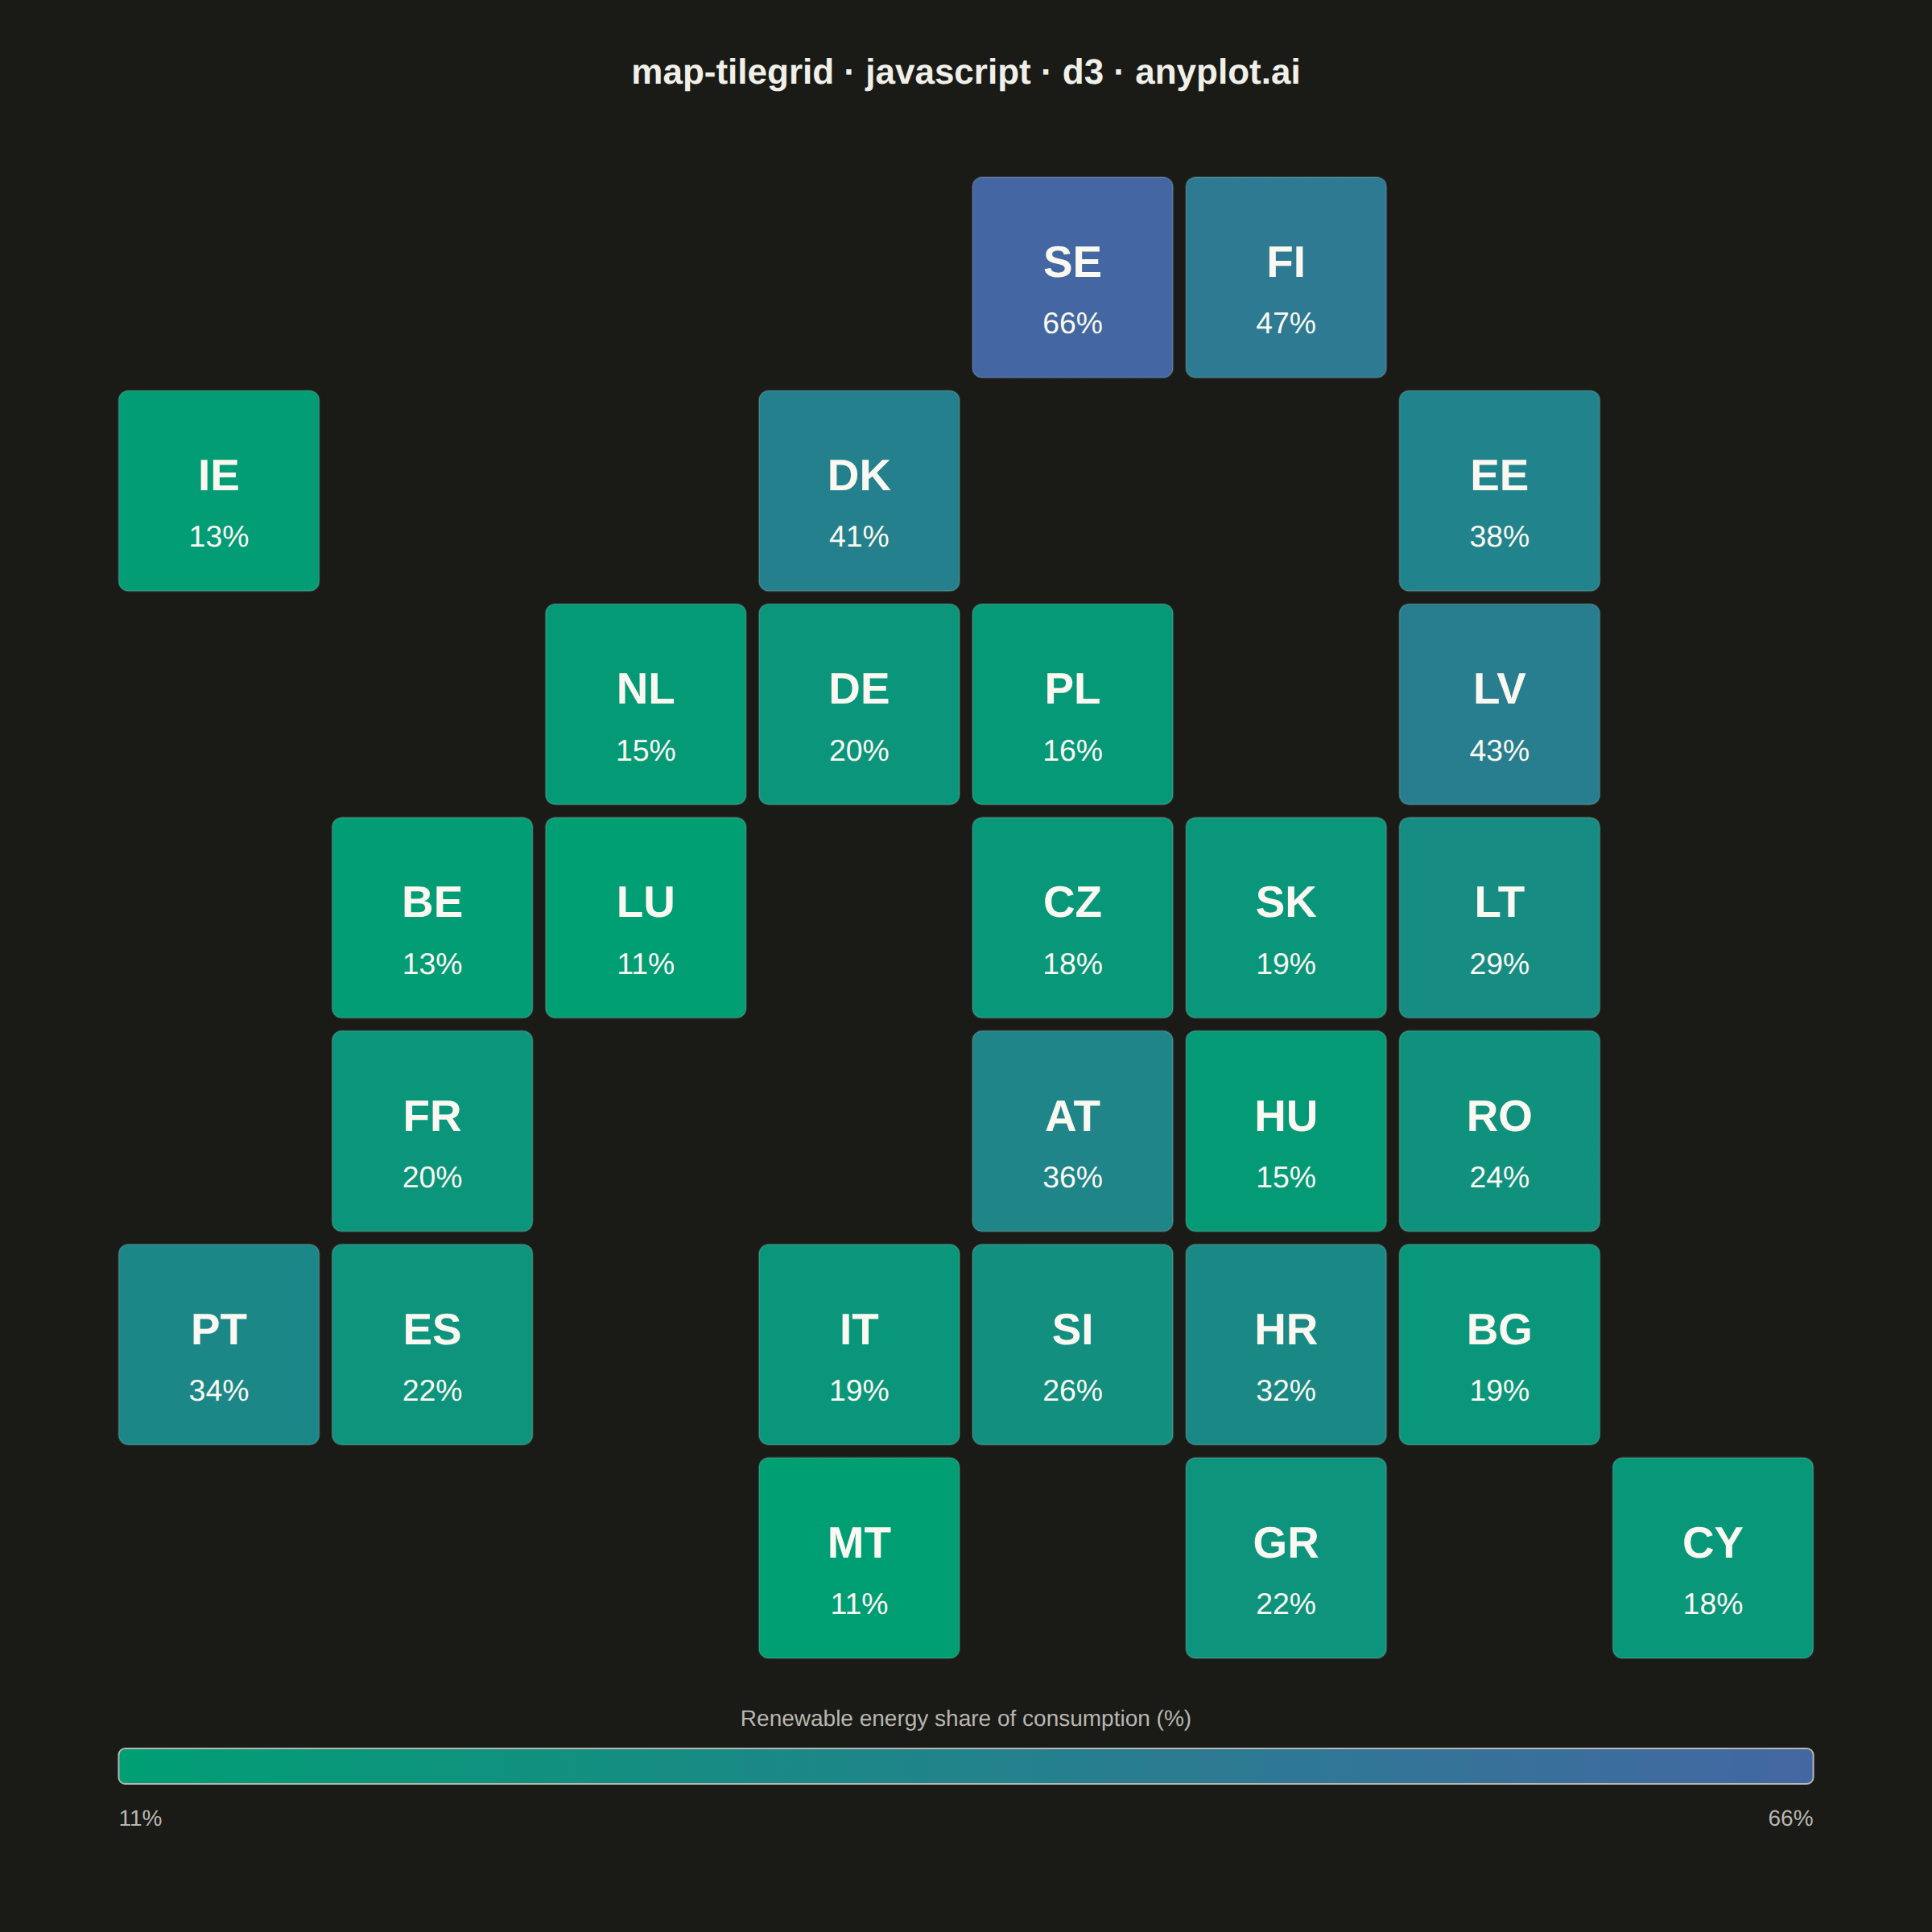
A tile grid map represents geographic regions (states, countries, provinces) as equally-sized tiles — squares or hexagons — arranged to approximate their real-world geographic positions. Unlike choropleth maps where large-area regions dominate visually, every region receives identical visual weight, making tile grid maps ideal for per-capita or per-region comparisons where the statistic matters more than physical area. Tiles are colored by a data variable and labeled with region abbreviations for identification.
// anyplot.ai
// map-tilegrid: Tile Grid Map for Equal-Area Geographic Comparison
// Library: d3 7.9.0 | JavaScript 22.23.2
// Quality: 90/100 | Created: 2026-09-05

//# anyplot-orientation: square
const t = window.ANYPLOT_TOKENS;
const { width, height } = window.ANYPLOT_SIZE;
const margin = { top: 110, right: 60, bottom: 170, left: 60 };

// --- Data (in-memory, deterministic) ----------------------------------------
// Renewable energy share of gross final energy consumption (%), EU-27, 2022.
// Countries are laid out on a tile grid that approximates their geographic
// position, so every country gets identical visual weight regardless of area.
const data = [
  { code: "SE", value: 66, row: 0, col: 4 },
  { code: "FI", value: 47, row: 0, col: 5 },
  { code: "IE", value: 13, row: 1, col: 0 },
  { code: "DK", value: 41, row: 1, col: 3 },
  { code: "EE", value: 38, row: 1, col: 6 },
  { code: "NL", value: 15, row: 2, col: 2 },
  { code: "DE", value: 20, row: 2, col: 3 },
  { code: "PL", value: 16, row: 2, col: 4 },
  { code: "LV", value: 43, row: 2, col: 6 },
  { code: "BE", value: 13, row: 3, col: 1 },
  { code: "LU", value: 11, row: 3, col: 2 },
  { code: "CZ", value: 18, row: 3, col: 4 },
  { code: "SK", value: 19, row: 3, col: 5 },
  { code: "LT", value: 29, row: 3, col: 6 },
  { code: "FR", value: 20, row: 4, col: 1 },
  { code: "AT", value: 36, row: 4, col: 4 },
  { code: "HU", value: 15, row: 4, col: 5 },
  { code: "RO", value: 24, row: 4, col: 6 },
  { code: "PT", value: 34, row: 5, col: 0 },
  { code: "ES", value: 22, row: 5, col: 1 },
  { code: "IT", value: 19, row: 5, col: 3 },
  { code: "SI", value: 26, row: 5, col: 4 },
  { code: "HR", value: 32, row: 5, col: 5 },
  { code: "BG", value: 19, row: 5, col: 6 },
  { code: "MT", value: 11, row: 6, col: 3 },
  { code: "GR", value: 22, row: 6, col: 5 },
  { code: "CY", value: 18, row: 6, col: 7 },
];

const gridCols = d3.max(data, (d) => d.col) + 1;
const gridRows = d3.max(data, (d) => d.row) + 1;
const gap = 8;

// --- SVG mount ---------------------------------------------------------------
const svg = d3
  .select("#container")
  .append("svg")
  .attr("width", width)
  .attr("height", height);

// --- Tile layout (equal-area squares, centered in the plot area) ------------
const innerW = width - margin.left - margin.right;
const innerH = height - margin.top - margin.bottom;
const tileSize = Math.min(
  (innerW - gap * (gridCols - 1)) / gridCols,
  (innerH - gap * (gridRows - 1)) / gridRows,
);
const gridWidth = gridCols * tileSize + gap * (gridCols - 1);
const gridHeight = gridRows * tileSize + gap * (gridRows - 1);
const offsetX = margin.left + (innerW - gridWidth) / 2;
const offsetY = margin.top + (innerH - gridHeight) / 2;

const g = svg.append("g").attr("transform", `translate(${offsetX},${offsetY})`);

// --- Color scale (sequential — single-polarity share-of-total data) --------
const [minValue, maxValue] = d3.extent(data, (d) => d.value);
const color = d3
  .scaleSequential(d3.interpolateRgbBasis(t.seq))
  .domain([minValue, maxValue]);

// Perceived luminance decides whether tile text needs light or dark ink so it
// stays legible against every fill the sequential scale can produce.
function textInkFor(hex) {
  const rgb = d3.rgb(hex);
  const luminance = (0.299 * rgb.r + 0.587 * rgb.g + 0.114 * rgb.b) / 255;
  return luminance > 0.55 ? "#1A1A17" : "#FAF8F1";
}

// --- Tiles --------------------------------------------------------------------
const tiles = g
  .selectAll("g.tile")
  .data(data)
  .join("g")
  .attr("class", "tile")
  .attr(
    "transform",
    (d) => `translate(${d.col * (tileSize + gap)},${d.row * (tileSize + gap)})`,
  );

tiles
  .append("rect")
  .attr("width", tileSize)
  .attr("height", tileSize)
  .attr("rx", 6)
  .attr("fill", (d) => color(d.value))
  .attr("stroke", t.grid)
  .attr("stroke-width", 1);

tiles
  .append("text")
  .attr("x", tileSize / 2)
  .attr("y", tileSize / 2 - tileSize * 0.06)
  .attr("text-anchor", "middle")
  .attr("dominant-baseline", "middle")
  .attr("fill", (d) => textInkFor(color(d.value)))
  .style("font-size", `${Math.max(16, tileSize * 0.22)}px`)
  .style("font-weight", "700")
  .text((d) => d.code);

tiles
  .append("text")
  .attr("x", tileSize / 2)
  .attr("y", tileSize / 2 + tileSize * 0.24)
  .attr("text-anchor", "middle")
  .attr("dominant-baseline", "middle")
  .attr("fill", (d) => textInkFor(color(d.value)))
  .style("font-size", `${Math.max(12, tileSize * 0.15)}px`)
  .style("font-weight", "400")
  .text((d) => `${d.value}%`);

// --- Legend (colorbar: value-to-color mapping) -------------------------------
const legendWidth = gridWidth;
const legendHeight = 22;
const legendX = offsetX;
const legendY = offsetY + gridHeight + 56;

const gradientId = "imprint-seq-gradient";
const gradientStops = d3.range(0, 1.0001, 0.1);
svg
  .append("defs")
  .append("linearGradient")
  .attr("id", gradientId)
  .attr("x1", "0%")
  .attr("x2", "100%")
  .selectAll("stop")
  .data(gradientStops)
  .join("stop")
  .attr("offset", (d) => `${d * 100}%`)
  .attr("stop-color", (d) => color(minValue + d * (maxValue - minValue)));

const legend = svg
  .append("g")
  .attr("transform", `translate(${legendX},${legendY})`);

legend
  .append("rect")
  .attr("width", legendWidth)
  .attr("height", legendHeight)
  .attr("rx", 4)
  .attr("fill", `url(#${gradientId})`)
  .attr("stroke", t.inkSoft)
  .attr("stroke-width", 1);

legend
  .append("text")
  .attr("x", 0)
  .attr("y", legendHeight + 26)
  .attr("text-anchor", "start")
  .attr("fill", t.inkSoft)
  .style("font-size", "14px")
  .text(`${minValue}%`);

legend
  .append("text")
  .attr("x", legendWidth)
  .attr("y", legendHeight + 26)
  .attr("text-anchor", "end")
  .attr("fill", t.inkSoft)
  .style("font-size", "14px")
  .text(`${maxValue}%`);

legend
  .append("text")
  .attr("x", legendWidth / 2)
  .attr("y", -14)
  .attr("text-anchor", "middle")
  .attr("fill", t.inkSoft)
  .style("font-size", "14px")
  .text("Renewable energy share of consumption (%)");

// --- Title --------------------------------------------------------------------
svg
  .append("text")
  .attr("x", width / 2)
  .attr("y", 52)
  .attr("text-anchor", "middle")
  .attr("fill", t.ink)
  .style("font-size", "22px")
  .style("font-weight", "600")
  .text("map-tilegrid · javascript · d3 · anyplot.ai");
Runnable source as JSON, for any HTTP client: https://api.anyplot.ai/specs/map-tilegrid/d3/code. Any spec id and library id listed in llms-full.txt fit the same URL shape; every URL below is complete and callable.
{
  "spec_id": "map-tilegrid",
  "language": "javascript",
  "library": "d3",
  "page": "https://anyplot.ai/map-tilegrid/javascript/d3",
  "hub": "https://anyplot.ai/map-tilegrid",
  "code_json": "https://api.anyplot.ai/specs/map-tilegrid/d3/code",
  "spec_json": "https://api.anyplot.ai/specs/map-tilegrid",
  "render_light_png": "https://storage.googleapis.com/anyplot-images/plots/map-tilegrid/javascript/d3/plot-light.png",
  "render_dark_png": "https://storage.googleapis.com/anyplot-images/plots/map-tilegrid/javascript/d3/plot-dark.png",
  "interactive_light_html": "https://storage.googleapis.com/anyplot-images/plots/map-tilegrid/javascript/d3/plot-light.html",
  "interactive_dark_html": "https://storage.googleapis.com/anyplot-images/plots/map-tilegrid/javascript/d3/plot-dark.html",
  "quality_score": 90.0,
  "license": "MIT",
  "guide": "https://anyplot.ai/llms.txt"
}
Part of Tile Grid Map for Equal-Area Geographic Comparison on anyplot.ai.