The same plot in 14 other libraries — JavaScript: Chart.js, D3.js, Highcharts, MUI X Charts; Python: Altair, Bokeh, lets-plot, Matplotlib, Plotly, plotnine, Pygal, Seaborn; R: ggplot2; Julia: Makie.jl. Compare all 15 side by side: Tile Grid Map for Equal-Area Geographic Comparison in Python, R, Julia and JavaScript.
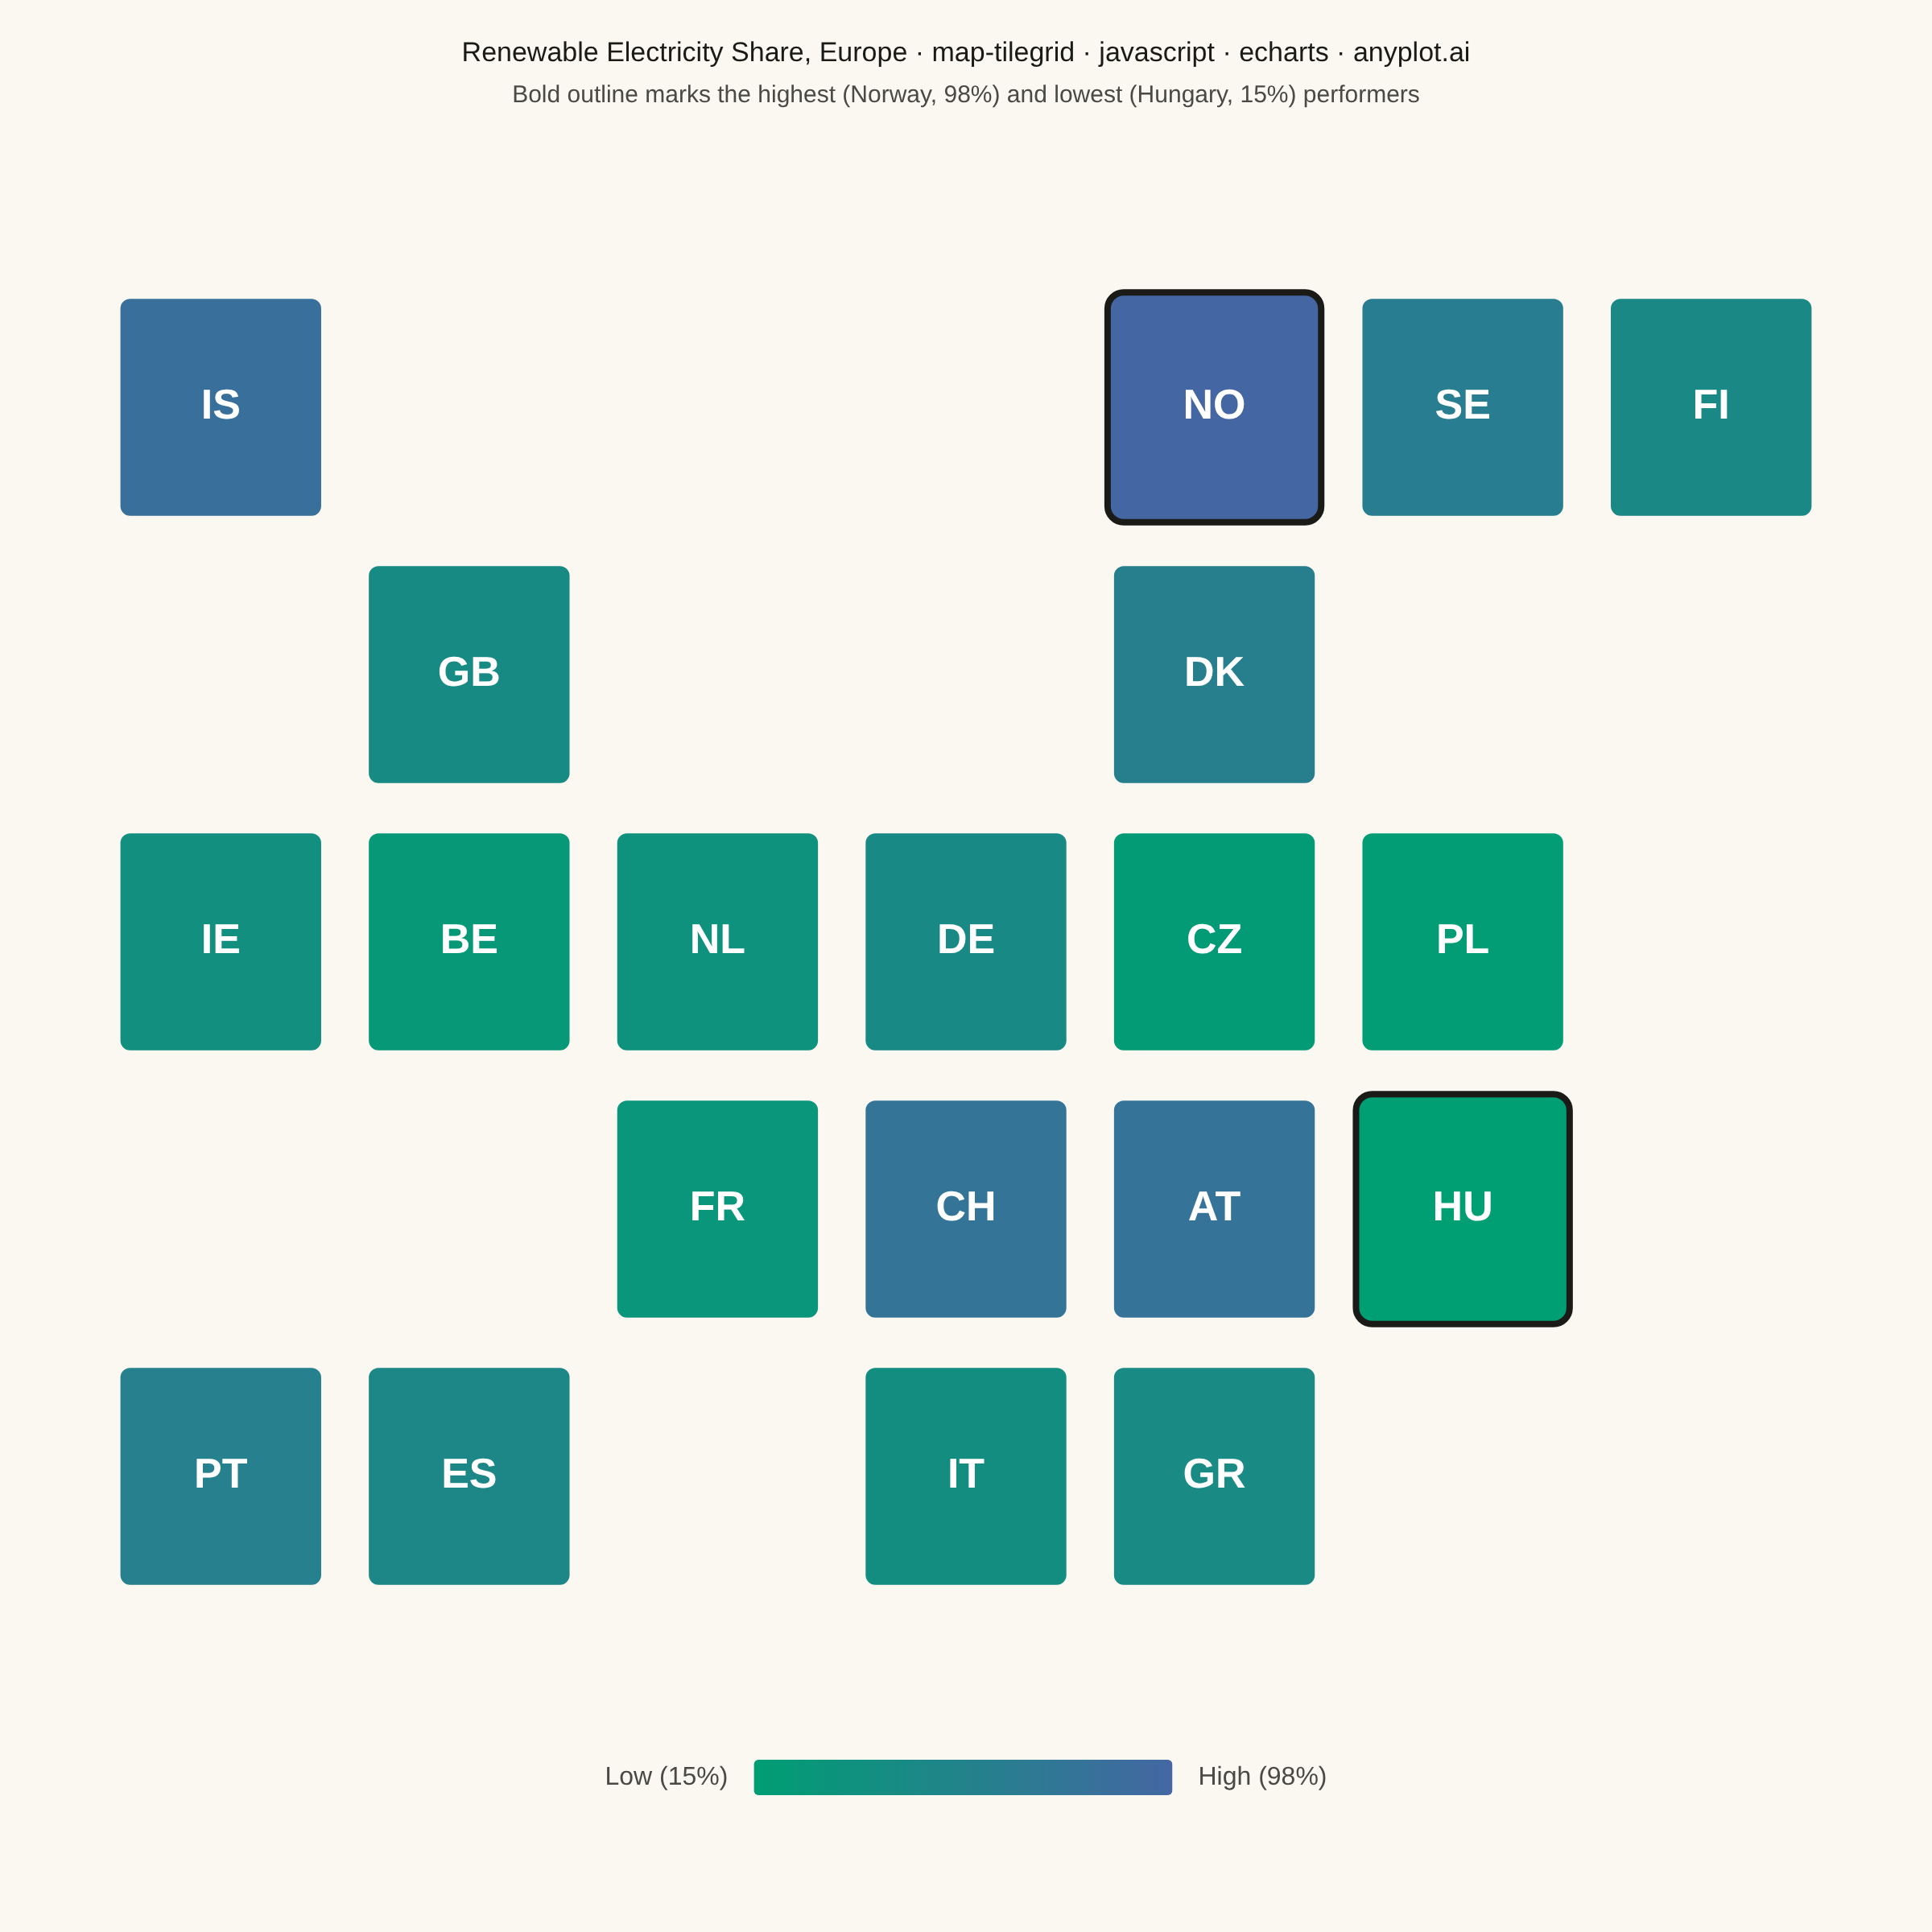
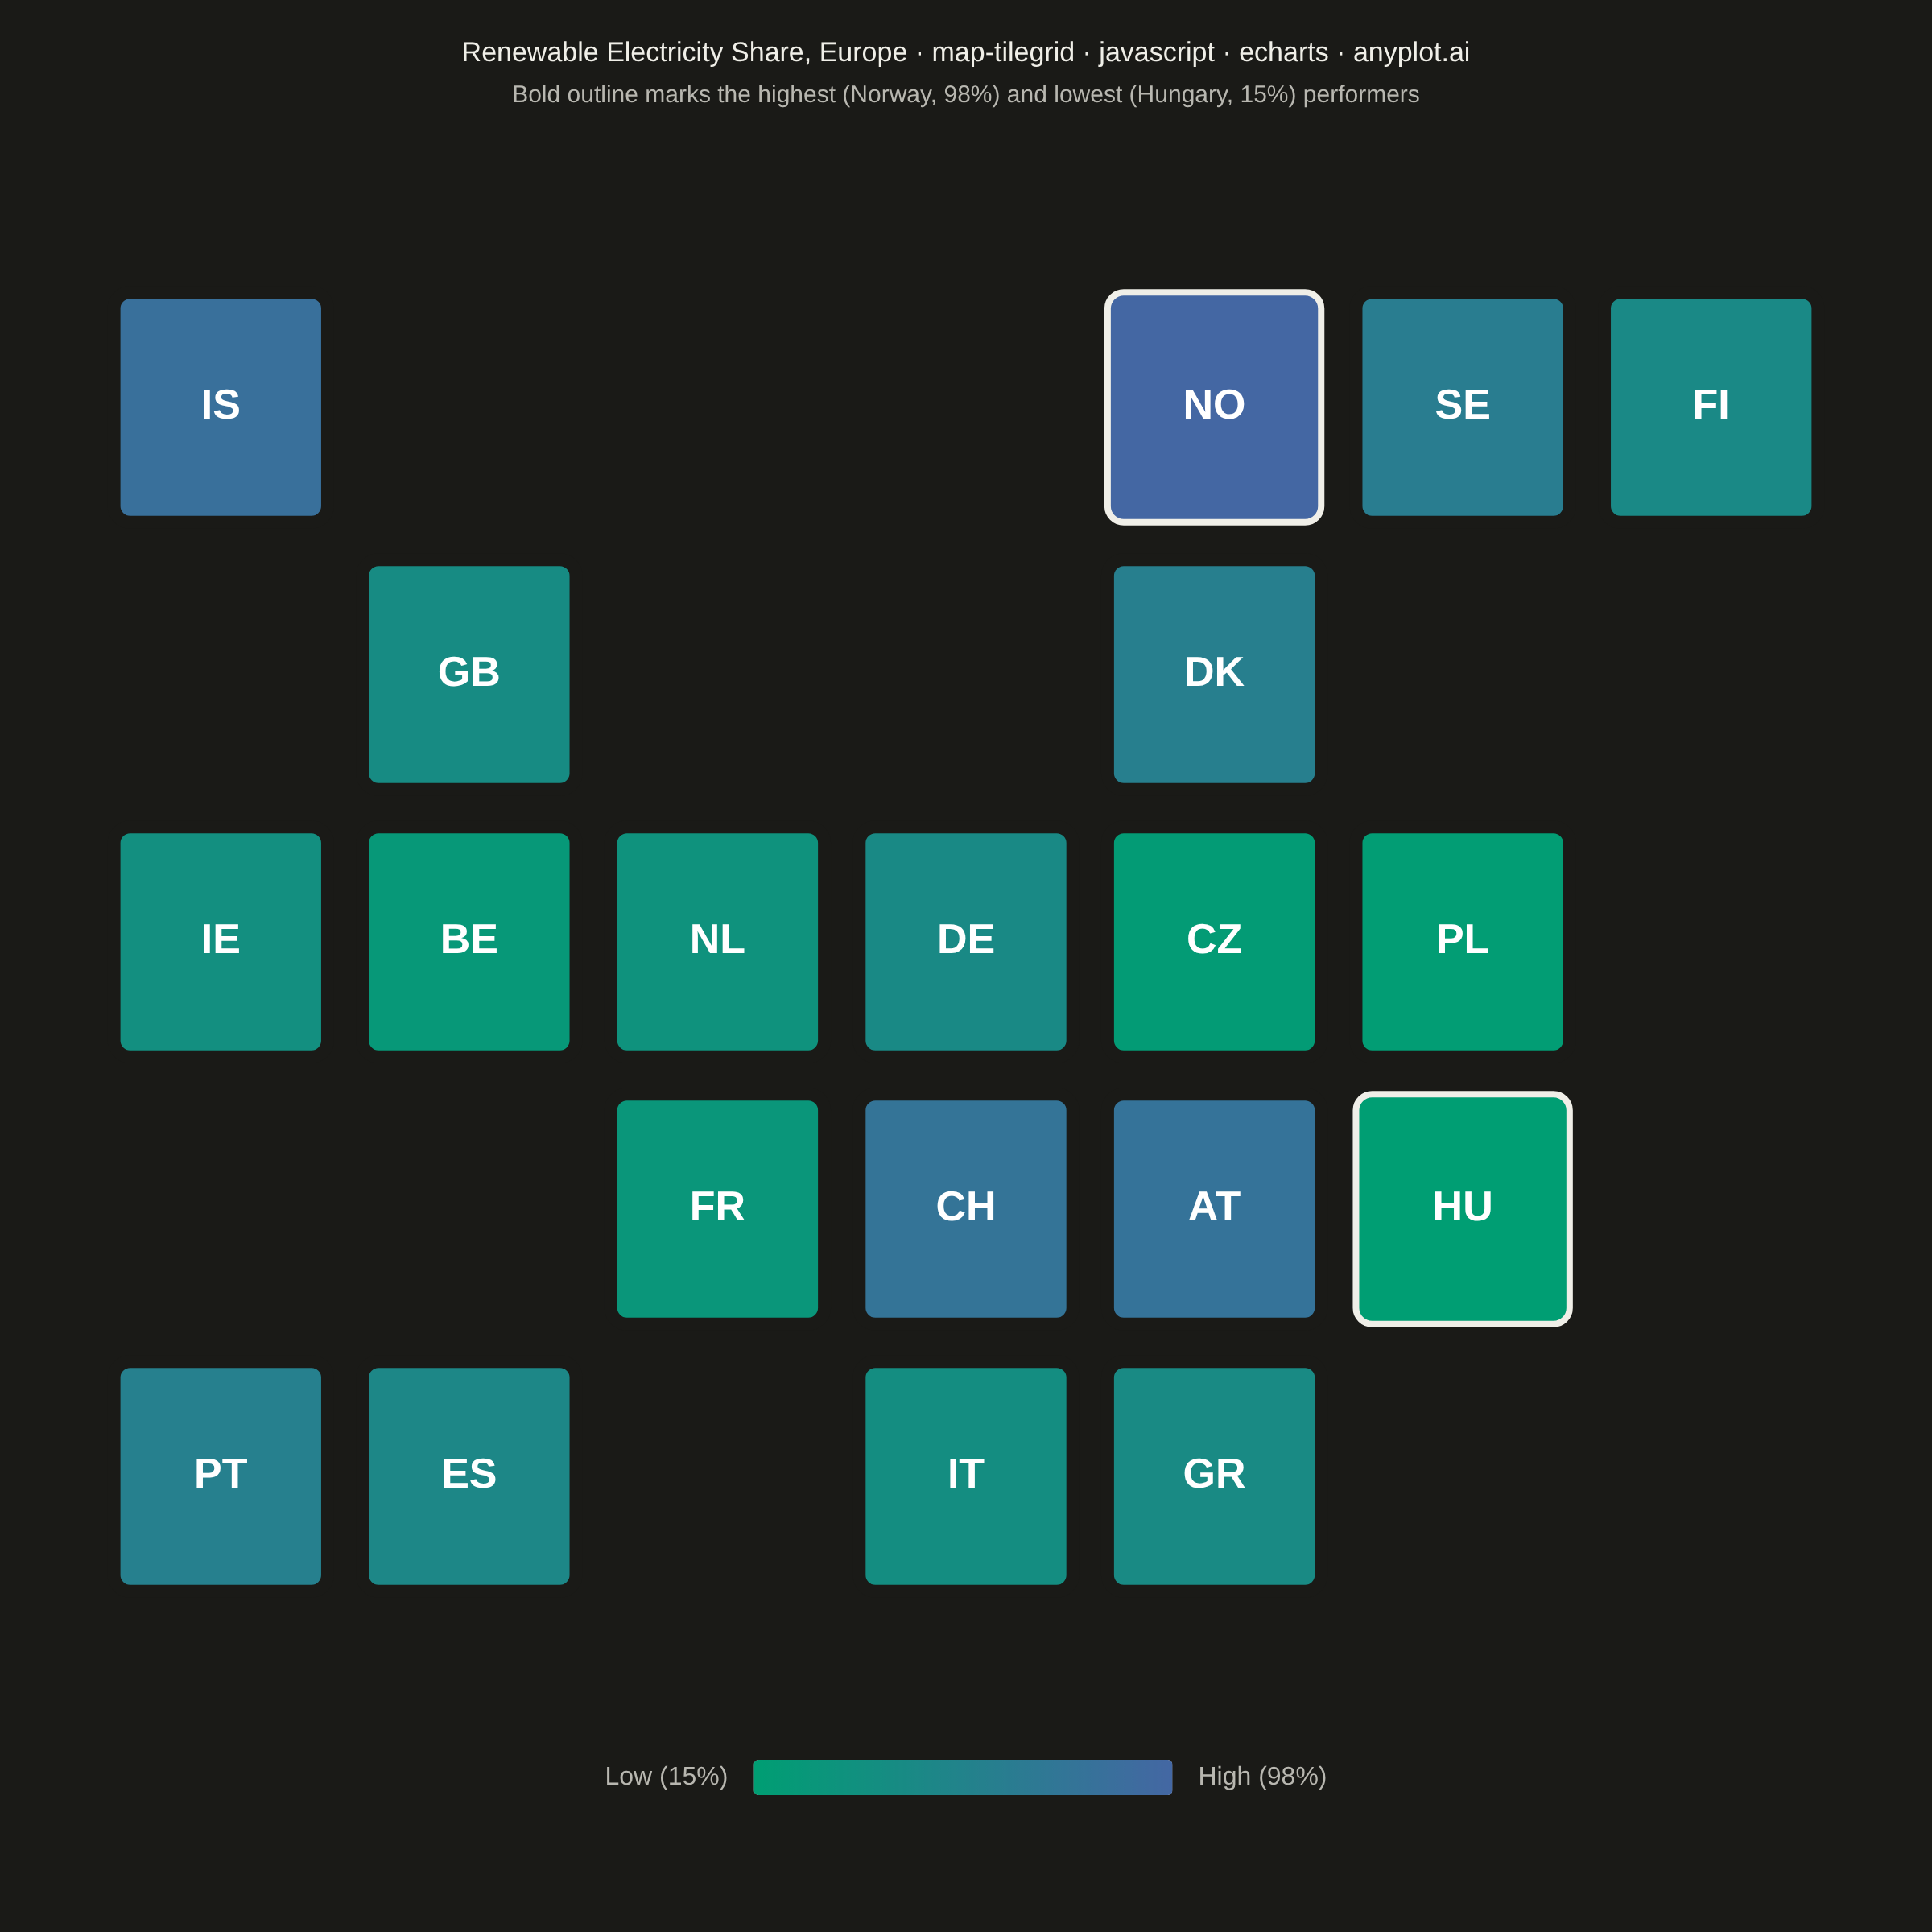
A tile grid map represents geographic regions (states, countries, provinces) as equally-sized tiles — squares or hexagons — arranged to approximate their real-world geographic positions. Unlike choropleth maps where large-area regions dominate visually, every region receives identical visual weight, making tile grid maps ideal for per-capita or per-region comparisons where the statistic matters more than physical area. Tiles are colored by a data variable and labeled with region abbreviations for identification.
// anyplot.ai
// map-tilegrid: Tile Grid Map for Equal-Area Geographic Comparison
// Library: echarts 6.1.0 | JavaScript 22.23.2
// Quality: 90/100 | Created: 2026-09-05

//# anyplot-orientation: square
const t = window.ANYPLOT_TOKENS;

// --- Data (in-memory, deterministic) ----------------------------------------
// European countries on a hand-placed tile grid approximating their real
// geographic layout, colored by share of electricity from renewable sources.
// [col, row, renewablePct, abbreviation, countryName]
const countries = [
  [0, 0, 85, "IS", "Iceland"],
  [4, 0, 98, "NO", "Norway"],
  [5, 0, 65, "SE", "Sweden"],
  [6, 0, 47, "FI", "Finland"],
  [1, 1, 43, "GB", "United Kingdom"],
  [4, 1, 62, "DK", "Denmark"],
  [0, 2, 38, "IE", "Ireland"],
  [1, 2, 24, "BE", "Belgium"],
  [2, 2, 33, "NL", "Netherlands"],
  [3, 2, 46, "DE", "Germany"],
  [4, 2, 19, "CZ", "Czechia"],
  [5, 2, 17, "PL", "Poland"],
  [2, 3, 27, "FR", "France"],
  [3, 3, 78, "CH", "Switzerland"],
  [4, 3, 80, "AT", "Austria"],
  [5, 3, 15, "HU", "Hungary"],
  [0, 4, 61, "PT", "Portugal"],
  [1, 4, 50, "ES", "Spain"],
  [3, 4, 40, "IT", "Italy"],
  [4, 4, 45, "GR", "Greece"],
];

const colCount = Math.max(...countries.map((c) => c[0])) + 1;
const rowCount = Math.max(...countries.map((c) => c[1])) + 1;
const values = countries.map((c) => c[2]);
const maxValue = Math.max(...values);
const minValue = Math.min(...values);
const maxCountry = countries.find((c) => c[2] === maxValue);
const minCountry = countries.find((c) => c[2] === minValue);

// --- Title --------------------------------------------------------------
const title =
  "Renewable Electricity Share, Europe · map-tilegrid · javascript · echarts · anyplot.ai";
const titleFontSize = Math.max(
  14,
  Math.round(22 * Math.min(1, 67 / title.length)),
);
const subtitle = `Bold outline marks the highest (${maxCountry[4]}, ${maxValue}%) and lowest (${minCountry[4]}, ${minValue}%) performers`;

// --- Init -------------------------------------------------------------------
const chart = echarts.init(document.getElementById("container"));

// --- Option -----------------------------------------------------------------
chart.setOption({
  animation: false,
  backgroundColor: "transparent",
  title: {
    text: title,
    subtext: subtitle,
    left: "center",
    top: 20,
    textStyle: { color: t.ink, fontSize: titleFontSize, fontWeight: 500 },
    subtextStyle: { color: t.inkSoft, fontSize: 15 },
  },
  tooltip: {
    formatter: (params) => {
      const c = countries[params.dataIndex];
      return `${c[4]} (${c[3]}): ${c[2]}% renewable`;
    },
  },
  grid: { left: 60, right: 60, top: 170, bottom: 200, containLabel: false },
  xAxis: {
    type: "category",
    data: Array.from({ length: colCount }, (_, i) => i),
    show: false,
  },
  yAxis: {
    type: "category",
    data: Array.from({ length: rowCount }, (_, i) => i),
    inverse: true,
    show: false,
  },
  visualMap: {
    type: "continuous",
    min: minValue,
    max: maxValue,
    orient: "horizontal",
    left: "center",
    bottom: 70,
    itemWidth: 22,
    itemHeight: 260,
    text: [`High (${maxValue}%)`, `Low (${minValue}%)`],
    textGap: 16,
    textStyle: { color: t.inkSoft, fontSize: 16 },
    inRange: { color: t.seq },
    formatter: (value) => `${Math.round(value)}%`,
  },
  series: [
    {
      // Custom renderItem series (rather than a plain heatmap) draws each
      // tile as a hand-built rounded rect, giving direct control over the
      // per-tile emphasis border used to call out the min/max performers.
      type: "custom",
      coordinateSystem: "cartesian2d",
      encode: { x: 0, y: 1, value: 2 },
      data: countries.map((c) => [c[0], c[1], c[2]]),
      renderItem: (params, api) => {
        const col = api.value(0);
        const row = api.value(1);
        const value = api.value(2);
        const center = api.coord([col, row]);
        const size = api.size([1, 1]);
        const width = size[0] * 0.86;
        const height = size[1] * 0.86;
        const isExtreme = value === maxValue || value === minValue;
        const country = countries[params.dataIndex];
        return {
          type: "rect",
          shape: {
            x: center[0] - width / 2,
            y: center[1] - height / 2,
            width,
            height,
            r: 10,
          },
          style: {
            fill: api.visual("color"),
            stroke: isExtreme ? t.ink : t.pageBg,
            lineWidth: isExtreme ? 4 : 8,
          },
          textContent: {
            type: "text",
            style: {
              text: country[3],
              fill: "#FFFFFF",
              fontSize: 26,
              fontWeight: 600,
              textBorderColor: "rgba(0,0,0,0.35)",
              textBorderWidth: 3,
            },
          },
          textConfig: { position: "inside" },
          emphasis: {
            style: { stroke: t.ink, lineWidth: 4 },
          },
        };
      },
    },
  ],
});
Runnable source as JSON, for any HTTP client: https://api.anyplot.ai/specs/map-tilegrid/echarts/code. Any spec id and library id listed in llms-full.txt fit the same URL shape; every URL below is complete and callable.
{
  "spec_id": "map-tilegrid",
  "language": "javascript",
  "library": "echarts",
  "page": "https://anyplot.ai/map-tilegrid/javascript/echarts",
  "hub": "https://anyplot.ai/map-tilegrid",
  "code_json": "https://api.anyplot.ai/specs/map-tilegrid/echarts/code",
  "spec_json": "https://api.anyplot.ai/specs/map-tilegrid",
  "render_light_png": "https://storage.googleapis.com/anyplot-images/plots/map-tilegrid/javascript/echarts/plot-light.png",
  "render_dark_png": "https://storage.googleapis.com/anyplot-images/plots/map-tilegrid/javascript/echarts/plot-dark.png",
  "interactive_light_html": "https://storage.googleapis.com/anyplot-images/plots/map-tilegrid/javascript/echarts/plot-light.html",
  "interactive_dark_html": "https://storage.googleapis.com/anyplot-images/plots/map-tilegrid/javascript/echarts/plot-dark.html",
  "quality_score": 90.0,
  "license": "MIT",
  "guide": "https://anyplot.ai/llms.txt"
}
Part of Tile Grid Map for Equal-Area Geographic Comparison on anyplot.ai.