The same plot in 14 other libraries — Python: Altair, lets-plot, Matplotlib, Plotly, plotnine, Pygal, Seaborn; R: ggplot2; Julia: Makie.jl; JavaScript: Chart.js, D3.js, Apache ECharts, Highcharts, MUI X Charts. Compare all 15 side by side: Tile Grid Map for Equal-Area Geographic Comparison in Python, R, Julia and JavaScript.
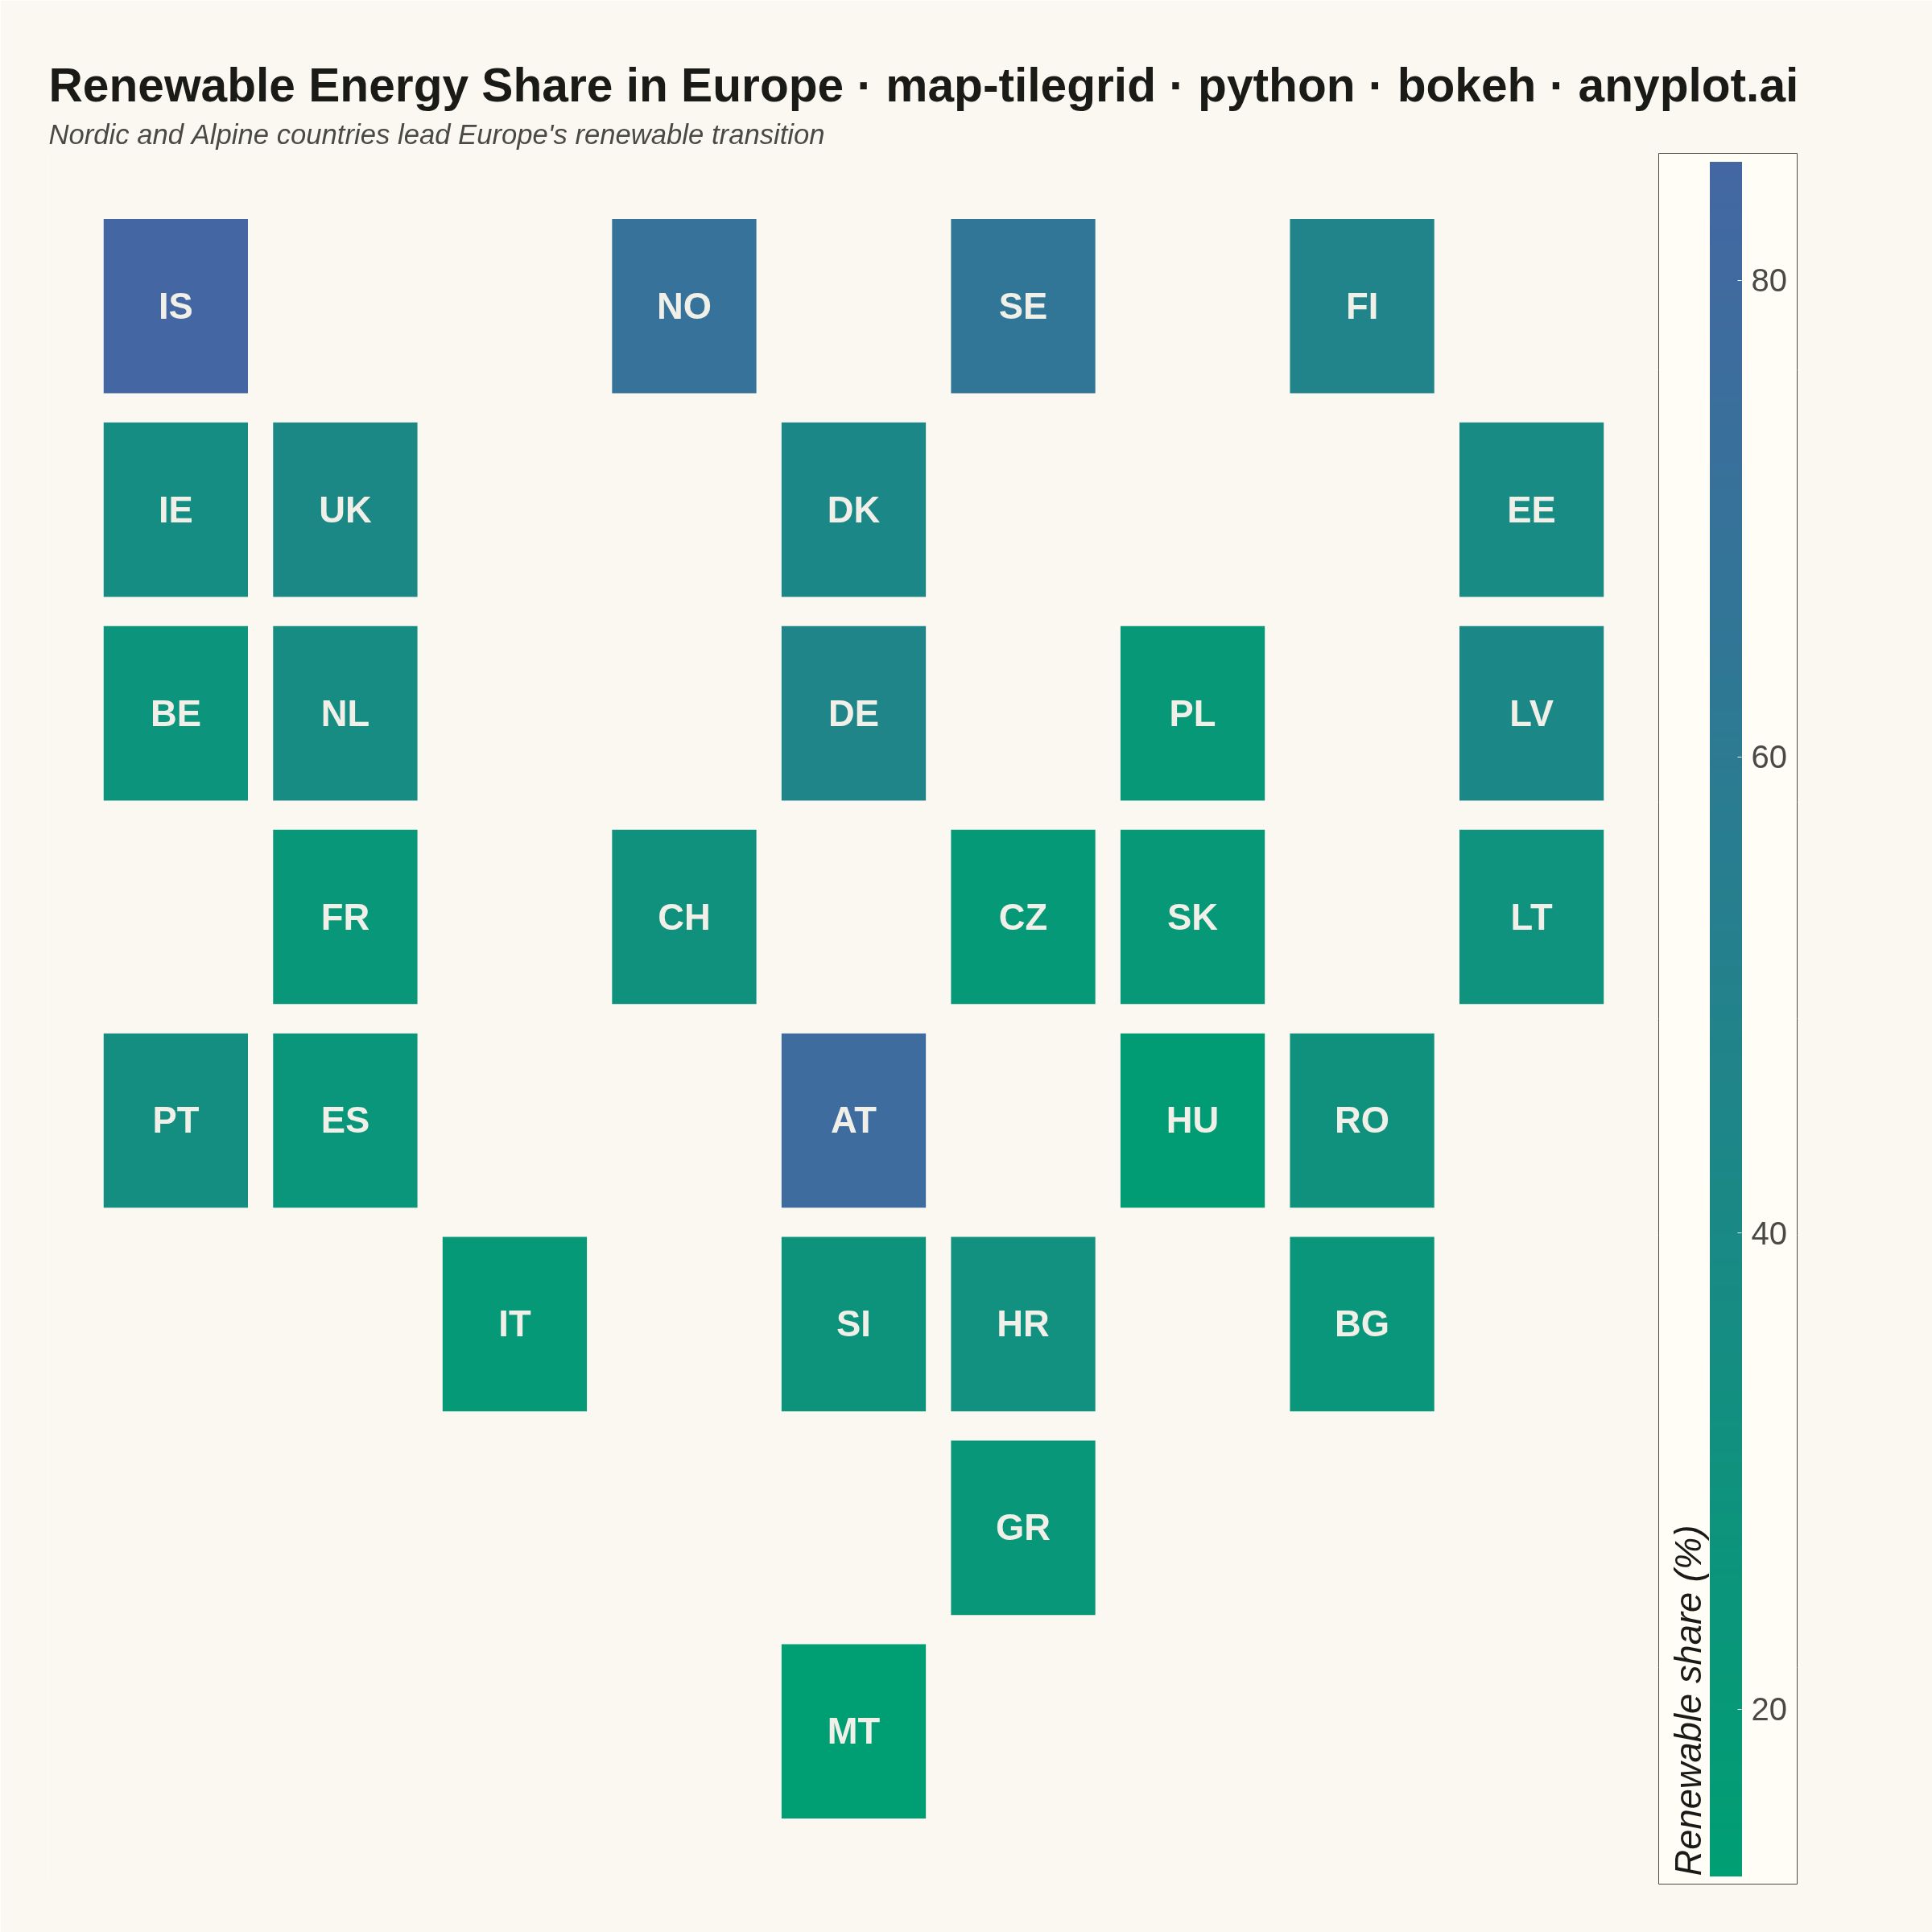
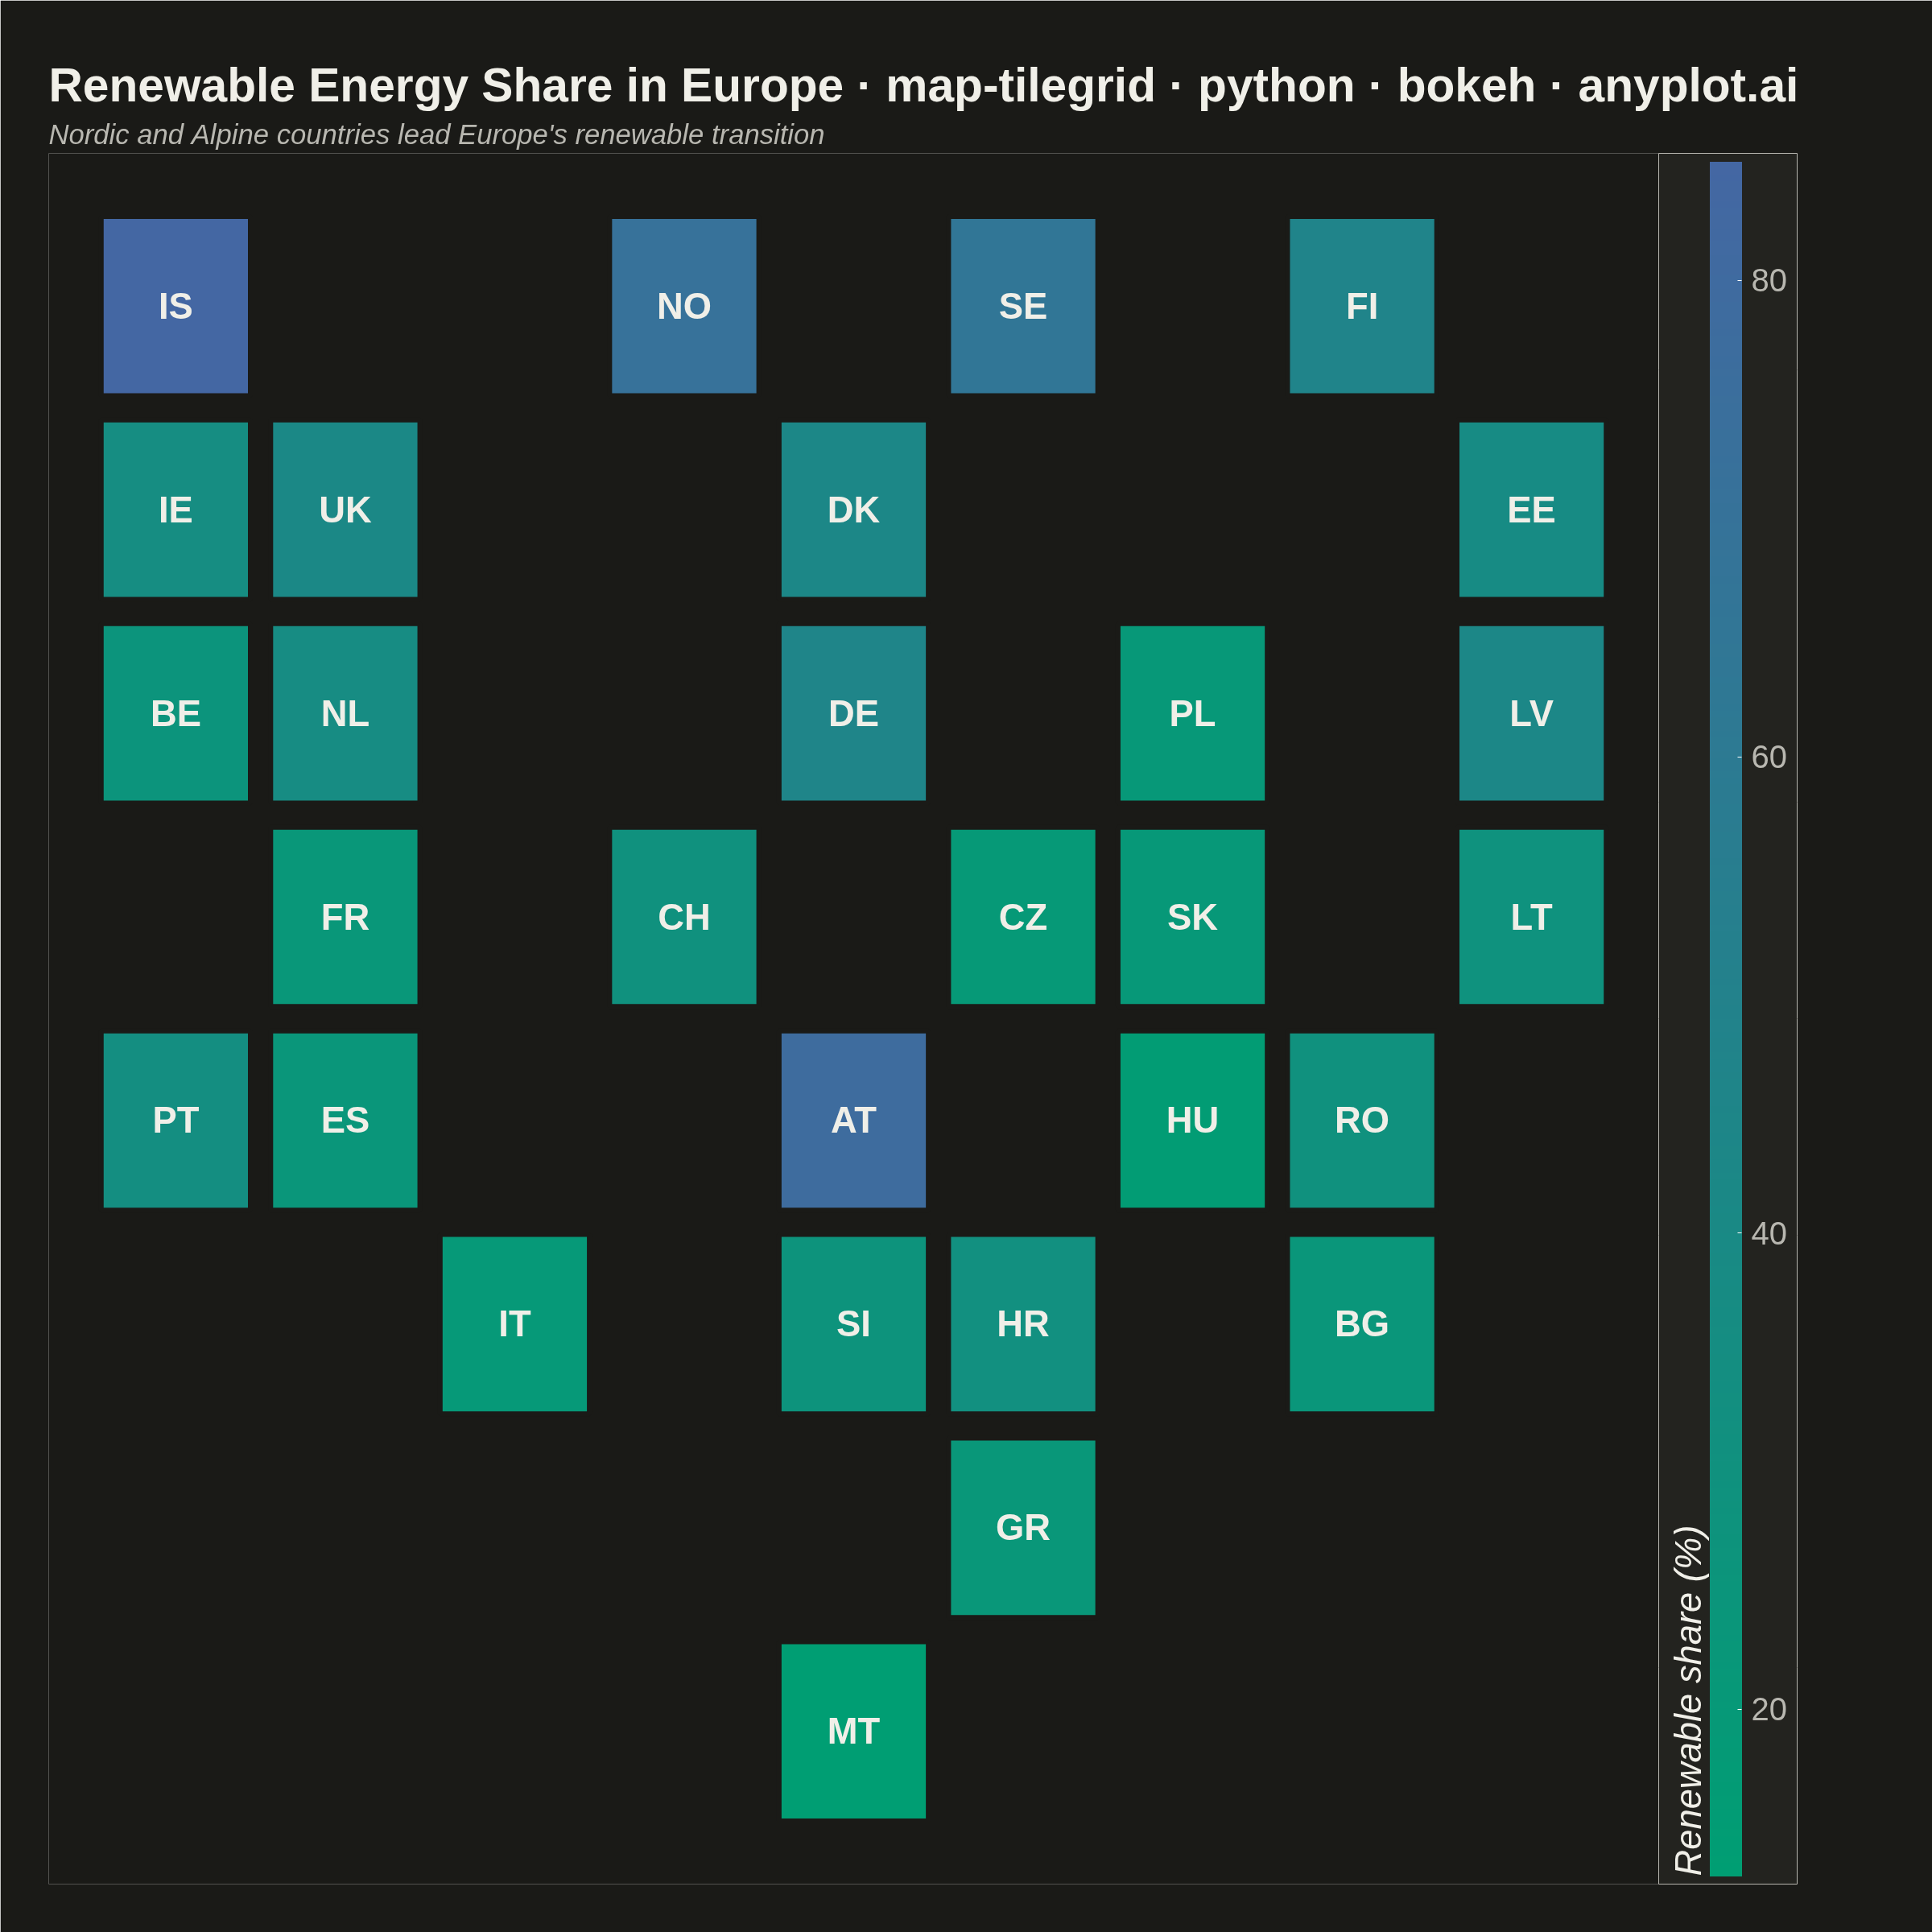
A tile grid map represents geographic regions (states, countries, provinces) as equally-sized tiles — squares or hexagons — arranged to approximate their real-world geographic positions. Unlike choropleth maps where large-area regions dominate visually, every region receives identical visual weight, making tile grid maps ideal for per-capita or per-region comparisons where the statistic matters more than physical area. Tiles are colored by a data variable and labeled with region abbreviations for identification.
""" anyplot.ai
map-tilegrid: Tile Grid Map for Equal-Area Geographic Comparison
Library: bokeh 3.10.0 | Python 3.13.15
Quality: 95/100 | Created: 2026-08-24
"""

import os
import time
from pathlib import Path

from bokeh.io import output_file, save
from bokeh.models import (
    BasicTicker,
    ColorBar,
    ColumnDataSource,
    HoverTool,
    LinearColorMapper,
    NumeralTickFormatter,
    Range1d,
    Title,
)
from bokeh.plotting import figure
from selenium import webdriver
from selenium.webdriver.chrome.options import Options


# Theme tokens (see prompts/default-style-guide.md "Theme-adaptive Chrome")
THEME = os.getenv("ANYPLOT_THEME", "light")
PAGE_BG = "#FAF8F1" if THEME == "light" else "#1A1A17"
ELEVATED_BG = "#FFFDF6" if THEME == "light" else "#242420"
INK = "#1A1A17" if THEME == "light" else "#F0EFE8"
INK_SOFT = "#4A4A44" if THEME == "light" else "#B8B7B0"
LABEL_LIGHT = "#F0EFE8"

# Data — renewable energy share of European countries, tile positions
# approximate each country's real-world location (row 0 = north, col 0 = west)
countries = [
    {"code": "IS", "row": 0, "col": 0, "value": 85},
    {"code": "NO", "row": 0, "col": 3, "value": 71},
    {"code": "SE", "row": 0, "col": 5, "value": 65},
    {"code": "FI", "row": 0, "col": 7, "value": 47},
    {"code": "IE", "row": 1, "col": 0, "value": 36},
    {"code": "UK", "row": 1, "col": 1, "value": 42},
    {"code": "DK", "row": 1, "col": 4, "value": 43},
    {"code": "EE", "row": 1, "col": 8, "value": 38},
    {"code": "BE", "row": 2, "col": 0, "value": 26},
    {"code": "NL", "row": 2, "col": 1, "value": 37},
    {"code": "DE", "row": 2, "col": 4, "value": 46},
    {"code": "PL", "row": 2, "col": 6, "value": 21},
    {"code": "LV", "row": 2, "col": 8, "value": 43},
    {"code": "FR", "row": 3, "col": 1, "value": 22},
    {"code": "CH", "row": 3, "col": 3, "value": 30},
    {"code": "CZ", "row": 3, "col": 5, "value": 19},
    {"code": "SK", "row": 3, "col": 6, "value": 21},
    {"code": "LT", "row": 3, "col": 8, "value": 29},
    {"code": "PT", "row": 4, "col": 0, "value": 34},
    {"code": "ES", "row": 4, "col": 1, "value": 24},
    {"code": "AT", "row": 4, "col": 4, "value": 78},
    {"code": "HU", "row": 4, "col": 6, "value": 15},
    {"code": "RO", "row": 4, "col": 7, "value": 30},
    {"code": "IT", "row": 5, "col": 2, "value": 20},
    {"code": "SI", "row": 5, "col": 4, "value": 27},
    {"code": "HR", "row": 5, "col": 5, "value": 32},
    {"code": "BG", "row": 5, "col": 7, "value": 24},
    {"code": "GR", "row": 6, "col": 5, "value": 22},
    {"code": "MT", "row": 7, "col": 4, "value": 13},
]
num_rows = max(c["row"] for c in countries) + 1
max_col = max(c["col"] for c in countries)

COUNTRY_NAMES = {
    "IS": "Iceland", "NO": "Norway", "SE": "Sweden", "FI": "Finland",
    "IE": "Ireland", "UK": "United Kingdom", "DK": "Denmark", "EE": "Estonia",
    "BE": "Belgium", "NL": "Netherlands", "DE": "Germany", "PL": "Poland",
    "LV": "Latvia", "FR": "France", "CH": "Switzerland", "CZ": "Czechia",
    "SK": "Slovakia", "LT": "Lithuania", "PT": "Portugal", "ES": "Spain",
    "AT": "Austria", "HU": "Hungary", "RO": "Romania", "IT": "Italy",
    "SI": "Slovenia", "HR": "Croatia", "BG": "Bulgaria", "GR": "Greece",
    "MT": "Malta",
}  # fmt: skip


def _lerp_hex(c0, c1, t):
    r0, g0, b0 = (int(c0[i : i + 2], 16) for i in (1, 3, 5))
    r1, g1, b1 = (int(c1[i : i + 2], 16) for i in (1, 3, 5))
    r, g, b = (int(round(a + (b - a) * t)) for a, b in ((r0, r1), (g0, g1), (b0, b1)))
    return f"#{r:02X}{g:02X}{b:02X}"


def _luminance(hex_color):
    r, g, b = (int(hex_color[i : i + 2], 16) / 255 for i in (1, 3, 5))
    return 0.2126 * r + 0.7152 * g + 0.0722 * b


# Continuous Imprint colormap — unipolar data (renewable share, no midpoint)
ANYPLOT_SEQ256 = [_lerp_hex("#009E73", "#4467A3", t / 255.0) for t in range(256)]
low = min(c["value"] for c in countries)
high = max(c["value"] for c in countries)

xs, ys, values, codes, names, label_colors = [], [], [], [], [], []
for c in countries:
    xs.append(c["col"])
    ys.append(num_rows - 1 - c["row"])  # flip so row 0 (north) renders at top
    values.append(c["value"])
    codes.append(c["code"])
    names.append(COUNTRY_NAMES[c["code"]])
    t = (c["value"] - low) / (high - low)
    tile_color = ANYPLOT_SEQ256[min(255, int(round(t * 255)))]
    label_colors.append(INK if _luminance(tile_color) > 0.55 else LABEL_LIGHT)

source = ColumnDataSource(
    data={"x": xs, "y": ys, "value": values, "code": codes, "name": names, "label_color": label_colors}
)
mapper = LinearColorMapper(palette=ANYPLOT_SEQ256, low=low, high=high)

# Title — compute fontsize per the length-scaling formula (default 50pt / floor 34pt)
title = "Renewable Energy Share in Europe · map-tilegrid · python · bokeh · anyplot.ai"
n = len(title)
ratio = 67 / n if n > 67 else 1.0
title_font_size = f"{max(34, round(50 * ratio))}pt"

# Plot
p = figure(
    width=2400,
    height=2400,
    title=title,
    toolbar_location=None,  # bokeh's default toolbar shrinks the PNG below `height=`
    x_range=Range1d(-0.75, max_col + 0.75),
    y_range=Range1d(-0.75, num_rows - 1 + 0.75),
    match_aspect=True,
    min_border_top=190,
    min_border_bottom=60,
    min_border_left=60,
    min_border_right=340,
)
tile_renderer = p.rect(
    x="x",
    y="y",
    width=0.88,
    height=0.88,
    source=source,
    fill_color={"field": "value", "transform": mapper},
    line_color=PAGE_BG,
    line_width=6,
)
hover = HoverTool(renderers=[tile_renderer], tooltips=[("Country", "@name"), ("Renewable share", "@value{0}%")])
p.add_tools(hover)
p.text(
    x="x",
    y="y",
    text="code",
    source=source,
    text_align="center",
    text_baseline="middle",
    text_font_size="34pt",
    text_font_style="bold",
    text_color="label_color",
)

# Colorbar
color_bar = ColorBar(
    color_mapper=mapper,
    ticker=BasicTicker(desired_num_ticks=5),
    formatter=NumeralTickFormatter(format="0"),
    title="Renewable share (%)",
    title_text_font_size="34pt",
    title_text_color=INK,
    major_label_text_font_size="30pt",
    major_label_text_color=INK_SOFT,
    background_fill_color=ELEVATED_BG,
    border_line_color=INK_SOFT,
    label_standoff=12,
    width=40,
    location=(0, 0),
)
p.add_layout(color_bar, "right")

# Style — theme-adaptive chrome; no axes for a schematic tile grid
p.title.text_font_size = title_font_size
p.title.text_color = INK

# Subtitle callout — sharpens the color-gradient insight into an explicit takeaway
p.add_layout(
    Title(
        text="Nordic and Alpine countries lead Europe's renewable transition",
        text_font_size="26pt",
        text_font_style="italic",
        text_color=INK_SOFT,
    ),
    "above",
)

p.background_fill_color = PAGE_BG
p.border_fill_color = PAGE_BG
p.outline_line_color = None
p.axis.visible = False
p.grid.visible = False

# Save (HTML + PNG via headless Chrome — see prompts/library/bokeh.md)
output_file(f"plot-{THEME}.html")
save(p)

W, H = 2400, 2400
opts = Options()
for arg in (
    "--headless=new",
    "--no-sandbox",
    "--disable-dev-shm-usage",
    "--disable-gpu",
    f"--window-size={W},{H}",
    "--hide-scrollbars",
):
    opts.add_argument(arg)
driver = webdriver.Chrome(options=opts)
driver.set_window_size(W, H)
driver.get(f"file://{Path(f'plot-{THEME}.html').resolve()}")
driver.execute_cdp_cmd(
    "Emulation.setDeviceMetricsOverride", {"width": W, "height": H, "deviceScaleFactor": 1, "mobile": False}
)
time.sleep(3)
driver.save_screenshot(f"plot-{THEME}.png")
driver.quit()
Runnable source as JSON, for any HTTP client: https://api.anyplot.ai/specs/map-tilegrid/bokeh/code. Any spec id and library id listed in llms-full.txt fit the same URL shape; every URL below is complete and callable.
{
  "spec_id": "map-tilegrid",
  "language": "python",
  "library": "bokeh",
  "page": "https://anyplot.ai/map-tilegrid/python/bokeh",
  "hub": "https://anyplot.ai/map-tilegrid",
  "code_json": "https://api.anyplot.ai/specs/map-tilegrid/bokeh/code",
  "spec_json": "https://api.anyplot.ai/specs/map-tilegrid",
  "render_light_png": "https://storage.googleapis.com/anyplot-images/plots/map-tilegrid/python/bokeh/plot-light.png",
  "render_dark_png": "https://storage.googleapis.com/anyplot-images/plots/map-tilegrid/python/bokeh/plot-dark.png",
  "interactive_light_html": "https://storage.googleapis.com/anyplot-images/plots/map-tilegrid/python/bokeh/plot-light.html",
  "interactive_dark_html": "https://storage.googleapis.com/anyplot-images/plots/map-tilegrid/python/bokeh/plot-dark.html",
  "quality_score": 95.0,
  "license": "MIT",
  "guide": "https://anyplot.ai/llms.txt"
}
Part of Tile Grid Map for Equal-Area Geographic Comparison on anyplot.ai.