The same plot in 14 other libraries — Python: Altair, Bokeh, lets-plot, Matplotlib, Plotly, plotnine, Pygal, Seaborn; R: ggplot2; JavaScript: Chart.js, D3.js, Apache ECharts, Highcharts, MUI X Charts. Compare all 15 side by side: Tile Grid Map for Equal-Area Geographic Comparison in Python, R, Julia and JavaScript.
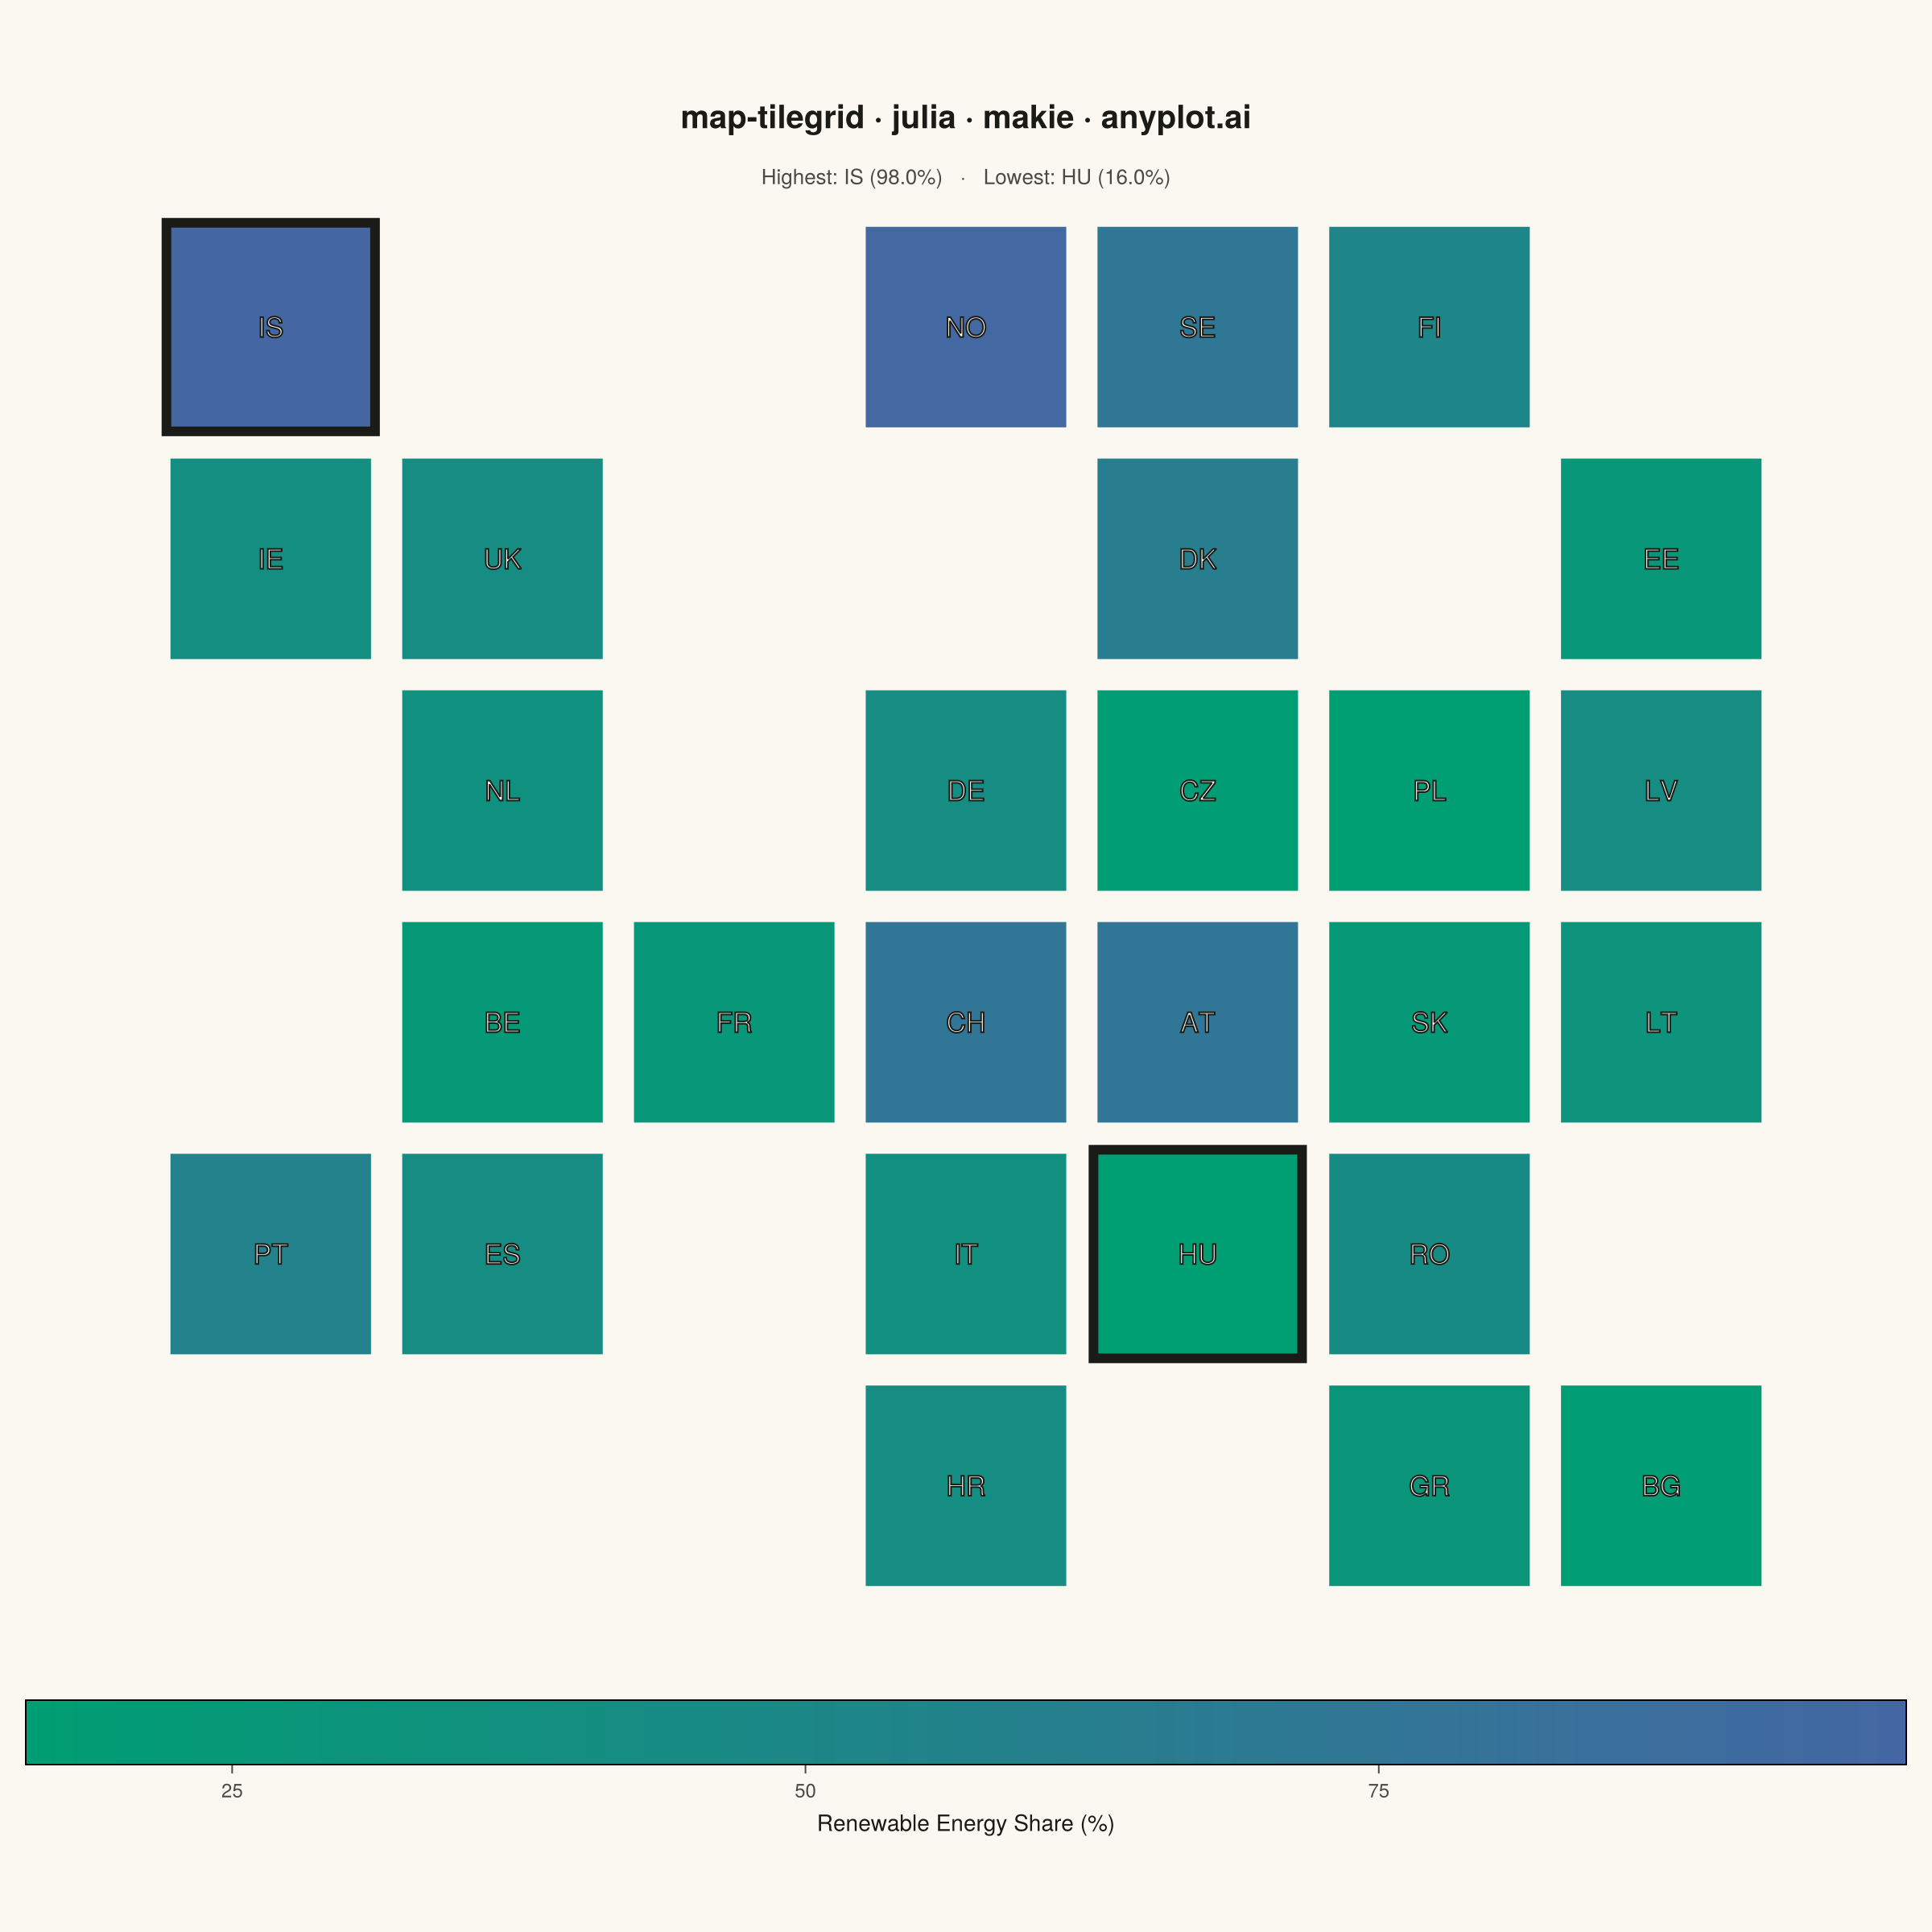
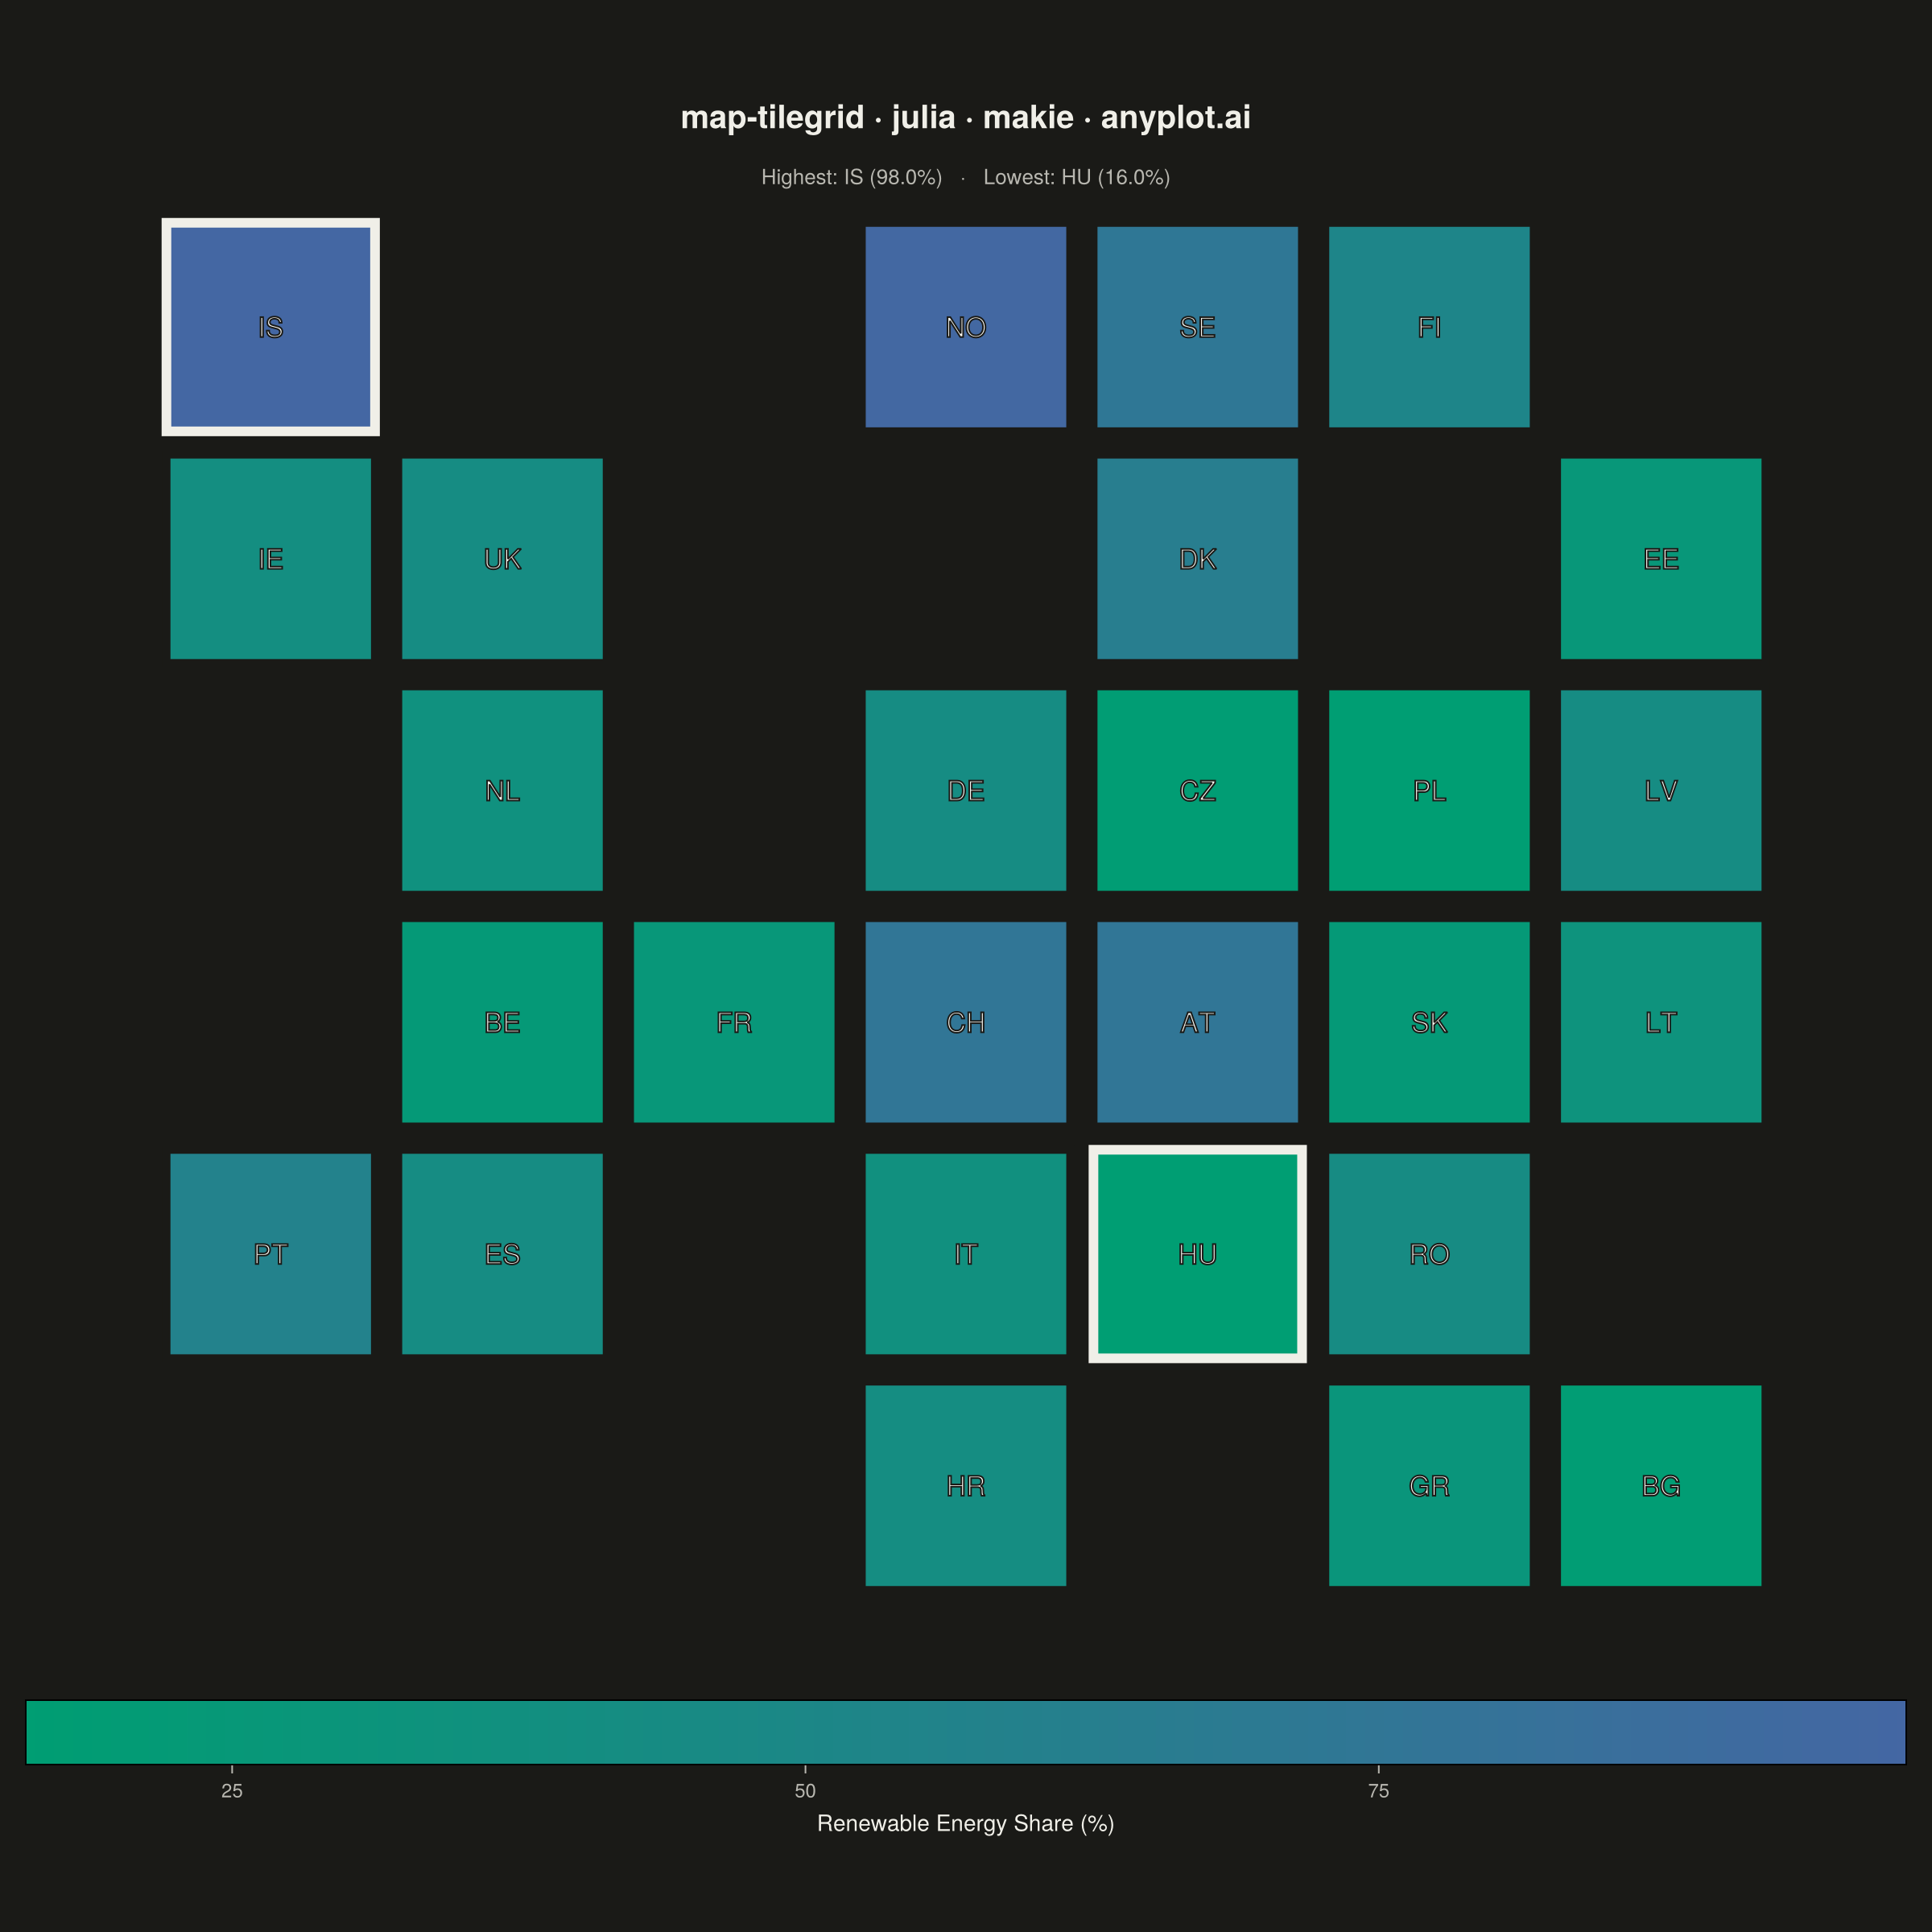
A tile grid map represents geographic regions (states, countries, provinces) as equally-sized tiles — squares or hexagons — arranged to approximate their real-world geographic positions. Unlike choropleth maps where large-area regions dominate visually, every region receives identical visual weight, making tile grid maps ideal for per-capita or per-region comparisons where the statistic matters more than physical area. Tiles are colored by a data variable and labeled with region abbreviations for identification.
# anyplot.ai
# map-tilegrid: Tile Grid Map for Equal-Area Geographic Comparison
# Library: makie 0.21.9 | Julia 1.11.9
# Quality: 91/100 | Created: 2026-09-05

using CairoMakie
using ColorSchemes
using Colors
using Random

Random.seed!(42)

# --- Theme tokens ------------------------------------------------------------
const THEME    = get(ENV, "ANYPLOT_THEME", "light")
const PAGE_BG  = THEME == "light" ? colorant"#FAF8F1" : colorant"#1A1A17"
const INK      = THEME == "light" ? colorant"#1A1A17" : colorant"#F0EFE8"
const INK_SOFT = THEME == "light" ? colorant"#4A4A44" : colorant"#B8B7B0"

# Continuous, single-polarity metric (share of electricity, %) -> imprint_seq
const ANYPLOT_SEQ = cgrad([colorant"#009E73", colorant"#4467A3"])
const TILE_LABEL  = colorant"#FAF8F1"  # constant across themes: sits on data color, not page bg
const TILE_OUTLINE = colorant"#1A1A17"  # constant across themes: text outline for legibility

# --- Data ----------------------------------------------------------------
# European countries laid out on an equal-area tile grid, approximating true
# geographic position (row 0 = north, col 0 = west). Renewable electricity
# share is a unipolar metric, so it uses the sequential Imprint colormap.
codes = [
    "IS", "NO", "SE", "FI",
    "IE", "UK", "DK", "EE",
    "NL", "DE", "CZ", "PL", "LV",
    "BE", "FR", "CH", "AT", "SK", "LT",
    "PT", "ES", "IT", "HU", "RO",
    "HR", "GR", "BG",
]
rows = [
    0, 0, 0, 0,
    1, 1, 1, 1,
    2, 2, 2, 2, 2,
    3, 3, 3, 3, 3, 3,
    4, 4, 4, 4, 4,
    5, 5, 5,
]
cols = [
    0, 3, 4, 5,
    0, 1, 4, 6,
    1, 3, 4, 5, 6,
    1, 2, 3, 4, 5, 6,
    0, 1, 3, 4, 5,
    3, 5, 6,
]
base_renewable_pct = [
    100.0, 98.0, 75.0, 55.0,
    40.0, 43.0, 65.0, 25.0,
    33.0, 46.0, 18.0, 17.0, 45.0,
    25.0, 27.0, 75.0, 78.0, 20.0, 30.0,
    61.0, 42.0, 35.0, 15.0, 42.0,
    40.0, 30.0, 20.0,
]
renewable_pct = clamp.(
    round.(base_renewable_pct .+ (rand(length(base_renewable_pct)) .- 0.5) .* 6, digits=1),
    0.0, 100.0,
)

n_cols = maximum(cols) + 1
n_rows = maximum(rows) + 1
value_min, value_max = extrema(renewable_pct)
norm_values = (renewable_pct .- value_min) ./ (value_max - value_min)
tile_colors = [get(ANYPLOT_SEQ, t) for t in norm_values]

tile_gap = 0.05
tile_rects = [
    Rect2f(c + tile_gap, -(r + 1 - tile_gap), 1 - 2tile_gap, 1 - 2tile_gap)
    for (r, c) in zip(rows, cols)
]
label_positions = [Point2f(c + 0.5, -(r + 0.5)) for (r, c) in zip(rows, cols)]

# Highlight the highest/lowest performers to give the color gradient an
# explicit focal point, rather than relying on the gradient alone.
max_idx = argmax(renewable_pct)
min_idx = argmin(renewable_pct)
stroke_colors = fill(PAGE_BG, length(tile_rects))
stroke_widths = fill(5.0, length(tile_rects))
stroke_colors[max_idx] = INK
stroke_colors[min_idx] = INK
stroke_widths[max_idx] = 6.0
stroke_widths[min_idx] = 6.0

# --- Plot ----------------------------------------------------------------
fig = Figure(
    size            = (1200, 1200),
    fontsize        = 14,
    backgroundcolor = PAGE_BG,
)

ax = Axis(
    fig[1, 1];
    title           = "map-tilegrid · julia · makie · anyplot.ai",
    titlesize       = 20,
    titlecolor      = INK,
    backgroundcolor = PAGE_BG,
    aspect          = DataAspect(),
)
hidedecorations!(ax)
hidespines!(ax)
xlims!(ax, -0.3, n_cols + 0.3)
ylims!(ax, -(n_rows + 0.3), 0.3)

poly!(ax, tile_rects; color = tile_colors, strokecolor = stroke_colors, strokewidth = stroke_widths)
text!(
    ax, label_positions;
    text        = codes,
    align       = (:center, :center),
    fontsize    = 17,
    color       = TILE_LABEL,
    strokecolor = TILE_OUTLINE,
    strokewidth = 1,
)
text!(
    ax, Point2f(n_cols / 2, 0.15);
    text     = "Highest: $(codes[max_idx]) ($(renewable_pct[max_idx])%)   ·   Lowest: $(codes[min_idx]) ($(renewable_pct[min_idx])%)",
    align    = (:center, :center),
    fontsize = 13,
    color    = INK_SOFT,
)

Colorbar(
    fig[2, 1];
    colormap      = ANYPLOT_SEQ,
    limits        = (value_min, value_max),
    vertical      = false,
    flipaxis      = false,
    label         = "Renewable Energy Share (%)",
    labelcolor    = INK,
    labelsize     = 14,
    ticklabelsize = 12,
    ticklabelcolor = INK_SOFT,
    tickcolor     = INK_SOFT,
    height        = 40,
)
rowsize!(fig.layout, 1, Relative(0.88))
rowgap!(fig.layout, 18)

# --- Save ------------------------------------------------------------------
save("plot-$(THEME).png", fig; px_per_unit = 2)
Runnable source as JSON, for any HTTP client: https://api.anyplot.ai/specs/map-tilegrid/makie/code. Any spec id and library id listed in llms-full.txt fit the same URL shape; every URL below is complete and callable.
{
  "spec_id": "map-tilegrid",
  "language": "julia",
  "library": "makie",
  "page": "https://anyplot.ai/map-tilegrid/julia/makie",
  "hub": "https://anyplot.ai/map-tilegrid",
  "code_json": "https://api.anyplot.ai/specs/map-tilegrid/makie/code",
  "spec_json": "https://api.anyplot.ai/specs/map-tilegrid",
  "render_light_png": "https://storage.googleapis.com/anyplot-images/plots/map-tilegrid/julia/makie/plot-light.png",
  "render_dark_png": "https://storage.googleapis.com/anyplot-images/plots/map-tilegrid/julia/makie/plot-dark.png",
  "quality_score": 91.0,
  "license": "MIT",
  "guide": "https://anyplot.ai/llms.txt"
}
Part of Tile Grid Map for Equal-Area Geographic Comparison on anyplot.ai.