The same plot in 14 other libraries — JavaScript: Chart.js, D3.js, Apache ECharts, Highcharts; Python: Altair, Bokeh, lets-plot, Matplotlib, Plotly, plotnine, Pygal, Seaborn; R: ggplot2; Julia: Makie.jl. Compare all 15 side by side: Tile Grid Map for Equal-Area Geographic Comparison in Python, R, Julia and JavaScript.
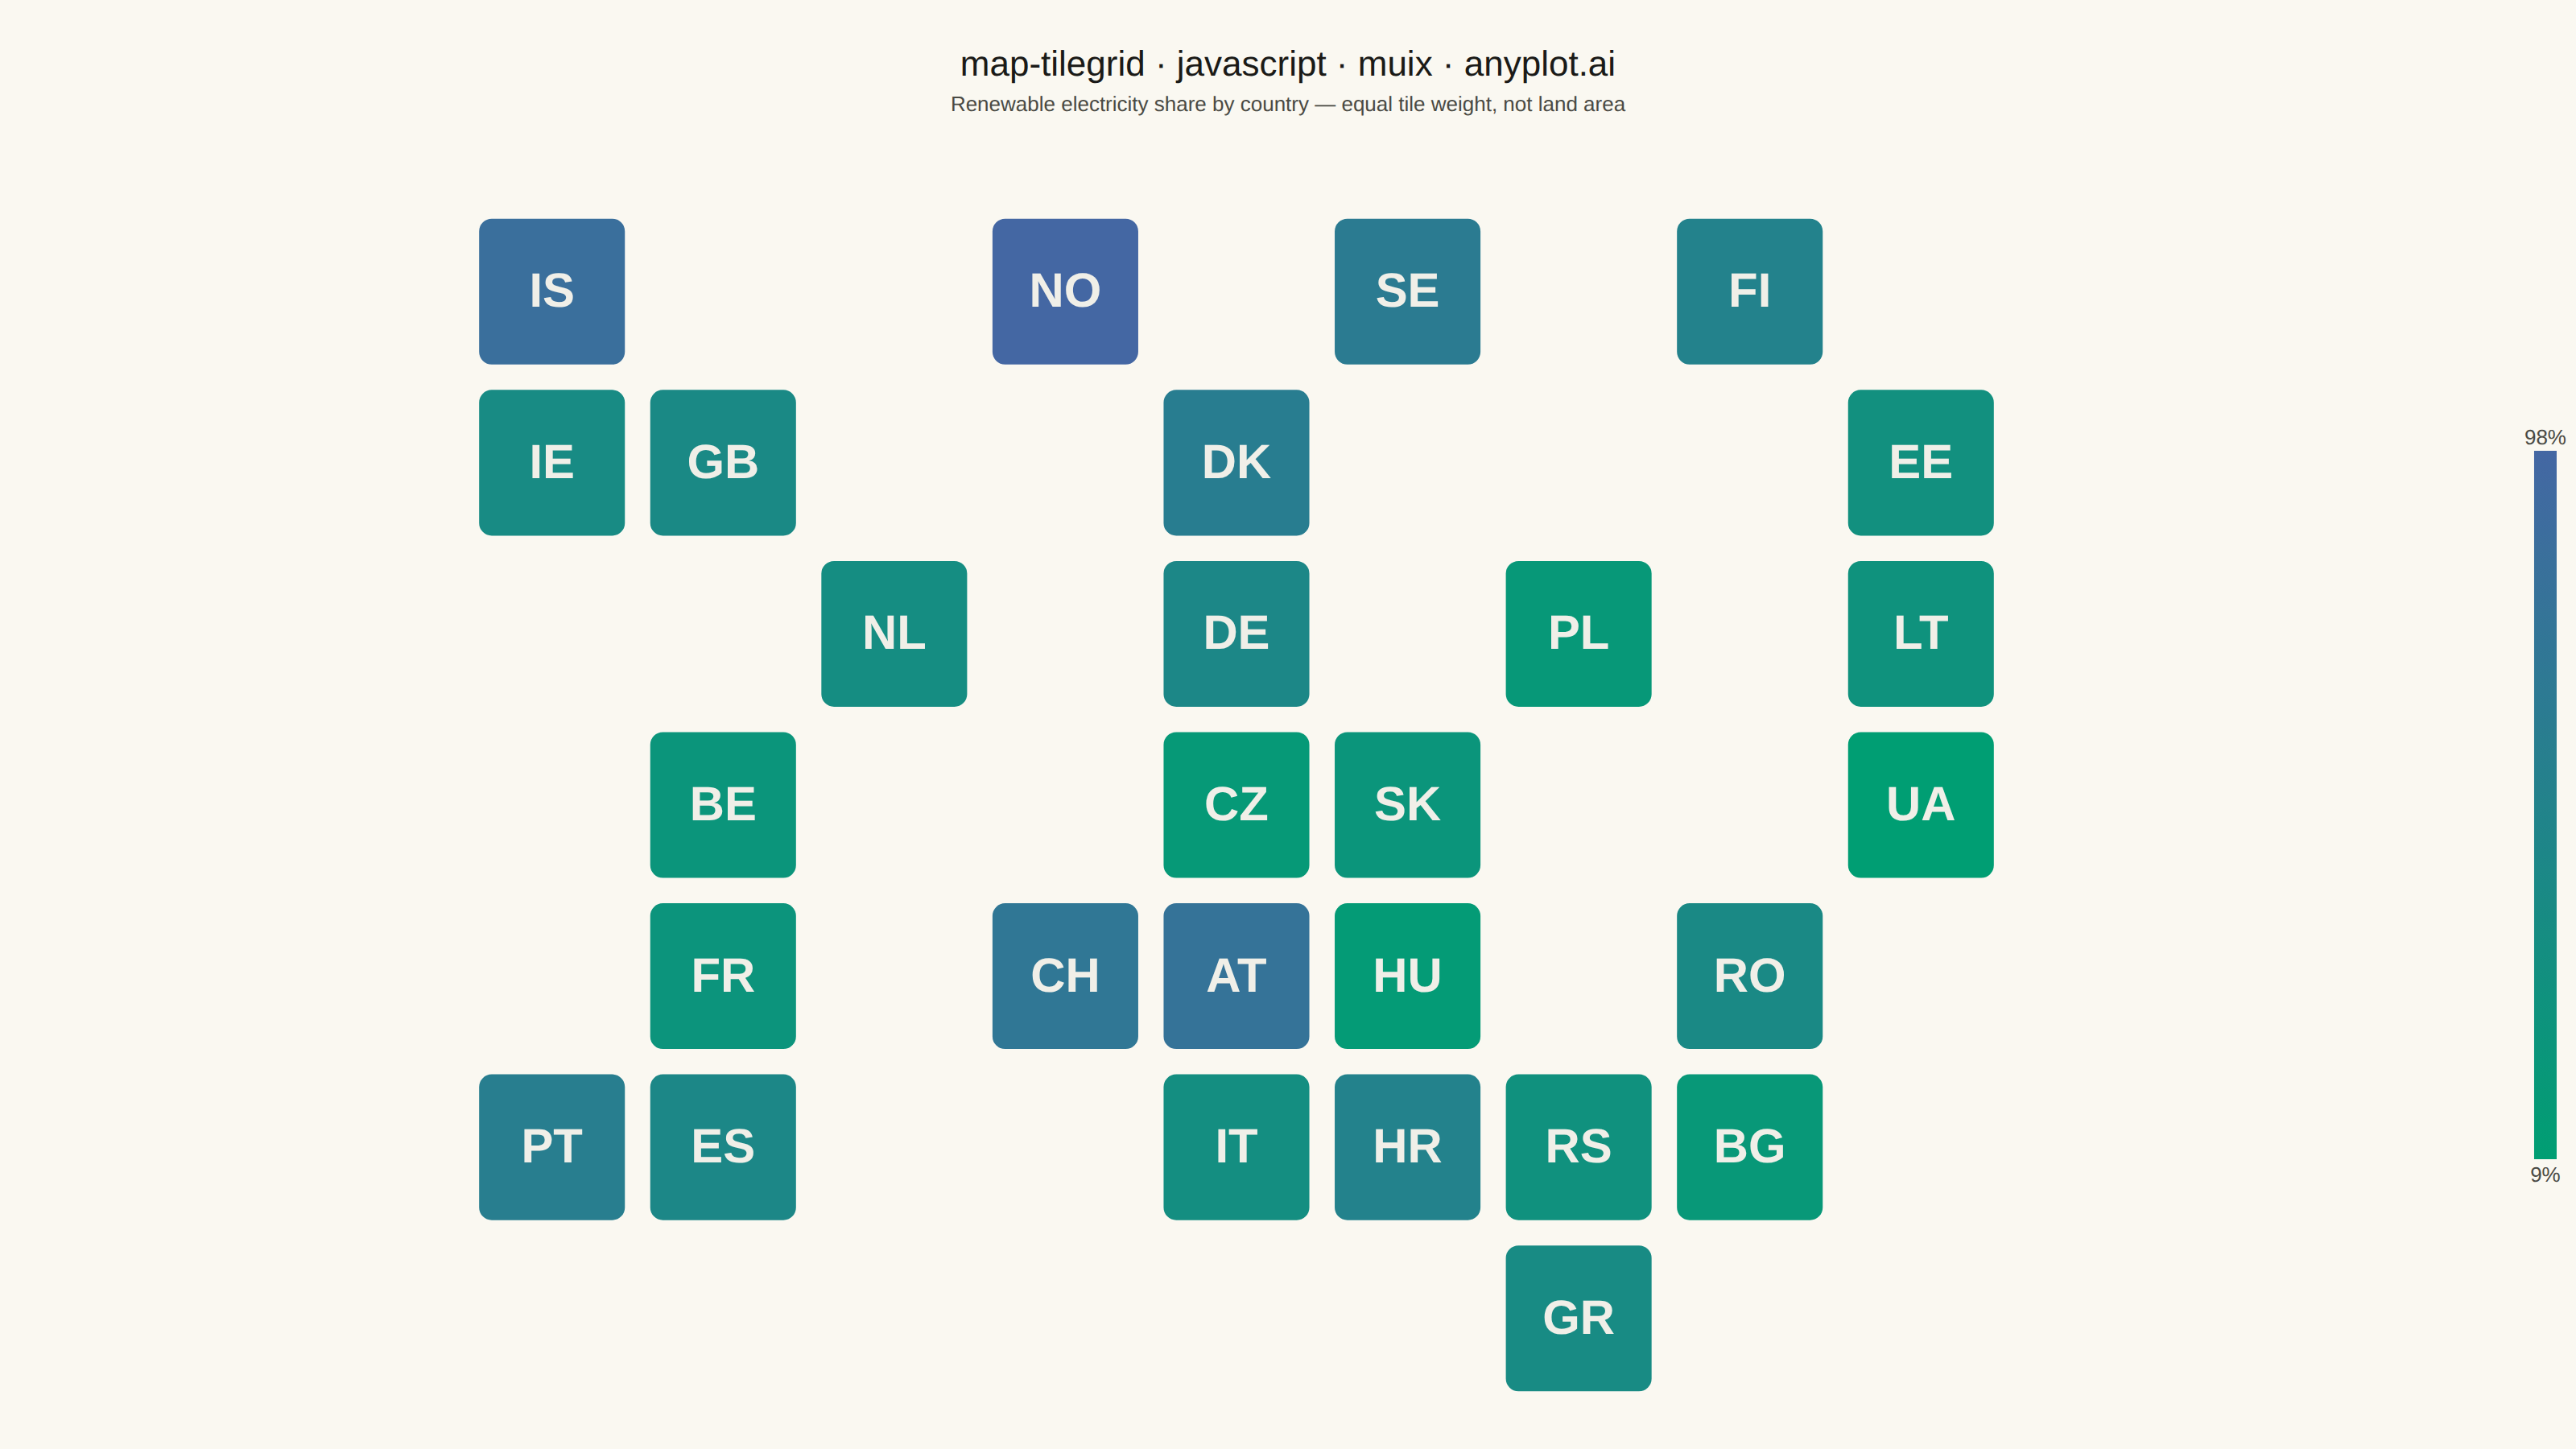
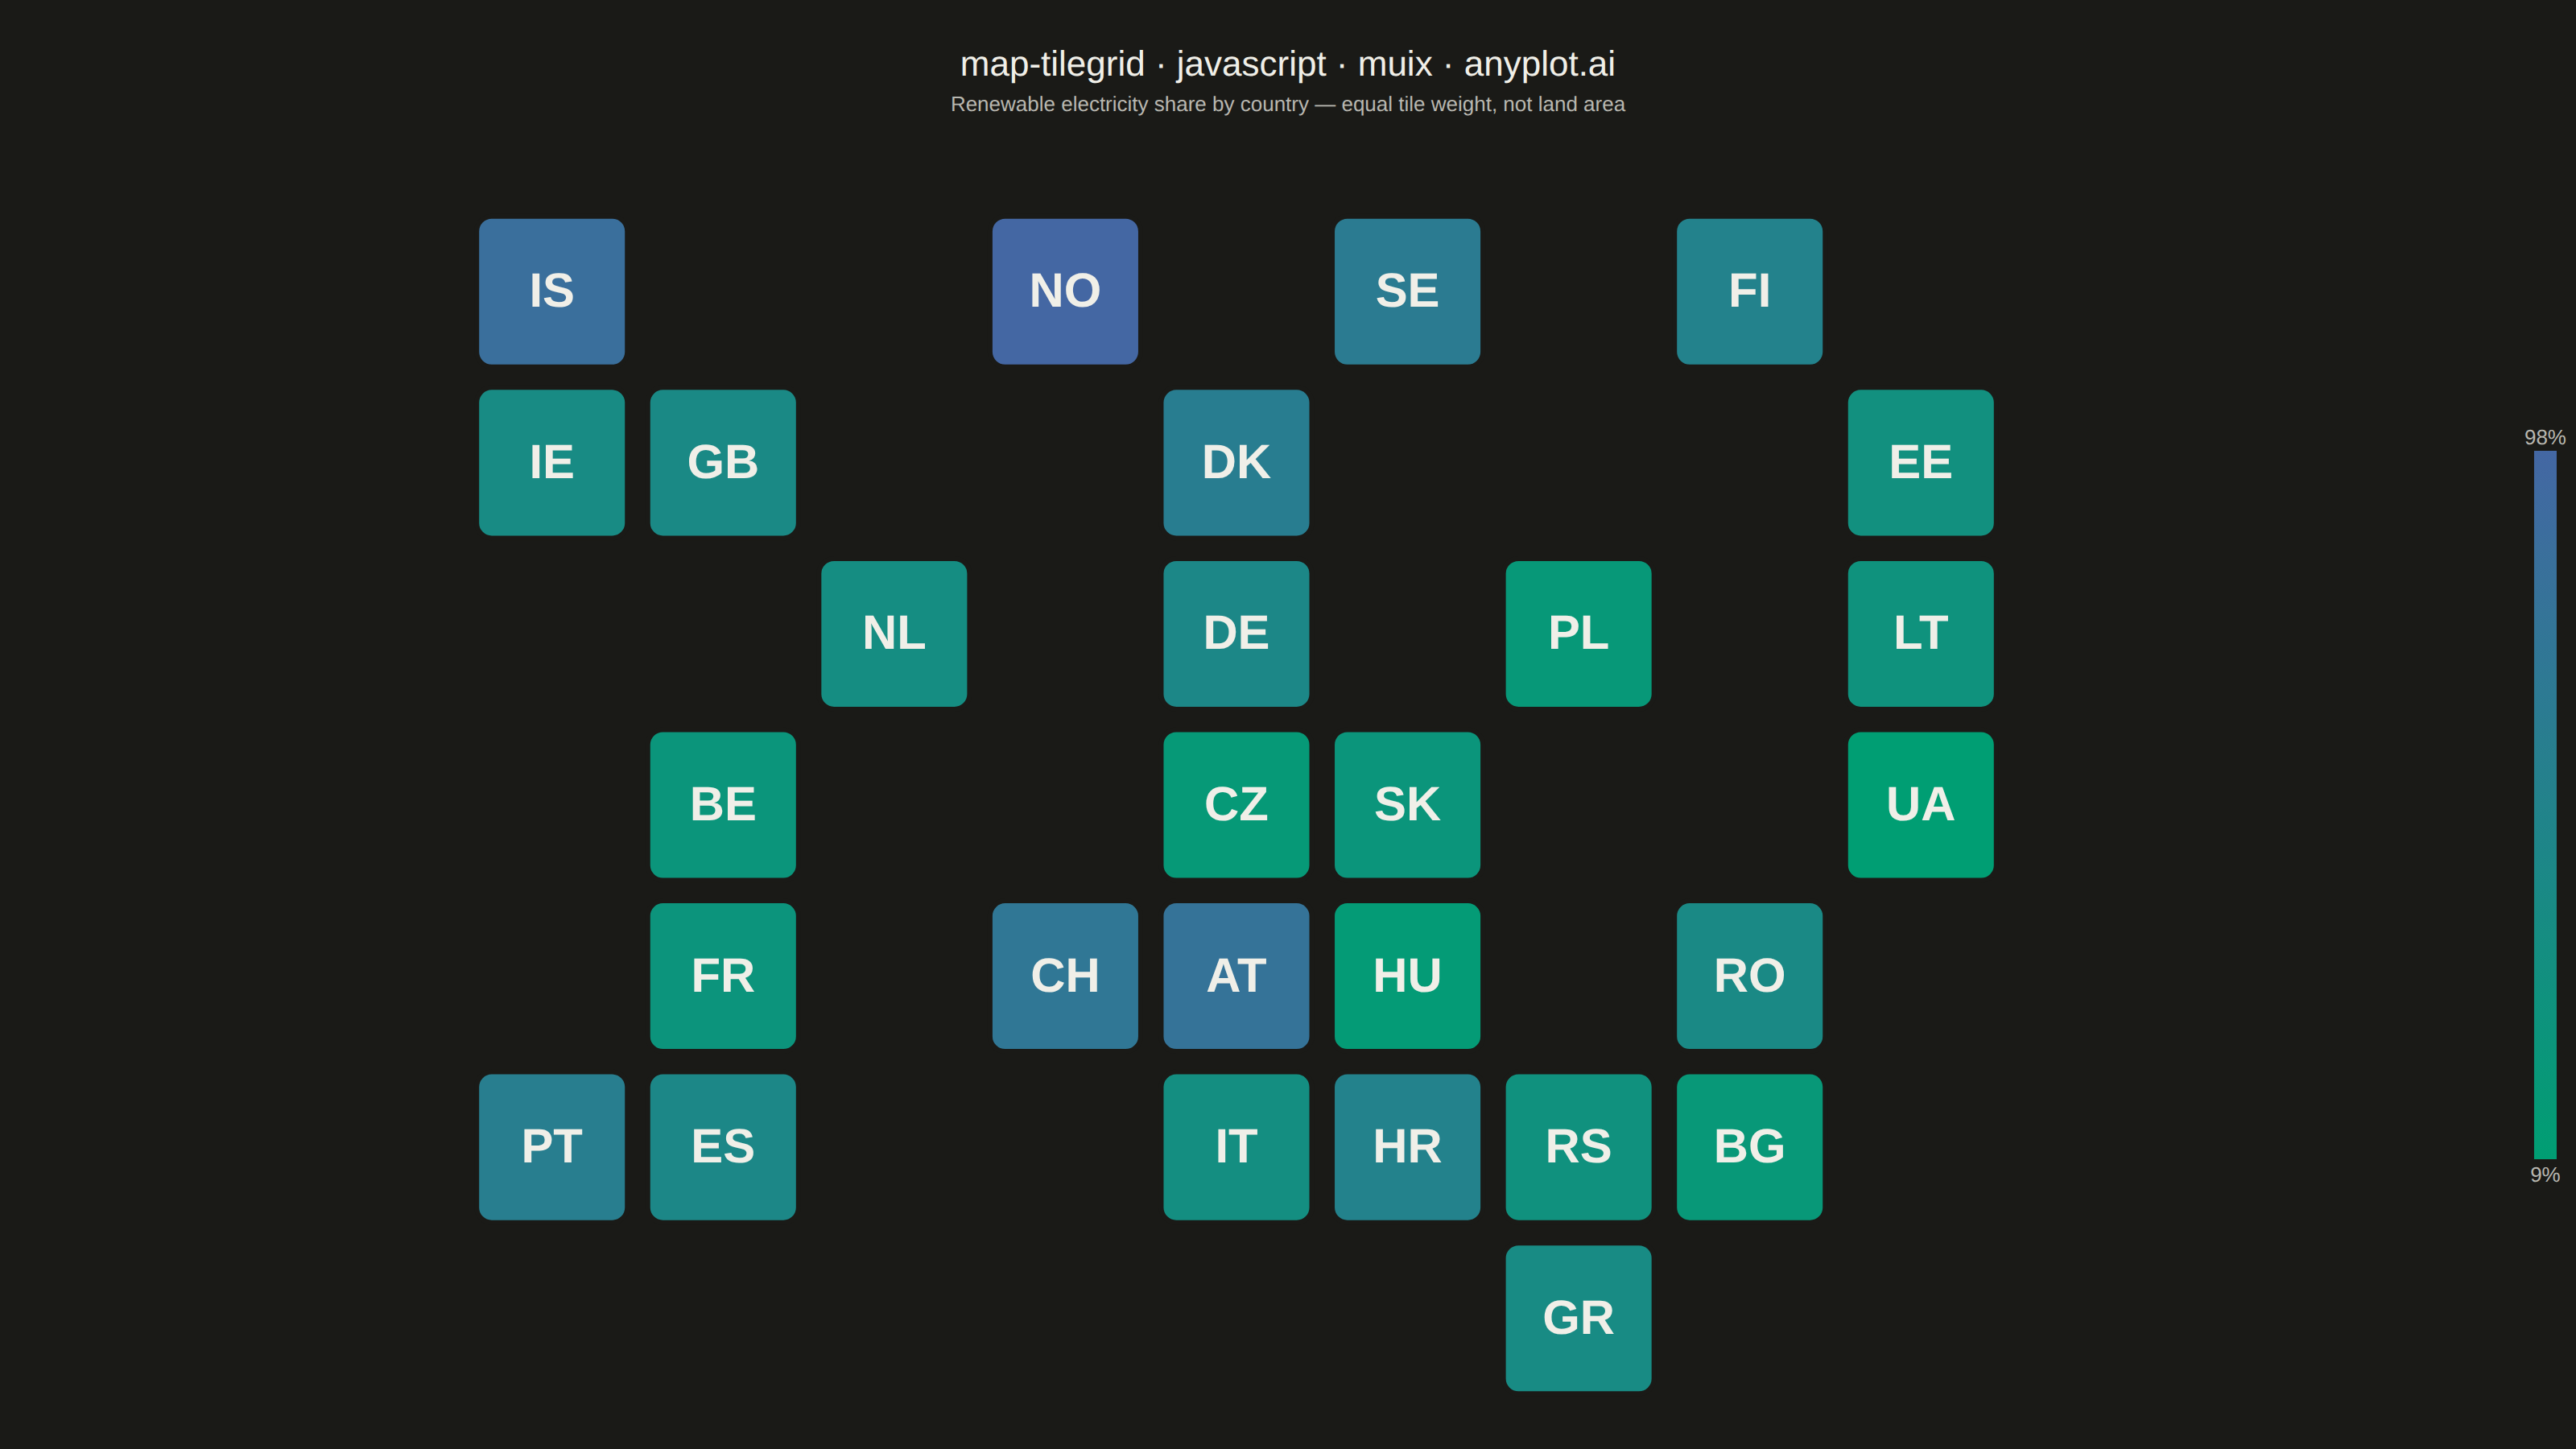
A tile grid map represents geographic regions (states, countries, provinces) as equally-sized tiles — squares or hexagons — arranged to approximate their real-world geographic positions. Unlike choropleth maps where large-area regions dominate visually, every region receives identical visual weight, making tile grid maps ideal for per-capita or per-region comparisons where the statistic matters more than physical area. Tiles are colored by a data variable and labeled with region abbreviations for identification.
// anyplot.ai
// map-tilegrid: Tile Grid Map for Equal-Area Geographic Comparison
// Library: muix 7.29.1 | JavaScript 22.23.2
// Quality: 93/100 | Created: 2026-09-05

import Box from "@mui/material/Box";
import Typography from "@mui/material/Typography";
import { ScatterChart } from "@mui/x-charts/ScatterChart";
import { ContinuousColorLegend } from "@mui/x-charts/ChartsLegend";

const tokens = window.ANYPLOT_TOKENS;

// --- Data: renewable electricity share (%) by European country, placed on an
// approximate compass tile grid (row 0 = north, col 0 = west). Every country
// gets one equally-sized tile, so a small nation (Estonia) reads with the
// same visual weight as a large one (France) — the point of a tile grid. ----
const countries = [
  { abbr: "IS", name: "Iceland", row: 0, col: 0, value: 85 },
  { abbr: "NO", name: "Norway", row: 0, col: 3, value: 98 },
  { abbr: "SE", name: "Sweden", row: 0, col: 5, value: 65 },
  { abbr: "FI", name: "Finland", row: 0, col: 7, value: 55 },
  { abbr: "IE", name: "Ireland", row: 1, col: 0, value: 40 },
  { abbr: "GB", name: "United Kingdom", row: 1, col: 1, value: 43 },
  { abbr: "DK", name: "Denmark", row: 1, col: 4, value: 62 },
  { abbr: "EE", name: "Estonia", row: 1, col: 8, value: 32 },
  { abbr: "NL", name: "Netherlands", row: 2, col: 2, value: 37 },
  { abbr: "DE", name: "Germany", row: 2, col: 4, value: 46 },
  { abbr: "PL", name: "Poland", row: 2, col: 6, value: 18 },
  { abbr: "LT", name: "Lithuania", row: 2, col: 8, value: 28 },
  { abbr: "BE", name: "Belgium", row: 3, col: 1, value: 24 },
  { abbr: "CZ", name: "Czechia", row: 3, col: 4, value: 17 },
  { abbr: "SK", name: "Slovakia", row: 3, col: 5, value: 23 },
  { abbr: "UA", name: "Ukraine", row: 3, col: 8, value: 9 },
  { abbr: "FR", name: "France", row: 4, col: 1, value: 25 },
  { abbr: "CH", name: "Switzerland", row: 4, col: 3, value: 72 },
  { abbr: "AT", name: "Austria", row: 4, col: 4, value: 78 },
  { abbr: "HU", name: "Hungary", row: 4, col: 5, value: 14 },
  { abbr: "RO", name: "Romania", row: 4, col: 7, value: 43 },
  { abbr: "PT", name: "Portugal", row: 5, col: 0, value: 61 },
  { abbr: "ES", name: "Spain", row: 5, col: 1, value: 46 },
  { abbr: "IT", name: "Italy", row: 5, col: 4, value: 35 },
  { abbr: "HR", name: "Croatia", row: 5, col: 5, value: 55 },
  { abbr: "RS", name: "Serbia", row: 5, col: 6, value: 30 },
  { abbr: "BG", name: "Bulgaria", row: 5, col: 7, value: 19 },
  { abbr: "GR", name: "Greece", row: 6, col: 6, value: 40 },
];

const N_COLS = Math.max(...countries.map((c) => c.col)) + 1;
const N_ROWS = Math.max(...countries.map((c) => c.row)) + 1;
const colCategories = Array.from({ length: N_COLS }, (_, i) => String(i));
const rowCategories = Array.from({ length: N_ROWS }, (_, i) => String(i));

const points = countries.map((c) => ({
  id: c.abbr,
  x: String(c.col),
  y: String(c.row),
  z: c.value,
}));

const shares = countries.map((c) => c.value);
const minShare = Math.min(...shares);
const maxShare = Math.max(...shares);

// Perceived luminance of the tile fill decides whether the abbreviation reads
// better in dark or light ink — the fill itself always comes from the
// continuous Imprint scale, never a custom hex.
function textColorFor(hex) {
  const n = parseInt(hex.slice(1), 16);
  const r = (n >> 16) & 255;
  const g = (n >> 8) & 255;
  const b = n & 255;
  const toLinear = (c) => {
    const cs = c / 255;
    return cs <= 0.03928 ? cs / 12.92 : ((cs + 0.055) / 1.055) ** 2.4;
  };
  const luminance = 0.2126 * toLinear(r) + 0.7152 * toLinear(g) + 0.0722 * toLinear(b);
  return luminance > 0.45 ? "#1A1A17" : "#F0EFE8";
}

// Custom scatter mark: opaque square tiles (instead of the default circles)
// sized from the band scales' own bandwidth, so every tile is identical in
// area regardless of how few or many neighbors share its row/column.
function CountryTile(props) {
  const { series, xScale, yScale, colorGetter, color } = props;
  const cellWidth = xScale.bandwidth();
  const cellHeight = yScale.bandwidth();
  const tileSize = Math.min(cellWidth, cellHeight);
  const fontSize = tileSize * 0.32;

  return (
    <g>
      {series.data.map((point, i) => {
        const cx = (xScale(point.x) ?? 0) + cellWidth / 2;
        const cy = (yScale(point.y) ?? 0) + cellHeight / 2;
        const fill = colorGetter ? colorGetter(i) : color;
        return (
          <g key={point.id}>
            <rect
              x={cx - tileSize / 2}
              y={cy - tileSize / 2}
              width={tileSize}
              height={tileSize}
              rx={tileSize * 0.1}
              fill={fill}
              stroke={tokens.pageBg}
              strokeWidth={3}
            />
            <text
              x={cx}
              y={cy}
              textAnchor="middle"
              dominantBaseline="central"
              fontSize={fontSize}
              fontWeight={600}
              fill={textColorFor(fill)}
            >
              {point.id}
            </text>
          </g>
        );
      })}
    </g>
  );
}

export default function Chart() {
  const { width, height } = window.ANYPLOT_SIZE;
  const TITLE_BLOCK_HEIGHT = 100;
  const chartWidth = width;
  const chartHeight = height - TITLE_BLOCK_HEIGHT;

  // ContinuousColorLegend positions its bounding box (bar + both labels)
  // flush against the *full* width passed to ScatterChart — it ignores
  // margin.right entirely, so the tile grid's margin math can't push it
  // inward. Render the chart itself slightly narrower than the mount so a
  // safety strip of true background is always left between the legend's
  // rightmost label glyph and the physical canvas edge.
  const RIGHT_SAFETY = 12;
  const renderWidth = chartWidth - RIGHT_SAFETY;

  // Reserve a slice on the right for the continuous colorbar legend, then
  // fit the largest uniform tile pitch that keeps every tile the same size
  // (the "equal area" rule the spec calls out as the whole point of a tile
  // grid map) inside whatever space remains. The legend itself is only as
  // wide as its longest label (its bar and labels are stacked, not summed),
  // so the reserve only needs to cover that plus a small gap.
  const PAD = 28;
  const LEGEND_RESERVE = 64;
  const availW = renderWidth - PAD * 2 - LEGEND_RESERVE;
  const availH = chartHeight - PAD * 2;
  const cellPitch = Math.min(availW / N_COLS, availH / N_ROWS);
  const gridWidth = cellPitch * N_COLS;
  const gridHeight = cellPitch * N_ROWS;

  const marginLeft = PAD + (availW - gridWidth) / 2;
  const marginTop = PAD + (availH - gridHeight) / 2;
  const marginRight = renderWidth - marginLeft - gridWidth;
  const marginBottom = chartHeight - marginTop - gridHeight;

  return (
    <Box sx={{ width, height, bgcolor: tokens.pageBg, display: "flex", flexDirection: "column" }}>
      <Box
        sx={{
          height: TITLE_BLOCK_HEIGHT,
          display: "flex",
          flexDirection: "column",
          justifyContent: "center",
          alignItems: "center",
        }}
      >
        <Typography sx={{ color: tokens.ink, fontSize: 22, fontWeight: 500, lineHeight: 1.2, fontFamily: "inherit" }}>
          map-tilegrid · javascript · muix · anyplot.ai
        </Typography>
        <Typography sx={{ color: tokens.inkSoft, fontSize: 13, lineHeight: 1.2, fontFamily: "inherit", pt: "4px" }}>
          Renewable electricity share by country — equal tile weight, not land area
        </Typography>
      </Box>
      <Box sx={{ flex: 1, display: "flex" }}>
        <ScatterChart
          width={renderWidth}
          height={chartHeight}
          skipAnimation
          disableVoronoi
          series={[
            {
              id: "renewables",
              type: "scatter",
              data: points,
              label: "Renewable electricity share",
              xAxisId: "col",
              yAxisId: "row",
              zAxisId: "share",
              valueFormatter: (value, { dataIndex }) =>
                `${countries[dataIndex].name}: ${value.z}% renewable`,
            },
          ]}
          xAxis={[{ id: "col", scaleType: "band", data: colCategories, categoryGapRatio: 0.12 }]}
          yAxis={[{ id: "row", scaleType: "band", data: rowCategories, categoryGapRatio: 0.12 }]}
          zAxis={[
            {
              id: "share",
              min: minShare,
              max: maxShare,
              colorMap: { type: "continuous", min: minShare, max: maxShare, color: [tokens.seq[0], tokens.seq[1]] },
            },
          ]}
          bottomAxis={null}
          leftAxis={null}
          margin={{ top: marginTop, right: marginRight, bottom: marginBottom, left: marginLeft }}
          slots={{ scatter: CountryTile }}
          slotProps={{ legend: { hidden: true } }}
        >
          <ContinuousColorLegend
            axisId="share"
            axisDirection="z"
            position={{ horizontal: "right", vertical: "middle" }}
            direction="column"
            length="55%"
            thickness={14}
            minLabel={({ formattedValue }) => `${formattedValue}%`}
            maxLabel={({ formattedValue }) => `${formattedValue}%`}
            // MUI X measures this label off-screen against `document.body`
            // (not `#container`), so "inherit" would pick up the browser's
            // default serif font instead of the sans-serif stack the label
            // actually renders in — an explicit family keeps the measured
            // and rendered widths in sync.
            labelStyle={{
              fontSize: 13,
              fill: tokens.inkSoft,
              fontFamily: '-apple-system, BlinkMacSystemFont, "Segoe UI", Roboto, Helvetica, Arial, sans-serif',
            }}
          />
        </ScatterChart>
      </Box>
    </Box>
  );
}
Runnable source as JSON, for any HTTP client: https://api.anyplot.ai/specs/map-tilegrid/muix/code. Any spec id and library id listed in llms-full.txt fit the same URL shape; every URL below is complete and callable.
{
  "spec_id": "map-tilegrid",
  "language": "javascript",
  "library": "muix",
  "page": "https://anyplot.ai/map-tilegrid/javascript/muix",
  "hub": "https://anyplot.ai/map-tilegrid",
  "code_json": "https://api.anyplot.ai/specs/map-tilegrid/muix/code",
  "spec_json": "https://api.anyplot.ai/specs/map-tilegrid",
  "render_light_png": "https://storage.googleapis.com/anyplot-images/plots/map-tilegrid/javascript/muix/plot-light.png",
  "render_dark_png": "https://storage.googleapis.com/anyplot-images/plots/map-tilegrid/javascript/muix/plot-dark.png",
  "interactive_light_html": "https://storage.googleapis.com/anyplot-images/plots/map-tilegrid/javascript/muix/plot-light.html",
  "interactive_dark_html": "https://storage.googleapis.com/anyplot-images/plots/map-tilegrid/javascript/muix/plot-dark.html",
  "quality_score": 93.0,
  "license": "MIT",
  "guide": "https://anyplot.ai/llms.txt"
}
Part of Tile Grid Map for Equal-Area Geographic Comparison on anyplot.ai.