The same plot in 14 other libraries — JavaScript: D3.js, Apache ECharts, Highcharts, MUI X Charts; Python: Altair, Bokeh, lets-plot, Matplotlib, Plotly, plotnine, Pygal, Seaborn; R: ggplot2; Julia: Makie.jl. Compare all 15 side by side: Mohr's Circle for Stress Analysis in Python, R, Julia and JavaScript.
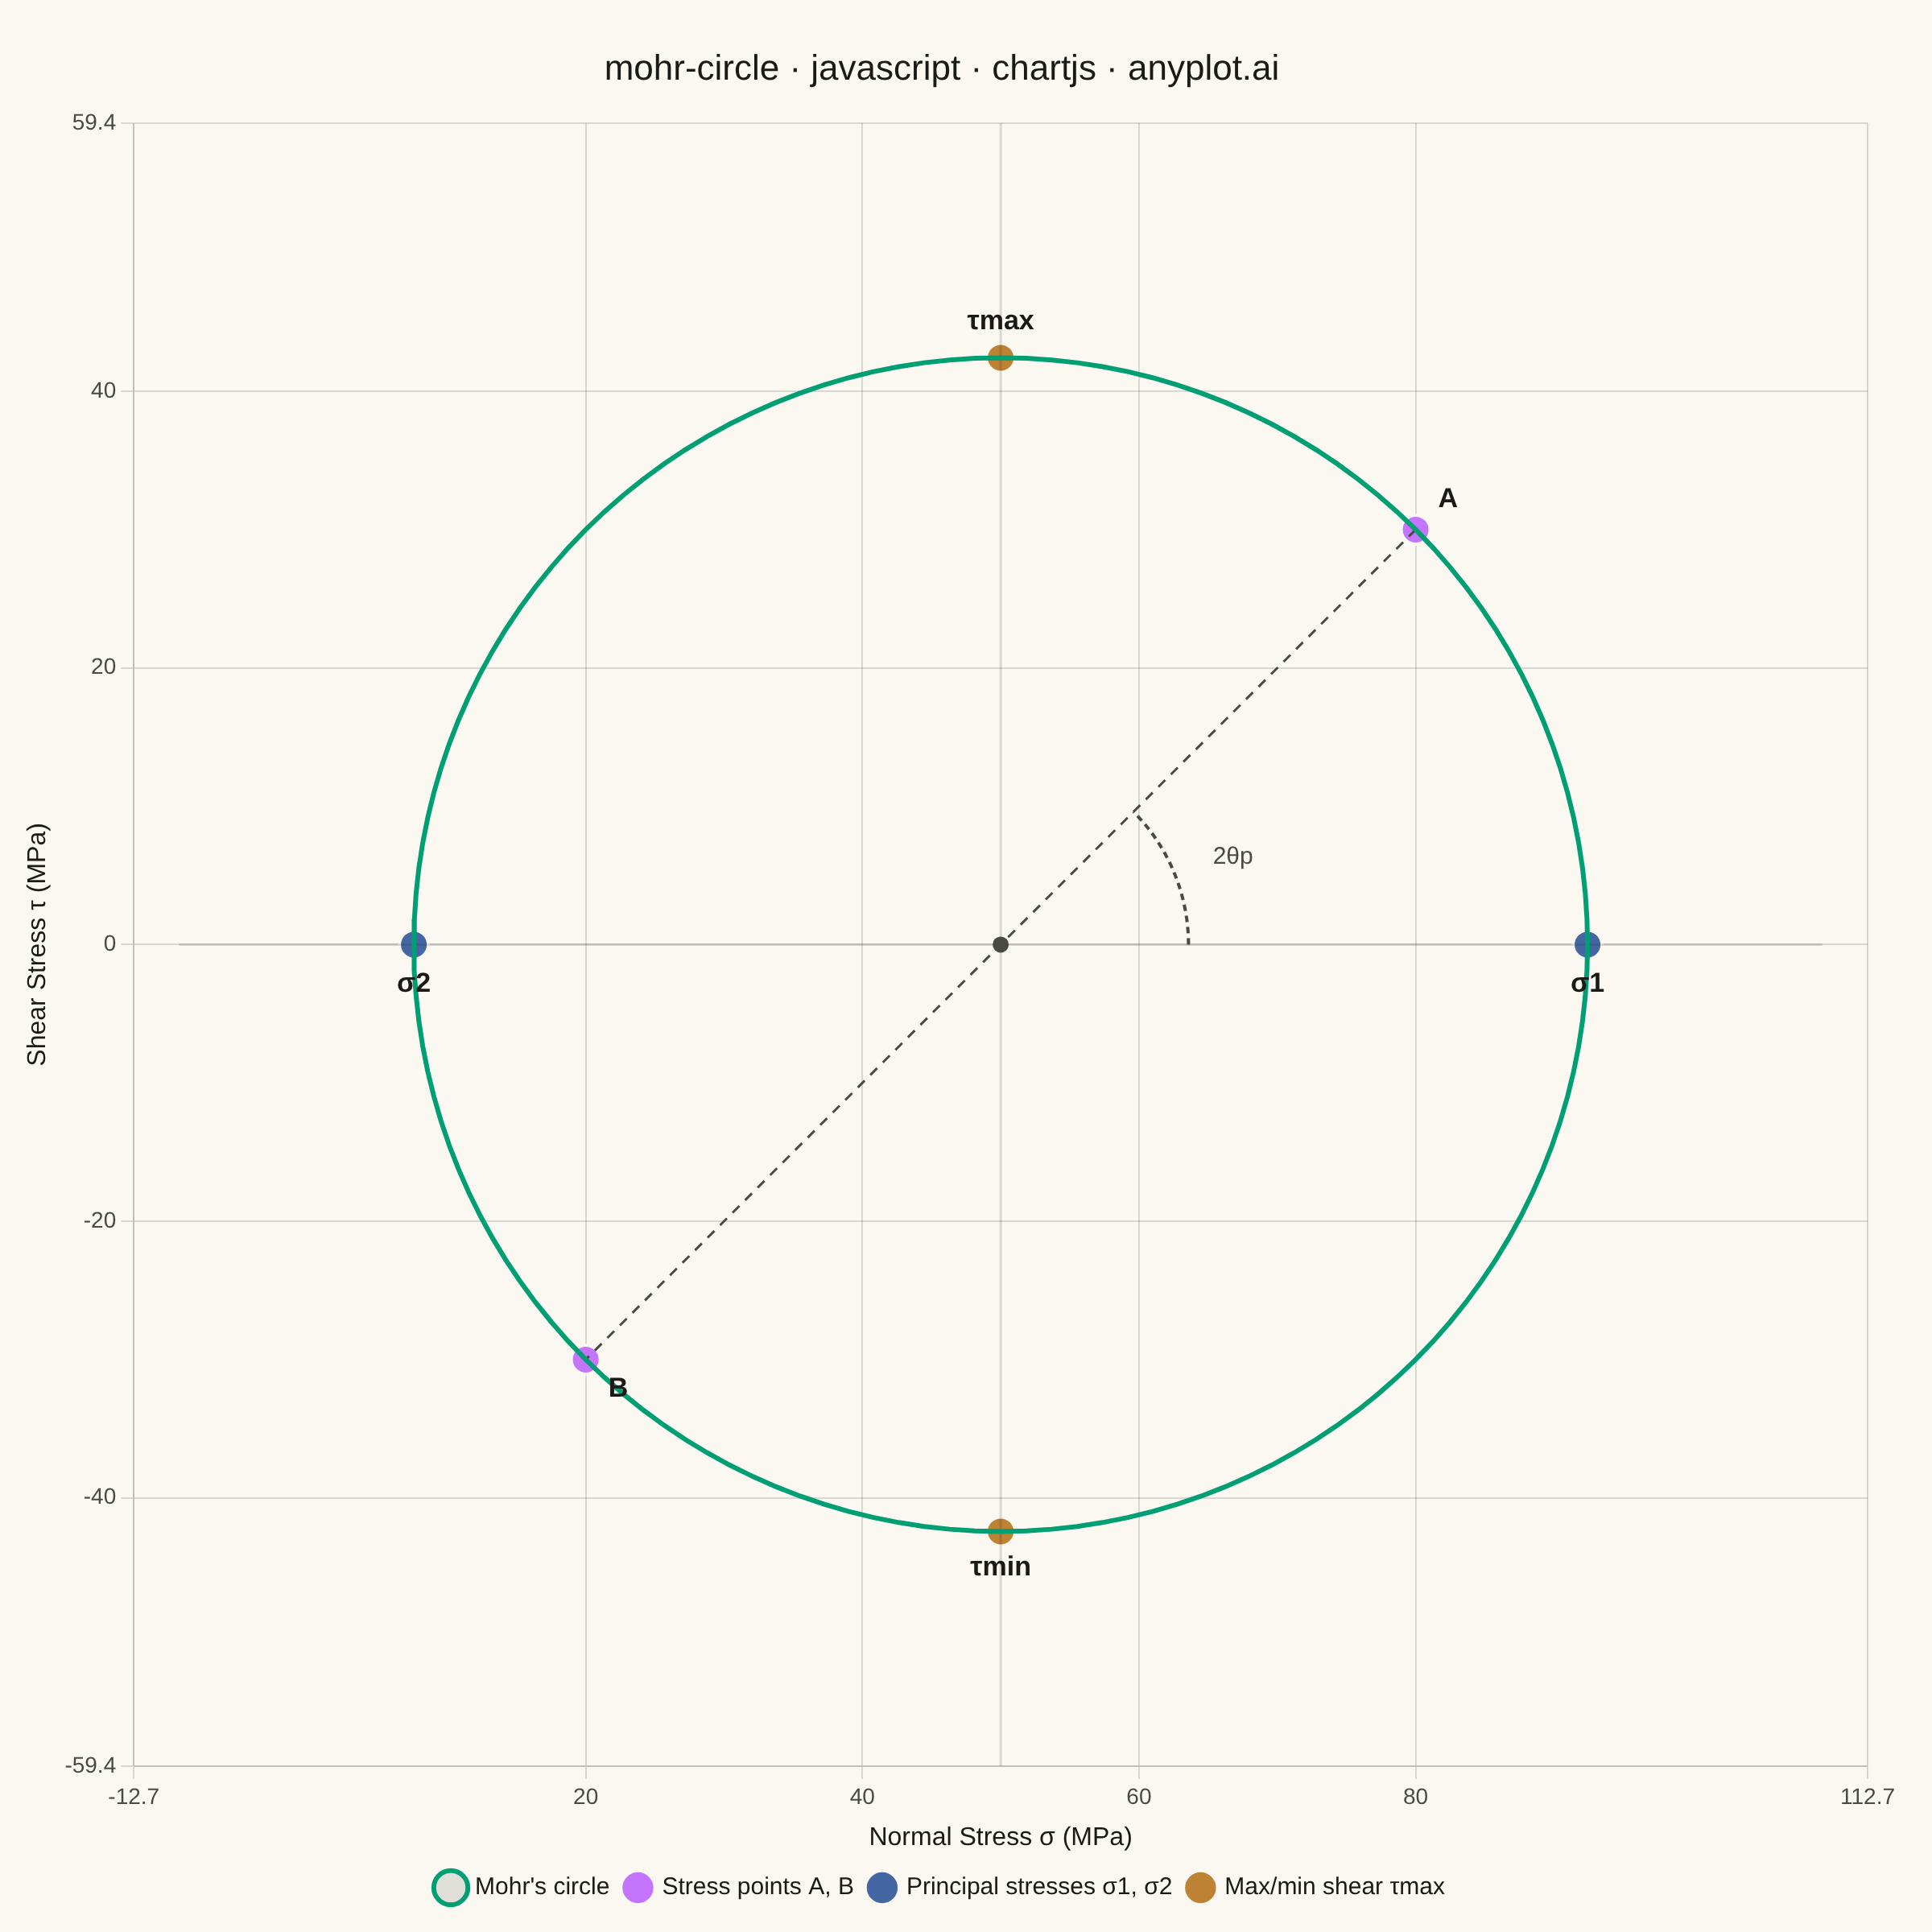
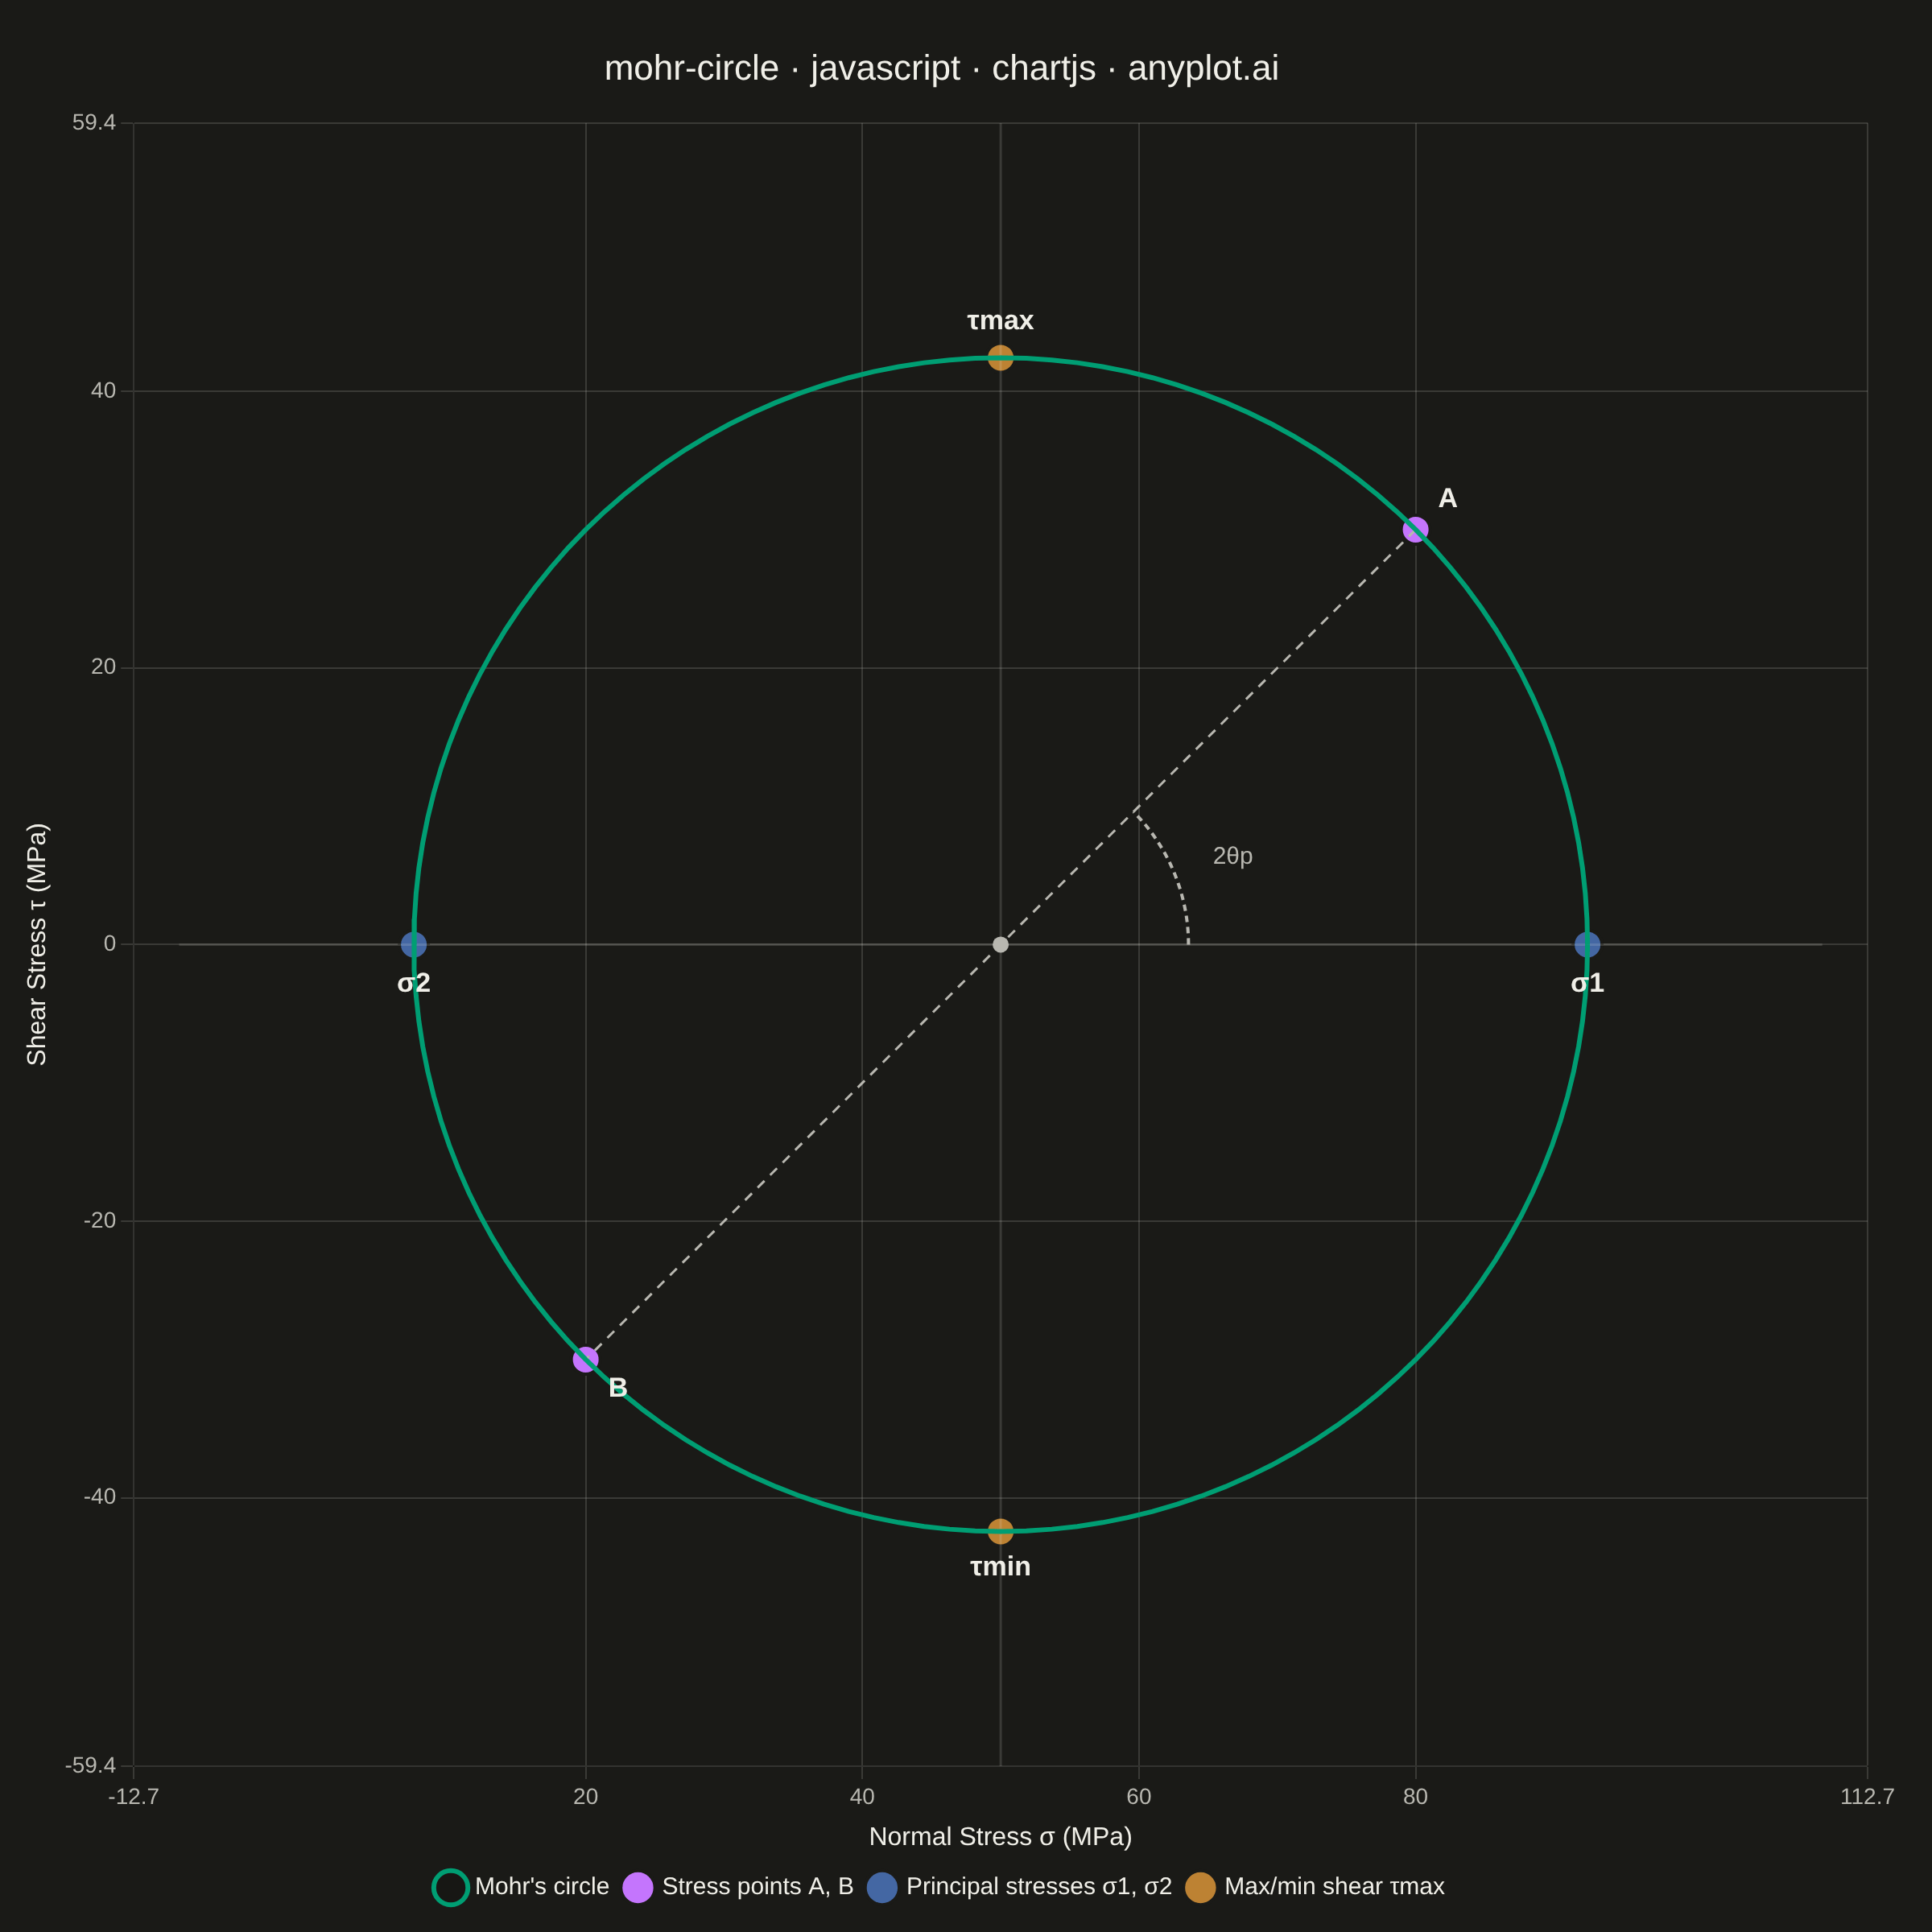
Mohr's Circle is a graphical method used to determine principal stresses, maximum shear stress, and stress transformations from a given 2D stress state. A circle is drawn on a normal stress (σ) vs. shear stress (τ) plane, with the center at ((σx + σy) / 2, 0) and a radius derived from the stress components. It is an essential tool in mechanical and civil engineering for visualizing how stress components change under coordinate rotation.
// anyplot.ai
// mohr-circle: Mohr's Circle for Stress Analysis
// Library: chartjs 4.4.7 | JavaScript 22.23.2
// Quality: 92/100 | Created: 2026-08-26

//# anyplot-orientation: square
const t = window.ANYPLOT_TOKENS;

// --- Stress state (MPa) ------------------------------------------------------
const sigmaX = 80;
const sigmaY = 20;
const tauXY = 30;

const center = (sigmaX + sigmaY) / 2;
const radius = Math.sqrt(((sigmaX - sigmaY) / 2) ** 2 + tauXY ** 2);

const sigma1 = center + radius;
const sigma2 = center - radius;
const tauMax = radius;

const pointA = { x: sigmaX, y: tauXY };
const pointB = { x: sigmaY, y: -tauXY };

// Parametric circle outline, drawn as a line dataset.
const circlePoints = Array.from({ length: 145 }, (_, i) => {
  const angle = (i / 144) * 2 * Math.PI;
  return { x: center + radius * Math.cos(angle), y: radius * Math.sin(angle) };
});

const pad = radius * 0.4;
const axisMin = center - radius - pad;
const axisMax = center + radius + pad;
const axisHalfSpan = radius + pad;

// --- Mount -------------------------------------------------------------------
const canvas = document.createElement("canvas");
document.getElementById("container").appendChild(canvas);

// --- Custom plugins ----------------------------------------------------------
// Chart.js has no per-axis "equal aspect" option. Without one, a stress circle
// with different sigma/tau extents renders as an ellipse. This plugin measures
// pixels-per-unit on both axes after layout and expands the tighter axis's
// range to match, so the circle stays a true circle. Guarded by $aspectDone so
// the single corrective chart.update() it triggers doesn't recurse.
const equalAspectPlugin = {
  id: "equalAspect",
  afterLayout(chart) {
    if (chart.$aspectDone) return;
    const { chartArea, scales } = chart;
    const xs = scales.x;
    const ys = scales.y;
    const pxPerUnitX = chartArea.width / (xs.max - xs.min);
    const pxPerUnitY = chartArea.height / (ys.max - ys.min);
    if (pxPerUnitX < pxPerUnitY) {
      const yCenter = (ys.min + ys.max) / 2;
      const halfRange = chartArea.height / pxPerUnitX / 2;
      ys.options.min = yCenter - halfRange;
      ys.options.max = yCenter + halfRange;
    } else {
      const xCenter = (xs.min + xs.max) / 2;
      const halfRange = chartArea.width / pxPerUnitY / 2;
      xs.options.min = xCenter - halfRange;
      xs.options.max = xCenter + halfRange;
    }
    chart.$aspectDone = true;
    chart.update("none");
  },
};

// Chart.js core has no chart type for labeled reference points or angle arcs,
// so this plugin draws the Mohr's-circle-specific reading aids (point labels,
// the center marker, and the 2*theta_p arc from the reference axis to point A)
// directly on the canvas via the public afterDatasetsDraw hook.
const annotationPlugin = {
  id: "mohrAnnotations",
  afterDatasetsDraw(chart) {
    const { ctx, scales } = chart;
    const px = (v) => scales.x.getPixelForValue(v);
    const py = (v) => scales.y.getPixelForValue(v);
    const cx = px(center);
    const cy = py(0);
    const unitPx = Math.abs(px(center + 1) - cx);

    ctx.save();

    // Center marker
    ctx.beginPath();
    ctx.arc(cx, cy, 5, 0, 2 * Math.PI);
    ctx.fillStyle = t.inkSoft;
    ctx.fill();

    // Angle arc: reference axis (toward sigma1) -> radius to point A
    const arcRadiusPx = radius * 0.32 * unitPx;
    const angleRef = Math.atan2(py(0) - cy, px(sigma1) - cx);
    const angleA = Math.atan2(py(tauXY) - cy, px(sigmaX) - cx);
    const ccw = angleA < angleRef;
    ctx.beginPath();
    ctx.setLineDash([4, 3]);
    ctx.lineWidth = 2;
    ctx.strokeStyle = t.inkSoft;
    ctx.arc(cx, cy, arcRadiusPx, angleRef, angleA, ccw);
    ctx.stroke();
    ctx.setLineDash([]);

    const midAngle = (angleRef + angleA) / 2;
    ctx.font = "500 15px -apple-system, sans-serif";
    ctx.fillStyle = t.inkSoft;
    ctx.textAlign = "left";
    ctx.textBaseline = "middle";
    ctx.fillText("2θp", cx + Math.cos(midAngle) * (arcRadiusPx + 26), cy + Math.sin(midAngle) * (arcRadiusPx + 26));

    // Point labels
    ctx.font = "600 17px -apple-system, sans-serif";
    ctx.fillStyle = t.ink;

    ctx.textAlign = "left";
    ctx.textBaseline = "bottom";
    ctx.fillText("A", px(pointA.x) + 14, py(pointA.y) - 10);

    ctx.textAlign = "left";
    ctx.textBaseline = "top";
    ctx.fillText("B", px(pointB.x) + 14, py(pointB.y) + 10);

    ctx.textAlign = "center";
    ctx.textBaseline = "top";
    ctx.fillText("σ1", px(sigma1), cy + 16);
    ctx.fillText("σ2", px(sigma2), cy + 16);

    ctx.textAlign = "center";
    ctx.textBaseline = "bottom";
    ctx.fillText("τmax", px(center), py(tauMax) - 14);
    ctx.textBaseline = "top";
    ctx.fillText("τmin", px(center), py(-tauMax) + 14);

    ctx.restore();
  },
};

// --- Chart ---------------------------------------------------------------
new Chart(canvas, {
  type: "scatter",
  data: {
    datasets: [
      {
        label: "Mohr's circle",
        data: circlePoints,
        showLine: true,
        fill: false,
        tension: 0,
        borderColor: t.palette[0],
        borderWidth: 3,
        pointRadius: 0,
      },
      {
        label: "_diameter",
        data: [pointA, pointB],
        showLine: true,
        borderColor: t.inkSoft,
        borderWidth: 1.5,
        borderDash: [6, 5],
        pointRadius: 0,
      },
      {
        label: "_axis-h",
        data: [
          { x: axisMin, y: 0 },
          { x: axisMax, y: 0 },
        ],
        showLine: true,
        borderColor: t.grid,
        borderWidth: 1.5,
        pointRadius: 0,
      },
      {
        label: "_axis-v",
        data: [
          { x: center, y: -axisHalfSpan },
          { x: center, y: axisHalfSpan },
        ],
        showLine: true,
        borderColor: t.grid,
        borderWidth: 1.5,
        pointRadius: 0,
      },
      {
        label: "Stress points A, B",
        data: [pointA, pointB],
        pointRadius: 9,
        pointHoverRadius: 9,
        backgroundColor: t.palette[1],
        borderColor: t.pageBg,
        borderWidth: 2,
      },
      {
        label: "Principal stresses σ1, σ2",
        data: [
          { x: sigma1, y: 0 },
          { x: sigma2, y: 0 },
        ],
        pointRadius: 9,
        pointHoverRadius: 9,
        backgroundColor: t.palette[2],
        borderColor: t.pageBg,
        borderWidth: 2,
      },
      {
        label: "Max/min shear τmax",
        data: [
          { x: center, y: tauMax },
          { x: center, y: -tauMax },
        ],
        pointRadius: 9,
        pointHoverRadius: 9,
        backgroundColor: t.palette[3],
        borderColor: t.pageBg,
        borderWidth: 2,
      },
    ],
  },
  options: {
    responsive: true,
    maintainAspectRatio: false,
    animation: false,
    layout: { padding: { top: 30, right: 40, bottom: 10, left: 10 } },
    plugins: {
      title: {
        display: true,
        text: "mohr-circle · javascript · chartjs · anyplot.ai",
        color: t.ink,
        font: { size: 22, weight: "500" },
        padding: { bottom: 20 },
      },
      legend: {
        position: "bottom",
        labels: {
          color: t.ink,
          font: { size: 15 },
          usePointStyle: true,
          filter: (item) => !item.text.startsWith("_"),
        },
      },
      tooltip: {
        filter: (item) => !item.dataset.label.startsWith("_"),
      },
    },
    scales: {
      x: {
        type: "linear",
        min: axisMin,
        max: axisMax,
        title: { display: true, text: "Normal Stress σ (MPa)", color: t.ink, font: { size: 16 } },
        ticks: { color: t.inkSoft, font: { size: 14 } },
        grid: { color: t.grid },
      },
      y: {
        type: "linear",
        min: -axisHalfSpan,
        max: axisHalfSpan,
        title: { display: true, text: "Shear Stress τ (MPa)", color: t.ink, font: { size: 16 } },
        ticks: { color: t.inkSoft, font: { size: 14 } },
        grid: { color: t.grid },
      },
    },
  },
  plugins: [equalAspectPlugin, annotationPlugin],
});
Runnable source as JSON, for any HTTP client: https://api.anyplot.ai/specs/mohr-circle/chartjs/code. Any spec id and library id listed in llms-full.txt fit the same URL shape; every URL below is complete and callable.
{
  "spec_id": "mohr-circle",
  "language": "javascript",
  "library": "chartjs",
  "page": "https://anyplot.ai/mohr-circle/javascript/chartjs",
  "hub": "https://anyplot.ai/mohr-circle",
  "code_json": "https://api.anyplot.ai/specs/mohr-circle/chartjs/code",
  "spec_json": "https://api.anyplot.ai/specs/mohr-circle",
  "render_light_png": "https://storage.googleapis.com/anyplot-images/plots/mohr-circle/javascript/chartjs/plot-light.png",
  "render_dark_png": "https://storage.googleapis.com/anyplot-images/plots/mohr-circle/javascript/chartjs/plot-dark.png",
  "interactive_light_html": "https://storage.googleapis.com/anyplot-images/plots/mohr-circle/javascript/chartjs/plot-light.html",
  "interactive_dark_html": "https://storage.googleapis.com/anyplot-images/plots/mohr-circle/javascript/chartjs/plot-dark.html",
  "quality_score": 92.0,
  "license": "MIT",
  "guide": "https://anyplot.ai/llms.txt"
}
Part of Mohr's Circle for Stress Analysis on anyplot.ai.