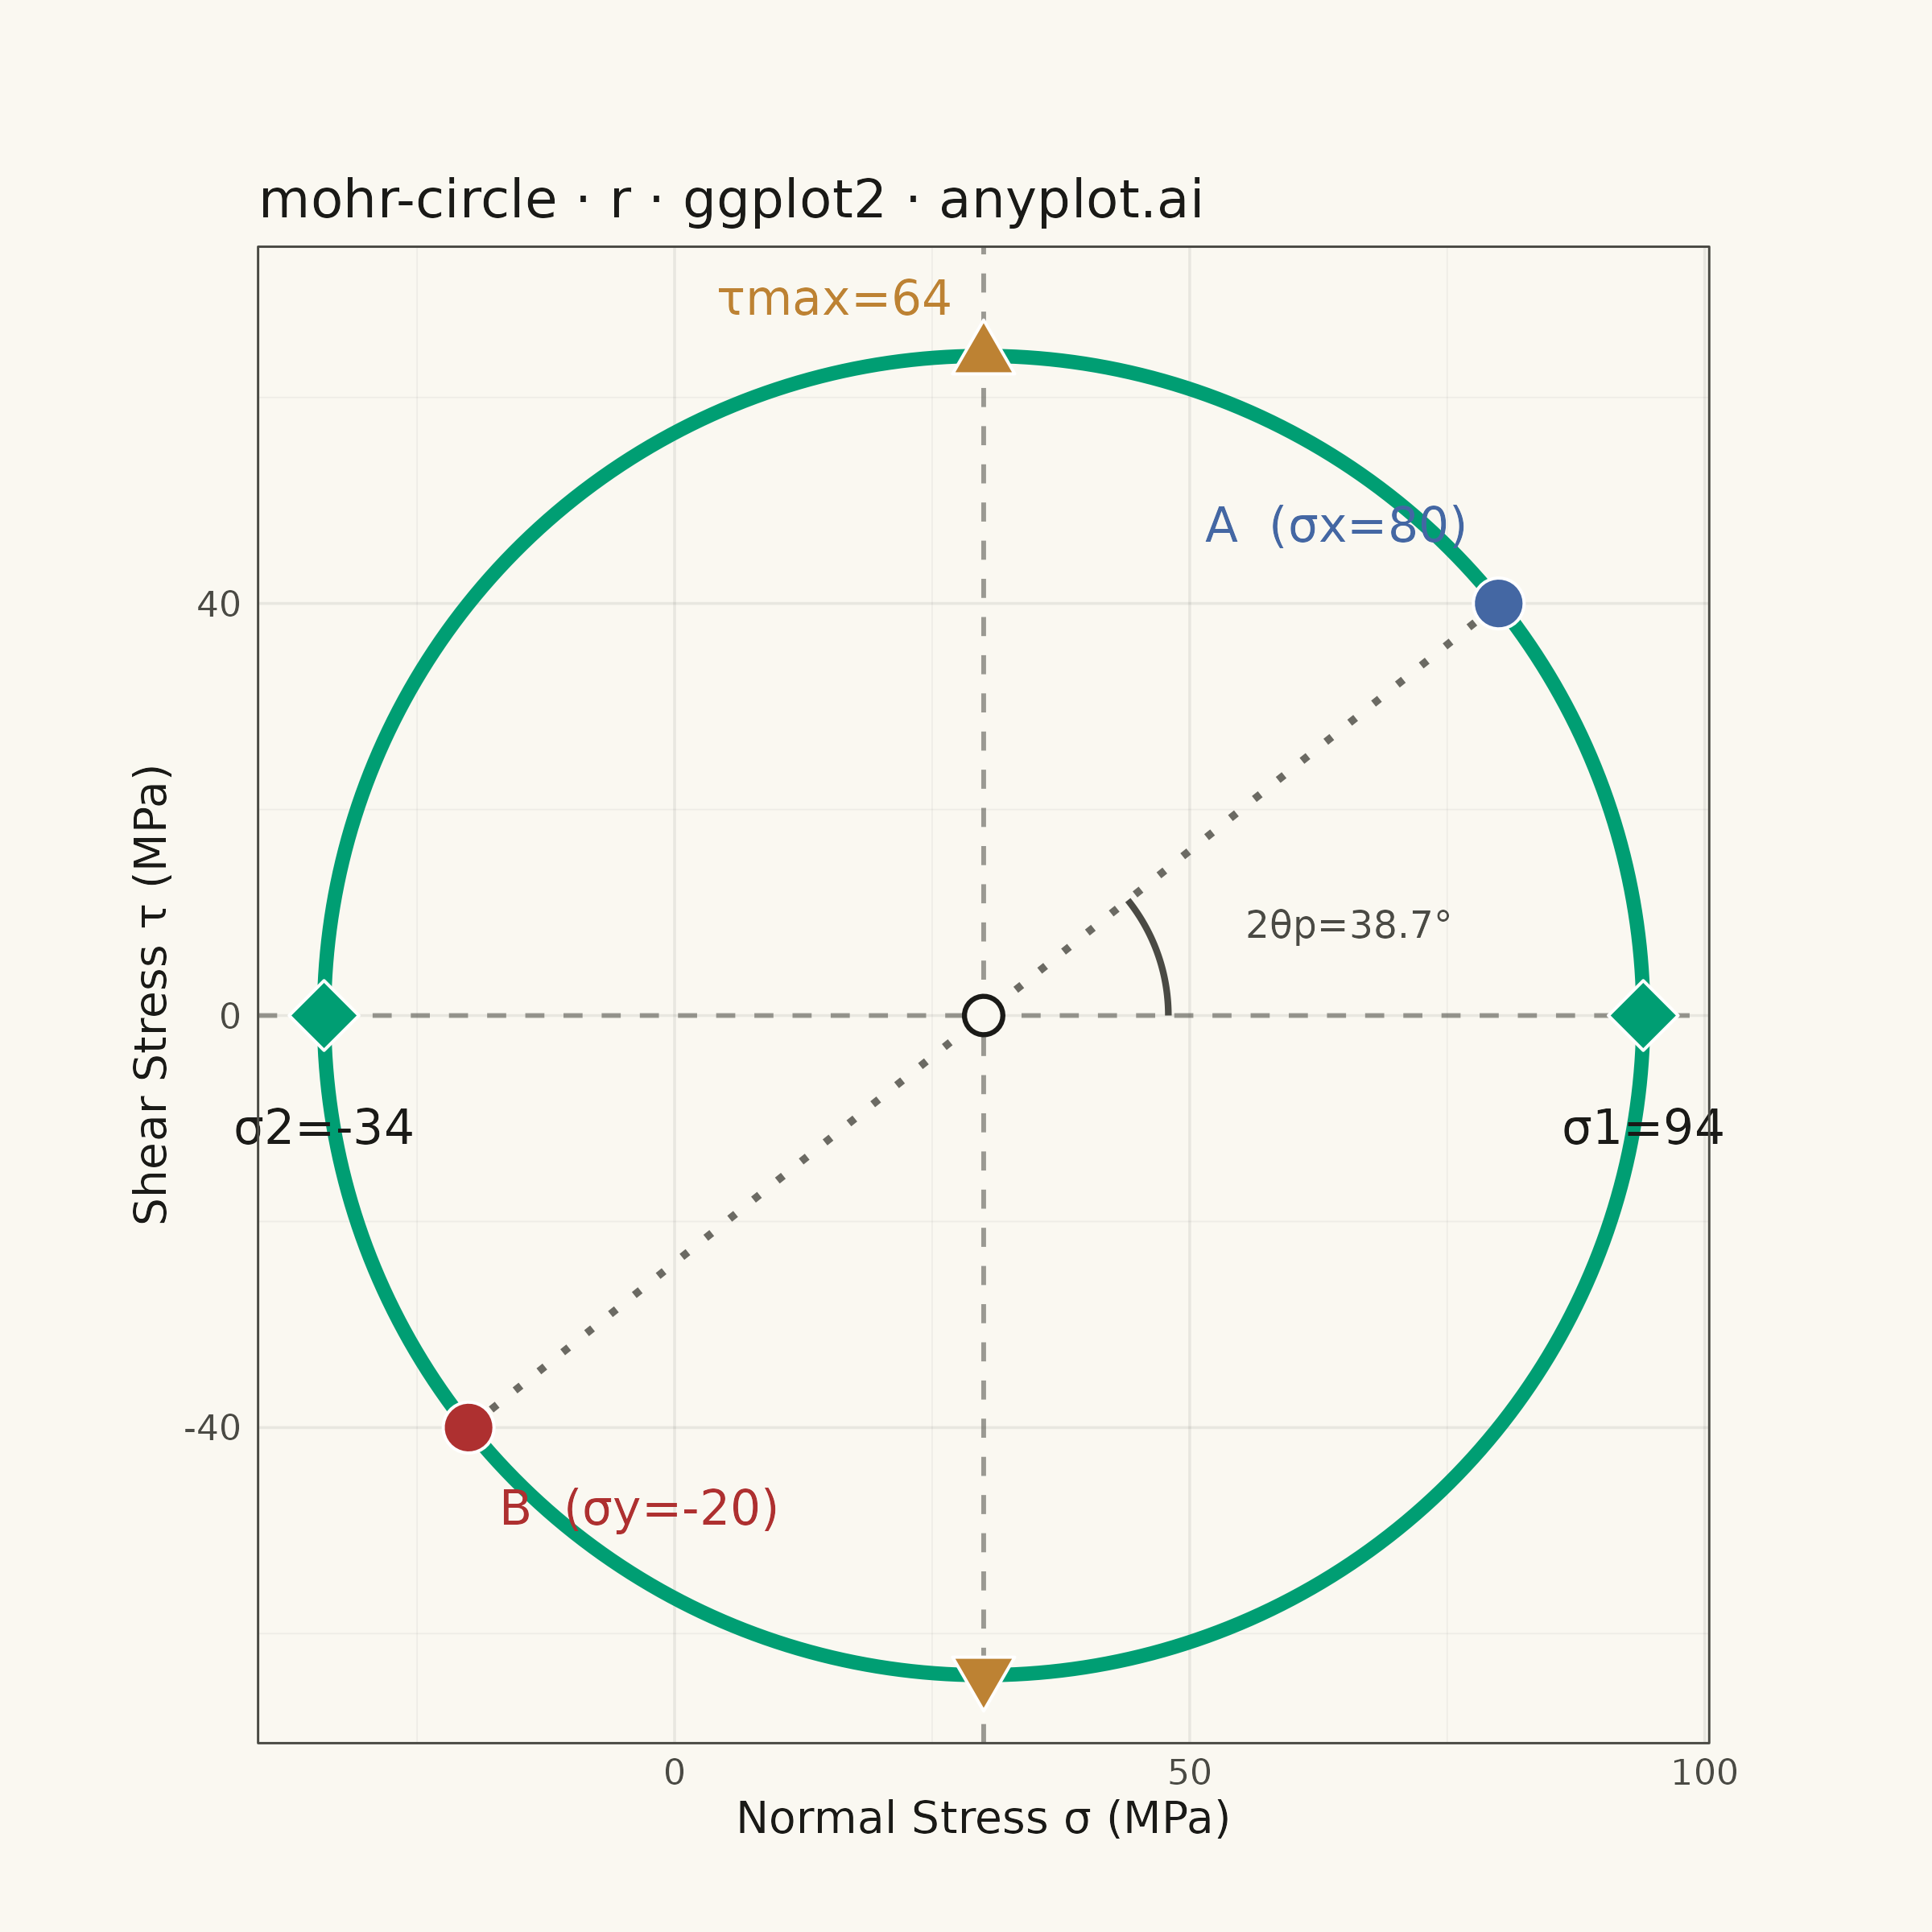
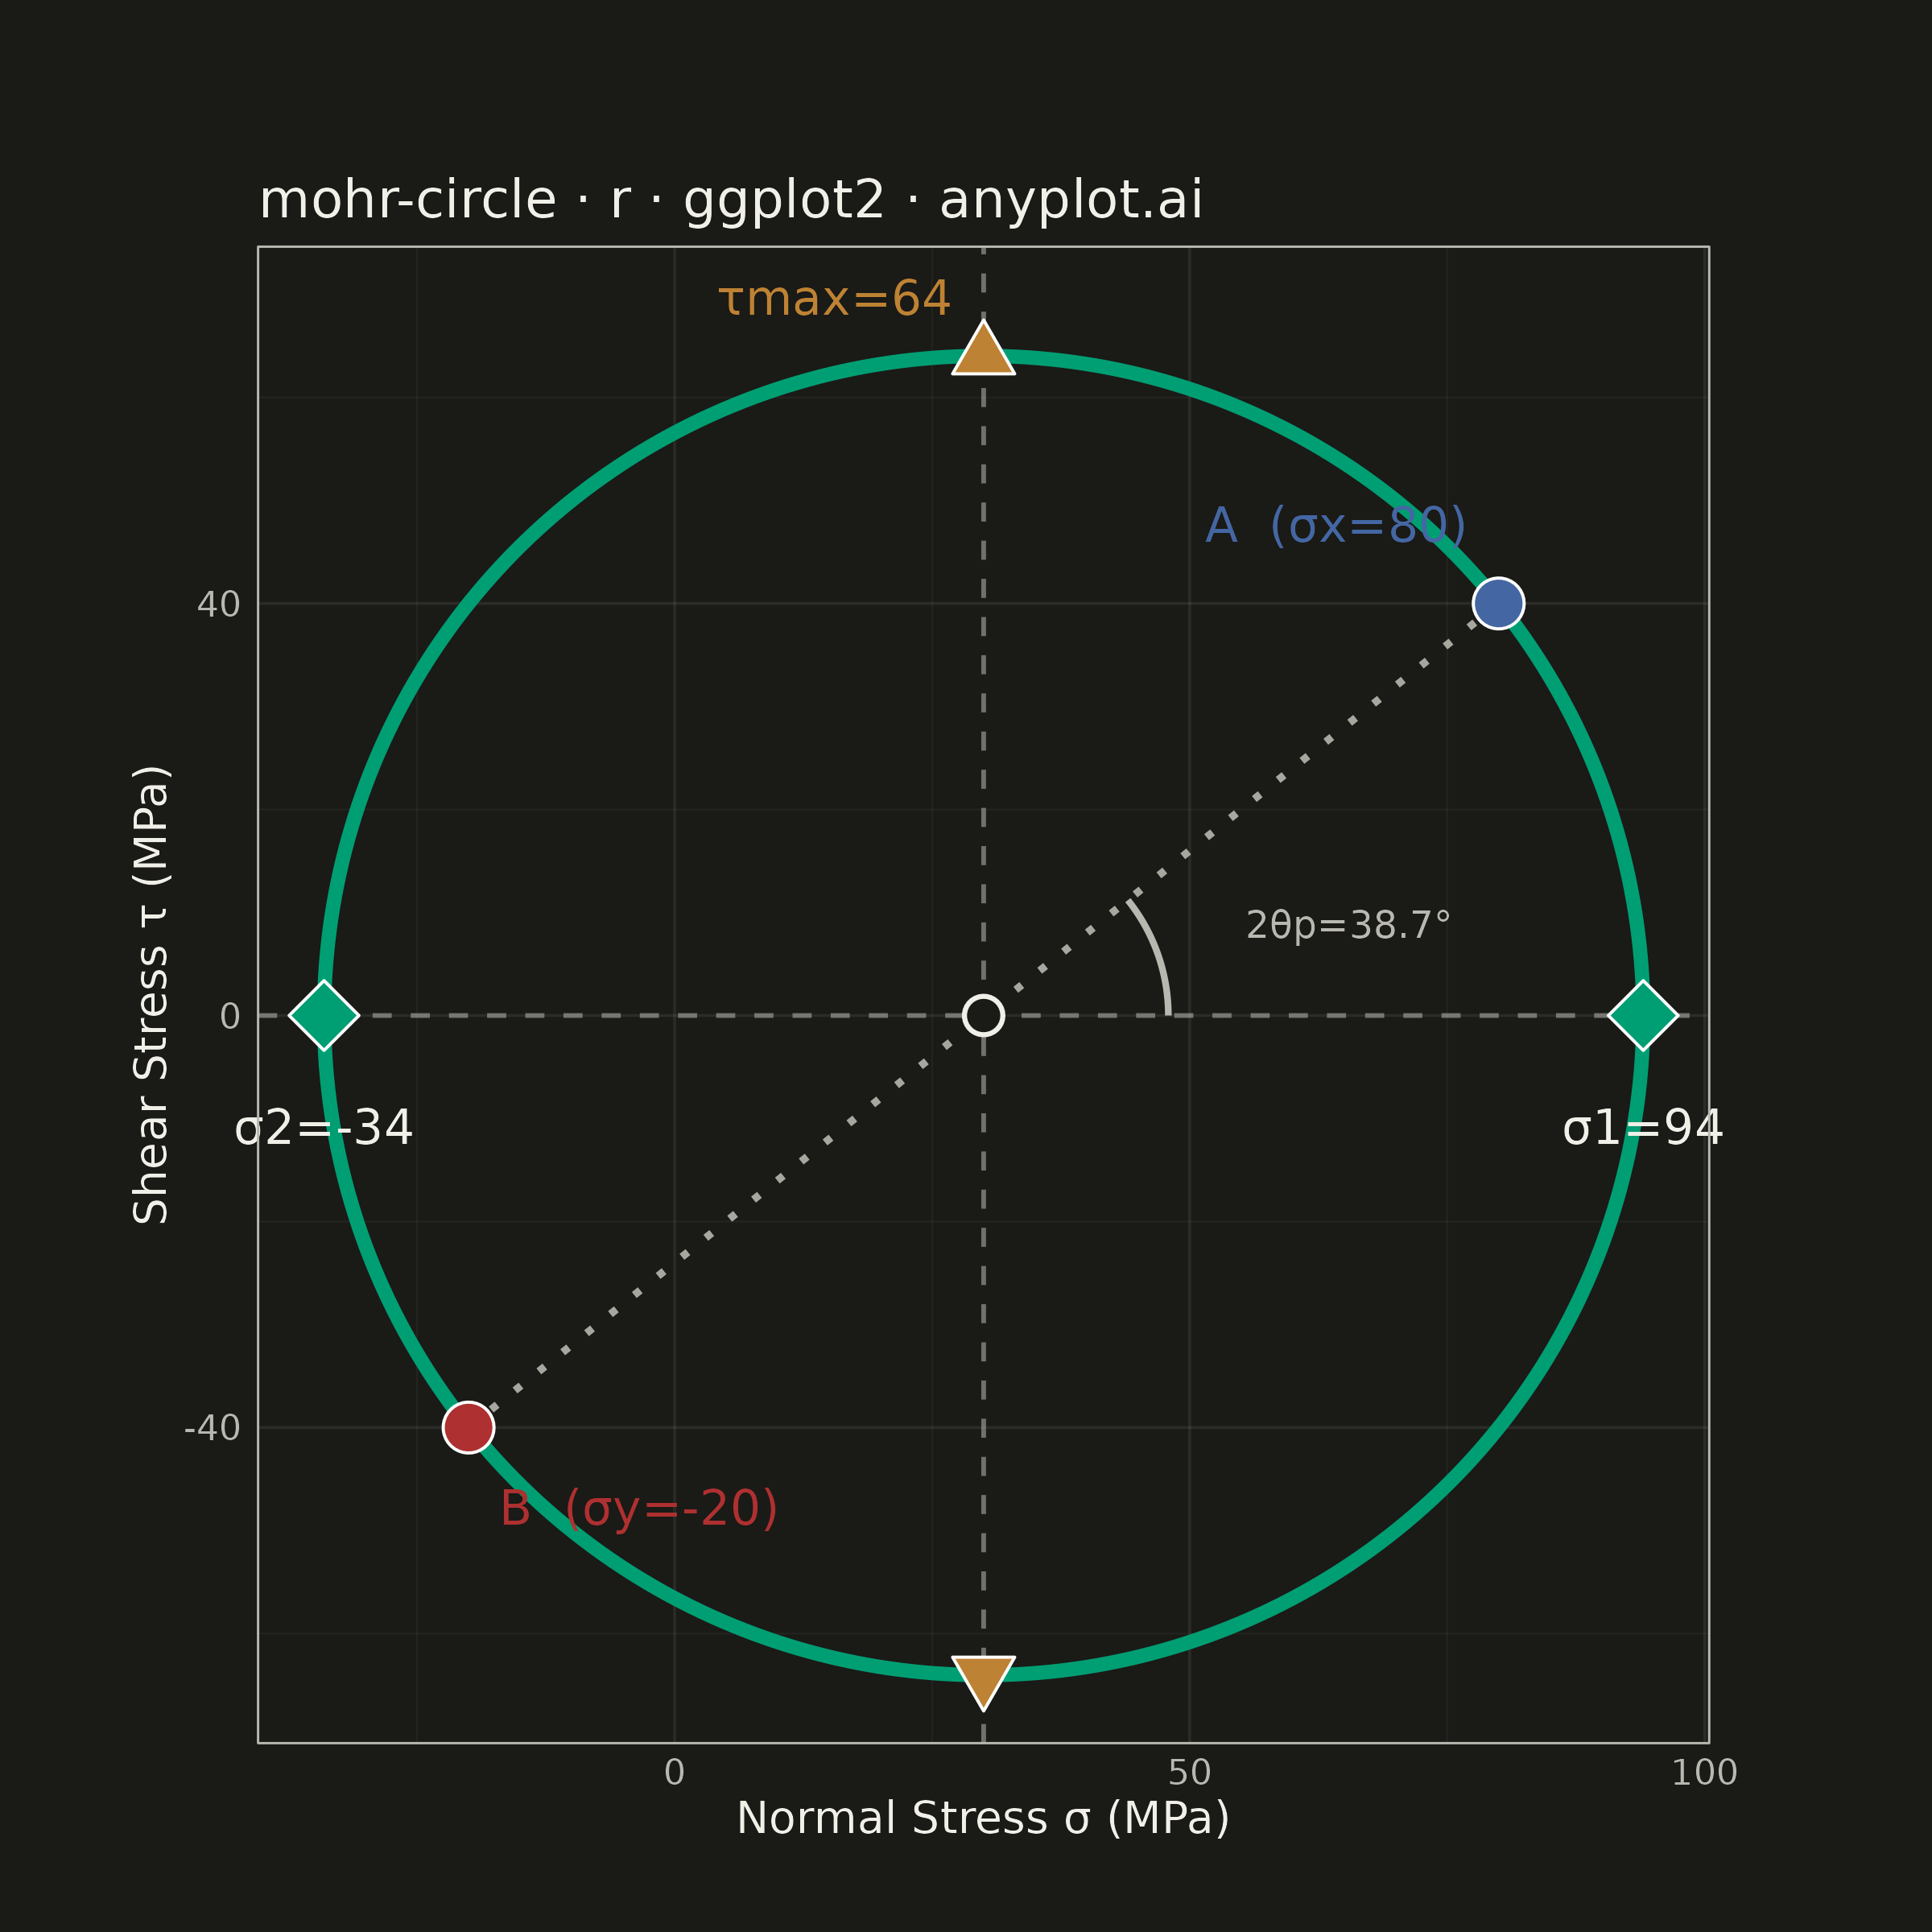
The same plot in 14 other libraries — Python: Altair, Bokeh, lets-plot, Matplotlib, Plotly, plotnine, Pygal, Seaborn; Julia: Makie.jl; JavaScript: Chart.js, D3.js, Apache ECharts, Highcharts, MUI X Charts. Compare all 15 side by side: Mohr's Circle for Stress Analysis in Python, R, Julia and JavaScript.
Mohr's Circle is a graphical method used to determine principal stresses, maximum shear stress, and stress transformations from a given 2D stress state. A circle is drawn on a normal stress (σ) vs. shear stress (τ) plane, with the center at ((σx + σy) / 2, 0) and a radius derived from the stress components. It is an essential tool in mechanical and civil engineering for visualizing how stress components change under coordinate rotation.
#' anyplot.ai
#' mohr-circle: Mohr's Circle for Stress Analysis
#' Library: ggplot2 3.5.1 | R 4.4.1
#' Quality: 89/100 | Created: 2026-05-30

library(ggplot2)
library(ragg)

# Theme tokens (Imprint palette — theme-adaptive chrome)
THEME       <- Sys.getenv("ANYPLOT_THEME", "light")
PAGE_BG     <- if (THEME == "light") "#FAF8F1" else "#1A1A17"
INK         <- if (THEME == "light") "#1A1A17" else "#F0EFE8"
INK_SOFT    <- if (THEME == "light") "#4A4A44" else "#B8B7B0"
INK_MUTED   <- if (THEME == "light") "#6B6A63" else "#A8A79F"

IMPRINT_PALETTE <- c(
  "#009E73",  # 1 brand green — circle + principal stress markers
  "#C475FD",  # 2 lavender
  "#4467A3",  # 3 blue — point A
  "#BD8233",  # 4 ochre — max shear stress points
  "#AE3030",  # 5 matte red — point B
  "#2ABCCD",  # 6 cyan
  "#954477",  # 7 rose
  "#99B314"   # 8 lime
)

# Stress state (MPa) — structural member under combined axial and shear loading
sigma_x <- 80
sigma_y <- -20
tau_xy  <- 40

# Mohr's circle parameters
center_x    <- (sigma_x + sigma_y) / 2
radius      <- sqrt(((sigma_x - sigma_y) / 2)^2 + tau_xy^2)
sigma_1     <- center_x + radius
sigma_2     <- center_x - radius
tau_max     <- radius
two_theta_p <- atan2(tau_xy, (sigma_x - sigma_y) / 2) * 180 / pi

# Circle path (360 points)
theta_seq <- seq(0, 2 * pi, length.out = 360)
circle_df <- data.frame(
  x = center_x + radius * cos(theta_seq),
  y = radius * sin(theta_seq)
)

# Arc showing 2θp angle (measured from horizontal to line C to A at center)
arc_r   <- radius * 0.28
arc_seq <- seq(0, two_theta_p * pi / 180, length.out = 80)
arc_df  <- data.frame(
  x = center_x + arc_r * cos(arc_seq),
  y = arc_r * sin(arc_seq)
)
mid_angle   <- two_theta_p * pi / 360
arc_label_x <- center_x + arc_r * 1.5 * cos(mid_angle)
arc_label_y <- arc_r * 1.5 * sin(mid_angle)

# Build labels using paste0 with unicode escapes so Edit tool can match ASCII source
sigma_sym  <- "σ"
tau_sym    <- "τ"
theta_sym  <- "θ"
deg_sym    <- "°"
sub1       <- "₁"
sub2       <- "₂"

label_A     <- paste0("A  (", sigma_sym, "x=", sigma_x, ")")
label_B     <- paste0("B  (", sigma_sym, "y=", sigma_y, ")")
label_s1    <- paste0(sigma_sym, "1=", round(sigma_1, 1))
label_s2    <- paste0(sigma_sym, "2=", round(sigma_2, 1))
label_tmax  <- paste0(tau_sym, "max=", round(tau_max, 1))
label_2tp   <- paste0("2", theta_sym, "p=", round(two_theta_p, 1), deg_sym)

# Grid lines with alpha (major and minor differentiated)
grid_color       <- adjustcolor(INK, alpha.f = 0.08)
grid_color_minor <- adjustcolor(INK, alpha.f = 0.05)

p <- ggplot() +
  # Reference lines through center
  geom_hline(yintercept = 0,
             color = adjustcolor(INK_SOFT, alpha.f = 0.55),
             linewidth = 0.5, linetype = "dashed") +
  geom_vline(xintercept = center_x,
             color = adjustcolor(INK_SOFT, alpha.f = 0.55),
             linewidth = 0.5, linetype = "dashed") +
  # Diameter line connecting A and B (passes through center C)
  annotate("segment",
           x = sigma_x, y = tau_xy, xend = sigma_y, yend = -tau_xy,
           color = INK_MUTED, linewidth = 0.8, linetype = "dotted") +
  # Mohr's circle (primary element — Imprint brand green)
  geom_path(data = circle_df, aes(x = x, y = y),
            color = IMPRINT_PALETTE[1], linewidth = 1.5) +
  # Arc showing angle 2θp
  geom_path(data = arc_df, aes(x = x, y = y),
            color = INK_SOFT, linewidth = 0.7) +
  # Center point (filled circle marker)
  annotate("point", x = center_x, y = 0,
           color = INK, fill = PAGE_BG, size = 3.5, shape = 21, stroke = 0.8) +
  # Principal stress points sigma1, sigma2 (where circle meets sigma-axis)
  annotate("point", x = sigma_1, y = 0,
           color = "white", fill = IMPRINT_PALETTE[1], size = 5.5, shape = 23,
           stroke = 0.5) +
  annotate("point", x = sigma_2, y = 0,
           color = "white", fill = IMPRINT_PALETTE[1], size = 5.5, shape = 23,
           stroke = 0.5) +
  # Maximum shear stress points (top and bottom of circle)
  annotate("point", x = center_x, y = tau_max,
           color = "white", fill = IMPRINT_PALETTE[4], size = 4.5, shape = 24,
           stroke = 0.5) +
  annotate("point", x = center_x, y = -tau_max,
           color = "white", fill = IMPRINT_PALETTE[4], size = 4.5, shape = 25,
           stroke = 0.5) +
  # Stress point A (sigma_x, tau_xy) — upper right
  annotate("point", x = sigma_x, y = tau_xy,
           color = "white", fill = IMPRINT_PALETTE[3], size = 5.0, shape = 21,
           stroke = 0.5) +
  # Stress point B (sigma_y, -tau_xy) — lower left
  annotate("point", x = sigma_y, y = -tau_xy,
           color = "white", fill = IMPRINT_PALETTE[5], size = 5.0, shape = 21,
           stroke = 0.5) +
  # Label A: positioned to the left+above to stay within panel
  annotate("text", x = sigma_x - 3, y = tau_xy + 6,
           label = label_A,
           color = IMPRINT_PALETTE[3], hjust = 1, vjust = 0, size = 3.8) +
  # Label B: positioned to the right+below to stay within panel
  annotate("text", x = sigma_y + 3, y = -tau_xy - 6,
           label = label_B,
           color = IMPRINT_PALETTE[5], hjust = 0, vjust = 1, size = 3.8) +
  # Label sigma1: centered below intersection (outside lower arc)
  annotate("text", x = sigma_1, y = -9,
           label = label_s1,
           color = INK, hjust = 0.5, vjust = 1, size = 3.8) +
  # Label sigma2: centered below intersection (outside lower arc)
  annotate("text", x = sigma_2, y = -9,
           label = label_s2,
           color = INK, hjust = 0.5, vjust = 1, size = 3.8) +
  # Label tmax: to the left of top point (toward center)
  annotate("text", x = center_x - 3, y = tau_max + 4,
           label = label_tmax,
           color = IMPRINT_PALETTE[4], hjust = 1, vjust = 0, size = 3.8) +
  # Label 2thetap angle: near midpoint of arc
  annotate("text", x = arc_label_x, y = arc_label_y,
           label = label_2tp,
           color = INK_SOFT, hjust = 0, vjust = 0.5, size = 3.0) +
  coord_fixed(ratio = 1, clip = "off") +
  labs(
    x     = paste0("Normal Stress ", sigma_sym, " (MPa)"),
    y     = paste0("Shear Stress ", tau_sym, " (MPa)"),
    title = "mohr-circle · r · ggplot2 · anyplot.ai"
  ) +
  theme_minimal(base_size = 8) +
  theme(
    plot.background  = element_rect(fill = PAGE_BG, color = PAGE_BG),
    panel.background = element_rect(fill = PAGE_BG, color = NA),
    panel.grid.major = element_line(color = grid_color,       linewidth = 0.3),
    panel.grid.minor = element_line(color = grid_color_minor, linewidth = 0.15),
    panel.border     = element_rect(color = INK_SOFT, fill = NA, linewidth = 0.25),
    axis.title       = element_text(color = INK,      size = 10),
    axis.text        = element_text(color = INK_SOFT, size = 8),
    plot.title       = element_text(color = INK,      size = 12, face = "plain"),
    plot.margin      = margin(40, 50, 20, 30, "pt")
  )

ggsave(
  filename = sprintf("plot-%s.png", THEME),
  plot     = p,
  device   = ragg::agg_png,
  width    = 6,
  height   = 6,
  units    = "in",
  dpi      = 400
)
Runnable source as JSON, for any HTTP client: https://api.anyplot.ai/specs/mohr-circle/ggplot2/code. Any spec id and library id listed in llms-full.txt fit the same URL shape; every URL below is complete and callable.
{
  "spec_id": "mohr-circle",
  "language": "r",
  "library": "ggplot2",
  "page": "https://anyplot.ai/mohr-circle/r/ggplot2",
  "hub": "https://anyplot.ai/mohr-circle",
  "code_json": "https://api.anyplot.ai/specs/mohr-circle/ggplot2/code",
  "spec_json": "https://api.anyplot.ai/specs/mohr-circle",
  "render_light_png": "https://storage.googleapis.com/anyplot-images/plots/mohr-circle/r/ggplot2/plot-light.png",
  "render_dark_png": "https://storage.googleapis.com/anyplot-images/plots/mohr-circle/r/ggplot2/plot-dark.png",
  "quality_score": 89.0,
  "license": "MIT",
  "guide": "https://anyplot.ai/llms.txt"
}
Part of Mohr's Circle for Stress Analysis on anyplot.ai.