The same plot in 14 other libraries — JavaScript: Chart.js, Apache ECharts, Highcharts, MUI X Charts; Python: Altair, Bokeh, lets-plot, Matplotlib, Plotly, plotnine, Pygal, Seaborn; R: ggplot2; Julia: Makie.jl. Compare all 15 side by side: Mohr's Circle for Stress Analysis in Python, R, Julia and JavaScript.
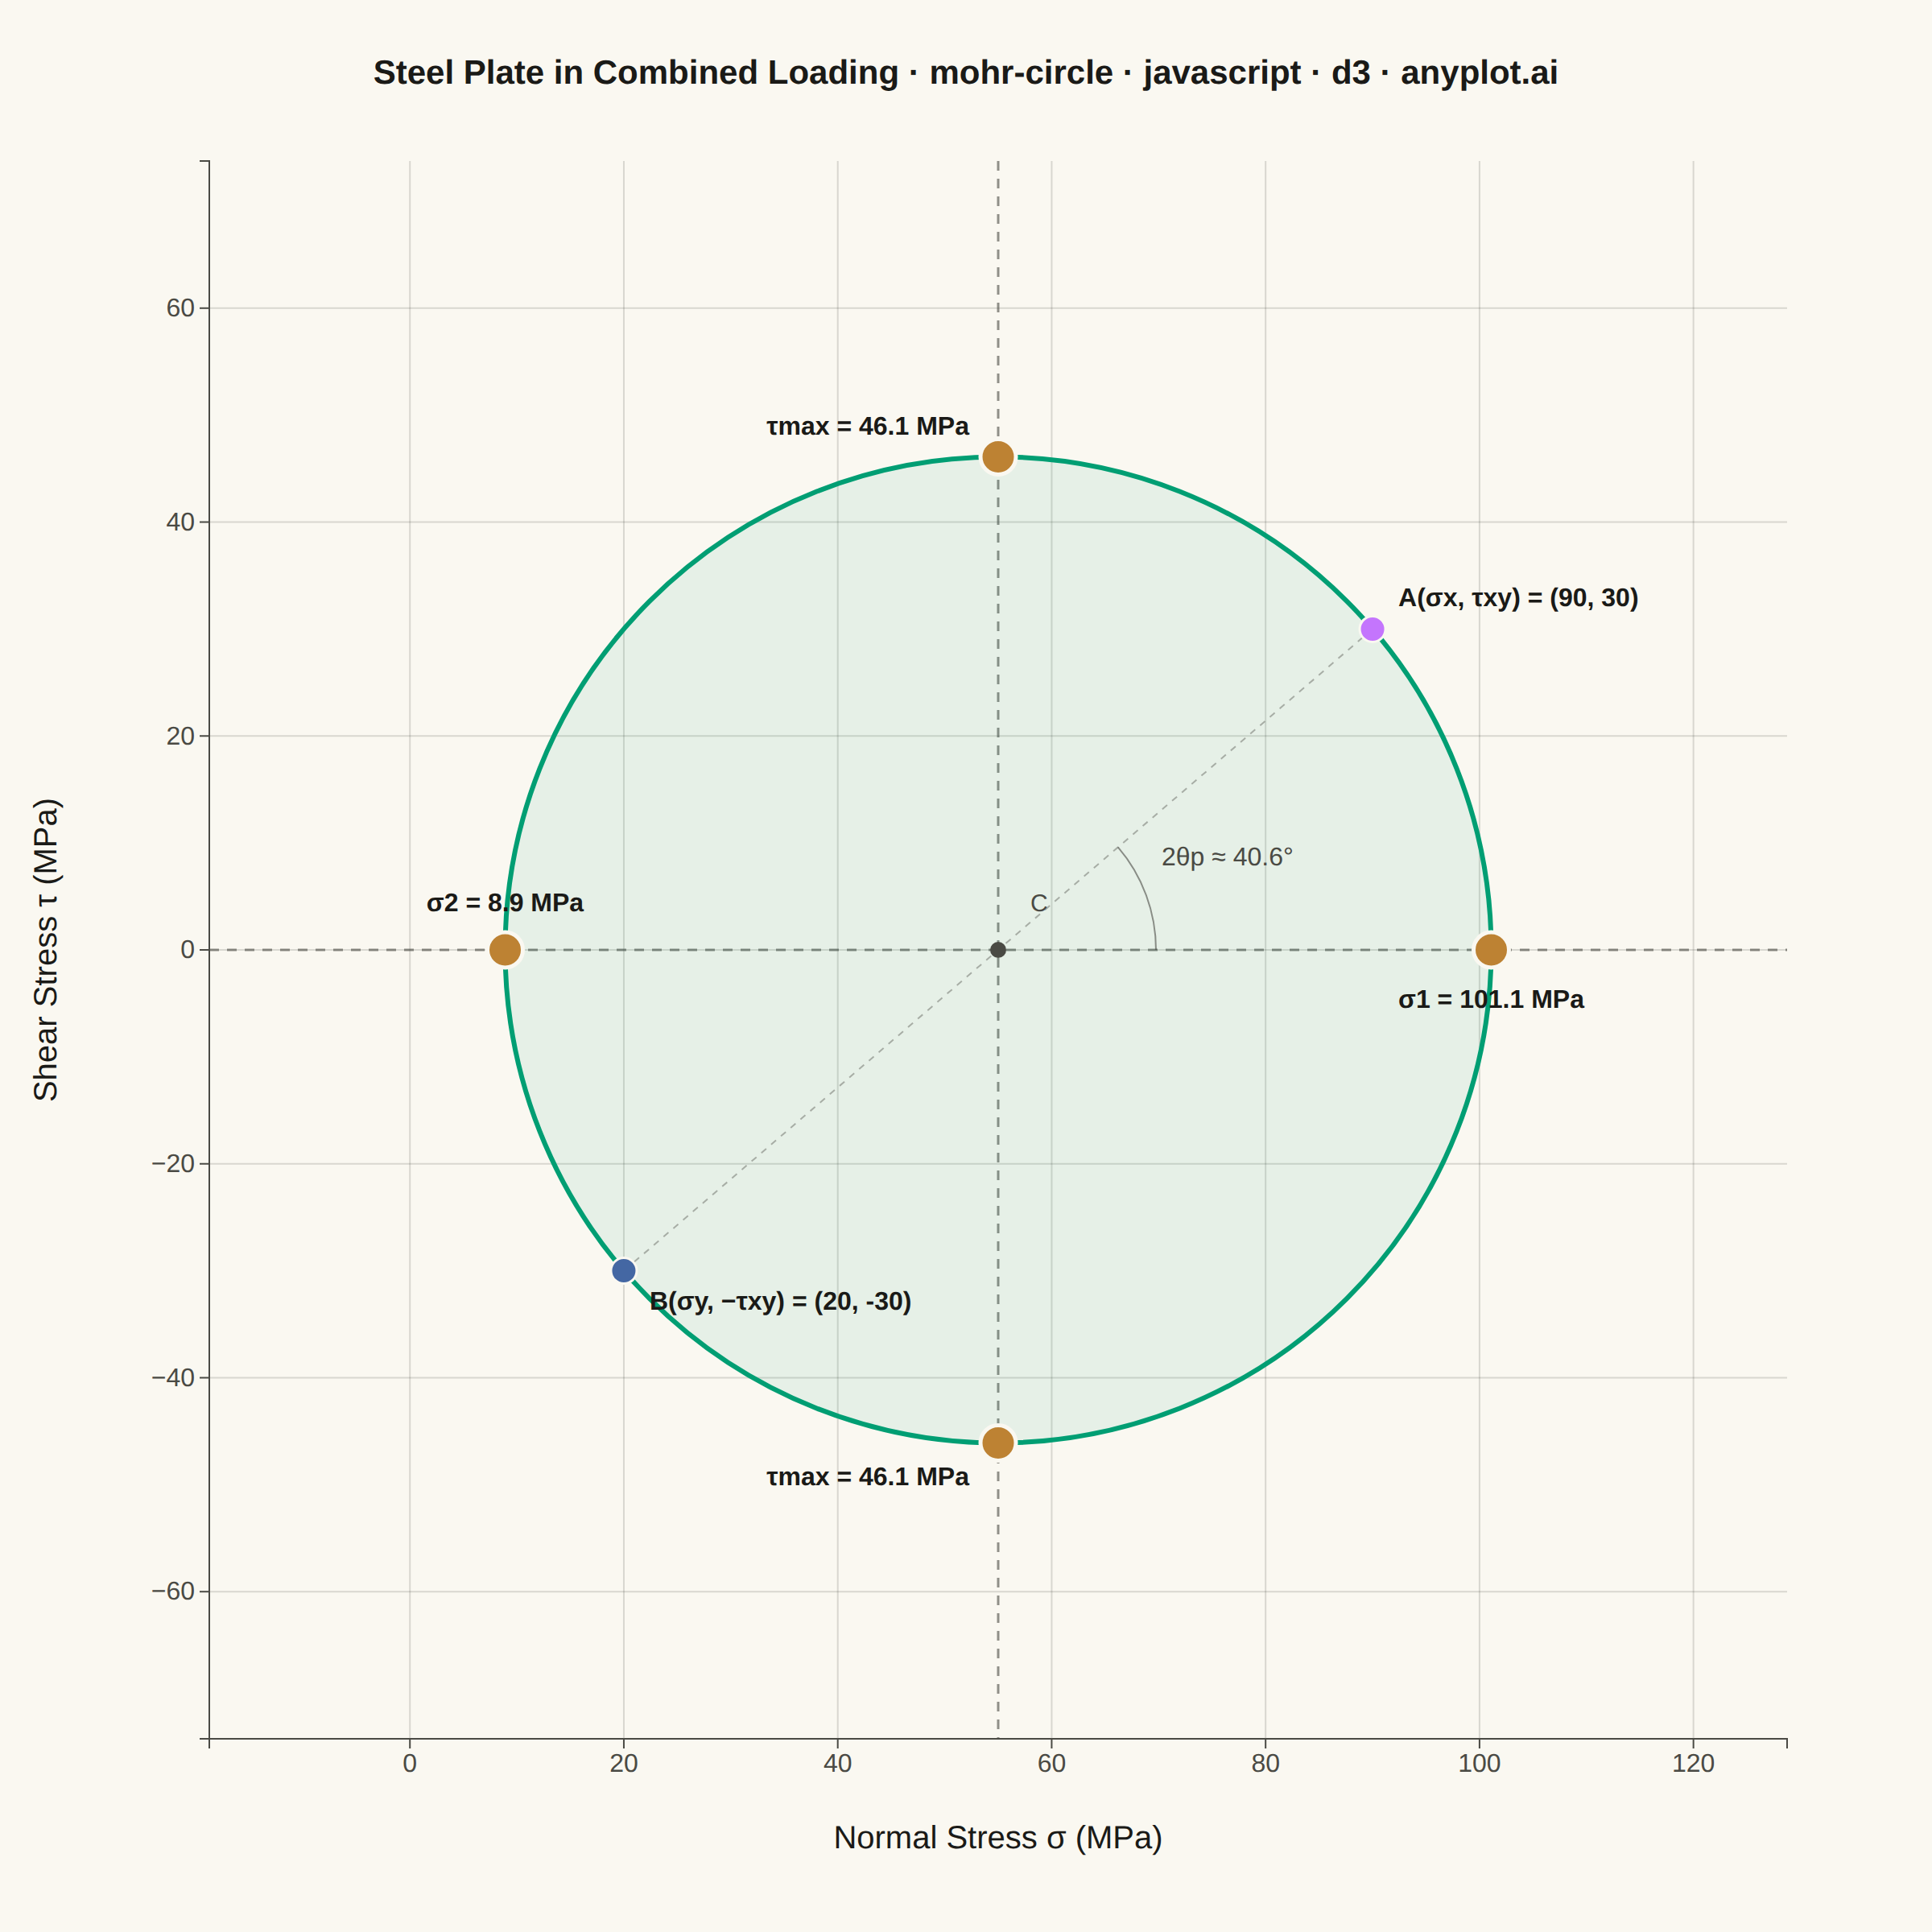
Mohr's Circle is a graphical method used to determine principal stresses, maximum shear stress, and stress transformations from a given 2D stress state. A circle is drawn on a normal stress (σ) vs. shear stress (τ) plane, with the center at ((σx + σy) / 2, 0) and a radius derived from the stress components. It is an essential tool in mechanical and civil engineering for visualizing how stress components change under coordinate rotation.
// anyplot.ai
// mohr-circle: Mohr's Circle for Stress Analysis
// Library: d3 7.9.0 | JavaScript 22.23.2
// Quality: 94/100 | Created: 2026-08-26

//# anyplot-orientation: square
const t = window.ANYPLOT_TOKENS;
const { width, height } = window.ANYPLOT_SIZE;
const margin = { top: 100, right: 90, bottom: 120, left: 130 };
const iw = width - margin.left - margin.right;
const ih = height - margin.top - margin.bottom;

// --- Data: a steel plate element under combined loading (in-memory, fixed) --
const sigmaX = 90; // normal stress, x-face (MPa)
const sigmaY = 20; // normal stress, y-face (MPa)
const tauXY = 30; // shear stress, xy-plane (MPa)

const center = (sigmaX + sigmaY) / 2;
const radius = Math.sqrt(((sigmaX - sigmaY) / 2) ** 2 + tauXY ** 2);
const sigma1 = center + radius; // major principal stress
const sigma2 = center - radius; // minor principal stress
const tauMax = radius; // maximum shear stress
const thetaA = Math.atan2(tauXY, sigmaX - center); // 2*theta_p, radians
const thetaDeg = (thetaA * 180) / Math.PI;

// --- Scales: equal span on both axes keeps the circle a true circle --------
const halfSpan = radius * 1.6;
const x = d3.scaleLinear().domain([center - halfSpan, center + halfSpan]).range([0, iw]);
const y = d3.scaleLinear().domain([-halfSpan, halfSpan]).range([ih, 0]);
const unitPx = iw / (2 * halfSpan); // pixels per MPa, identical on both axes

const cx = x(center);
const cy = y(0);
const rPx = radius * unitPx;

// point helper: polar offset from the circle center, math convention (ccw, y up)
const polar = (rStress, thetaRad) => ({
  px: cx + rStress * unitPx * Math.cos(thetaRad),
  py: cy - rStress * unitPx * Math.sin(thetaRad),
});

// --- SVG mount ---------------------------------------------------------------
const svg = d3.select("#container").append("svg").attr("width", width).attr("height", height);
const g = svg.append("g").attr("transform", `translate(${margin.left},${margin.top})`);

// --- Grid ---------------------------------------------------------------------
const xAxisGrid = d3.axisBottom(x).ticks(6).tickSize(-ih).tickFormat("");
const yAxisGrid = d3.axisLeft(y).ticks(6).tickSize(-iw).tickFormat("");
g.append("g").attr("transform", `translate(0,${ih})`).call(xAxisGrid)
  .call((sel) => sel.select(".domain").remove())
  .selectAll("line").attr("stroke", t.grid);
g.append("g").call(yAxisGrid)
  .call((sel) => sel.select(".domain").remove())
  .selectAll("line").attr("stroke", t.grid);

// --- Reference lines through the circle center --------------------------------
g.append("line")
  .attr("x1", 0).attr("x2", iw).attr("y1", cy).attr("y2", cy)
  .attr("stroke", t.inkSoft).attr("stroke-width", 1.5)
  .attr("stroke-dasharray", "6,5").attr("opacity", 0.6);
g.append("line")
  .attr("x1", cx).attr("x2", cx).attr("y1", 0).attr("y2", ih)
  .attr("stroke", t.inkSoft).attr("stroke-width", 1.5)
  .attr("stroke-dasharray", "6,5").attr("opacity", 0.6);

// --- Axes -----------------------------------------------------------------
const xAxis = g.append("g").attr("transform", `translate(0,${ih})`).call(d3.axisBottom(x).ticks(6));
const yAxis = g.append("g").call(d3.axisLeft(y).ticks(6));
for (const ax of [xAxis, yAxis]) {
  ax.selectAll("text").attr("fill", t.inkSoft).style("font-size", "16px");
  ax.selectAll("line").attr("stroke", t.inkSoft);
  ax.select(".domain").attr("stroke", t.inkSoft);
}

g.append("text")
  .attr("x", iw / 2).attr("y", ih + 68).attr("text-anchor", "middle")
  .attr("fill", t.ink).style("font-size", "20px")
  .text("Normal Stress σ (MPa)");
g.append("text")
  .attr("transform", "rotate(-90)")
  .attr("x", -ih / 2).attr("y", -95).attr("text-anchor", "middle")
  .attr("fill", t.ink).style("font-size", "20px")
  .text("Shear Stress τ (MPa)");

// --- Mohr's circle -------------------------------------------------------------
g.append("circle")
  .attr("cx", cx).attr("cy", cy).attr("r", rPx)
  .attr("fill", t.palette[0]).attr("fill-opacity", 0.08)
  .attr("stroke", t.palette[0]).attr("stroke-width", 3);

// --- Diameter through A and B (secondary construction geometry, de-emphasized) --
const A = { sigma: sigmaX, tau: tauXY };
const B = { sigma: sigmaY, tau: -tauXY };
g.append("line")
  .attr("x1", x(A.sigma)).attr("y1", y(A.tau))
  .attr("x2", x(B.sigma)).attr("y2", y(B.tau))
  .attr("stroke", t.inkSoft).attr("stroke-width", 1).attr("stroke-dasharray", "4,4").attr("opacity", 0.4);

// --- Angle 2*theta_p arc, from the sigma1 axis to point A (also de-emphasized) --
const arcRStress = radius * 0.32;
const arcStart = polar(arcRStress, 0);
const arcEnd = polar(arcRStress, thetaA);
const sweep = thetaA > 0 ? 1 : 0;
const path = d3.path();
path.moveTo(arcStart.px, arcStart.py);
path.arc(cx, cy, arcRStress * unitPx, 0, -thetaA, sweep === 1);
g.append("path").attr("d", path.toString())
  .attr("fill", "none").attr("stroke", t.inkSoft).attr("stroke-width", 1).attr("opacity", 0.6);

const arcMid = polar(arcRStress * 1.55, thetaA / 2);
g.append("text")
  .attr("x", arcMid.px).attr("y", arcMid.py).attr("text-anchor", "middle")
  .attr("fill", t.inkSoft).style("font-size", "16px")
  .text(`2θp ≈ ${thetaDeg.toFixed(1)}°`);

// --- Center point C ---------------------------------------------------------------
g.append("circle").attr("cx", cx).attr("cy", cy).attr("r", 5).attr("fill", t.inkSoft);
g.append("text")
  .attr("x", cx + 20).attr("y", cy - 24)
  .attr("fill", t.inkSoft).style("font-size", "15px")
  .text("C");

// --- Stress points A and B (construction points, data-bound) ----------------------
const stressPoints = [
  { p: A, label: `A(σx, τxy) = (${A.sigma}, ${A.tau})`, color: t.palette[1], dx: 16, dy: -14 },
  { p: B, label: `B(σy, −τxy) = (${B.sigma}, ${B.tau})`, color: t.palette[2], dx: 16, dy: 24 },
];
const stressG = g.selectAll(null).data(stressPoints).join("g").attr("class", "stress-point");
stressG.append("circle")
  .attr("cx", (d) => x(d.p.sigma)).attr("cy", (d) => y(d.p.tau)).attr("r", 8)
  .attr("fill", (d) => d.color).attr("stroke", t.pageBg).attr("stroke-width", 1.5);
stressG.append("text")
  .attr("x", (d) => x(d.p.sigma) + d.dx).attr("y", (d) => y(d.p.tau) + d.dy)
  .attr("fill", t.ink).style("font-size", "16px").style("font-weight", "600")
  .text((d) => d.label);

// --- Principal stresses (sigma1, sigma2) and maximum shear stress: the focal point,
// bolder than the A/B construction points above, drawn last so they read on top ---
const extremes = [
  { px: x(sigma1), py: y(0), label: `σ1 = ${sigma1.toFixed(1)} MPa`, dx: 0, dy: 36, anchor: "middle" },
  { px: x(sigma2), py: y(0), label: `σ2 = ${sigma2.toFixed(1)} MPa`, dx: 0, dy: -24, anchor: "middle" },
  { px: cx, py: y(tauMax), label: `τmax = ${tauMax.toFixed(1)} MPa`, dx: -18, dy: -14, anchor: "end" },
  { px: cx, py: y(-tauMax), label: `τmax = ${tauMax.toFixed(1)} MPa`, dx: -18, dy: 26, anchor: "end" },
];
const extremeG = g.selectAll(null).data(extremes).join("g").attr("class", "extreme-point");
extremeG.append("circle")
  .attr("cx", (d) => d.px).attr("cy", (d) => d.py).attr("r", 11)
  .attr("fill", t.palette[3]).attr("stroke", t.pageBg).attr("stroke-width", 2.5);
extremeG.append("text")
  .attr("x", (d) => d.px + d.dx).attr("y", (d) => d.py + d.dy).attr("text-anchor", (d) => d.anchor)
  .attr("fill", t.ink).style("font-size", "16px").style("font-weight", "700")
  .text((d) => d.label);

// --- Title ----------------------------------------------------------------------
const titleText = "Steel Plate in Combined Loading · mohr-circle · javascript · d3 · anyplot.ai";
const titleFontSize = Math.max(15, Math.round(24 * Math.min(1, 67 / titleText.length)));
svg.append("text")
  .attr("x", width / 2).attr("y", 52).attr("text-anchor", "middle")
  .attr("fill", t.ink).style("font-size", `${titleFontSize}px`).style("font-weight", "600")
  .text(titleText);
Runnable source as JSON, for any HTTP client: https://api.anyplot.ai/specs/mohr-circle/d3/code. Any spec id and library id listed in llms-full.txt fit the same URL shape; every URL below is complete and callable.
{
  "spec_id": "mohr-circle",
  "language": "javascript",
  "library": "d3",
  "page": "https://anyplot.ai/mohr-circle/javascript/d3",
  "hub": "https://anyplot.ai/mohr-circle",
  "code_json": "https://api.anyplot.ai/specs/mohr-circle/d3/code",
  "spec_json": "https://api.anyplot.ai/specs/mohr-circle",
  "render_light_png": "https://storage.googleapis.com/anyplot-images/plots/mohr-circle/javascript/d3/plot-light.png",
  "render_dark_png": "https://storage.googleapis.com/anyplot-images/plots/mohr-circle/javascript/d3/plot-dark.png",
  "interactive_light_html": "https://storage.googleapis.com/anyplot-images/plots/mohr-circle/javascript/d3/plot-light.html",
  "interactive_dark_html": "https://storage.googleapis.com/anyplot-images/plots/mohr-circle/javascript/d3/plot-dark.html",
  "quality_score": 94.0,
  "license": "MIT",
  "guide": "https://anyplot.ai/llms.txt"
}
Part of Mohr's Circle for Stress Analysis on anyplot.ai.