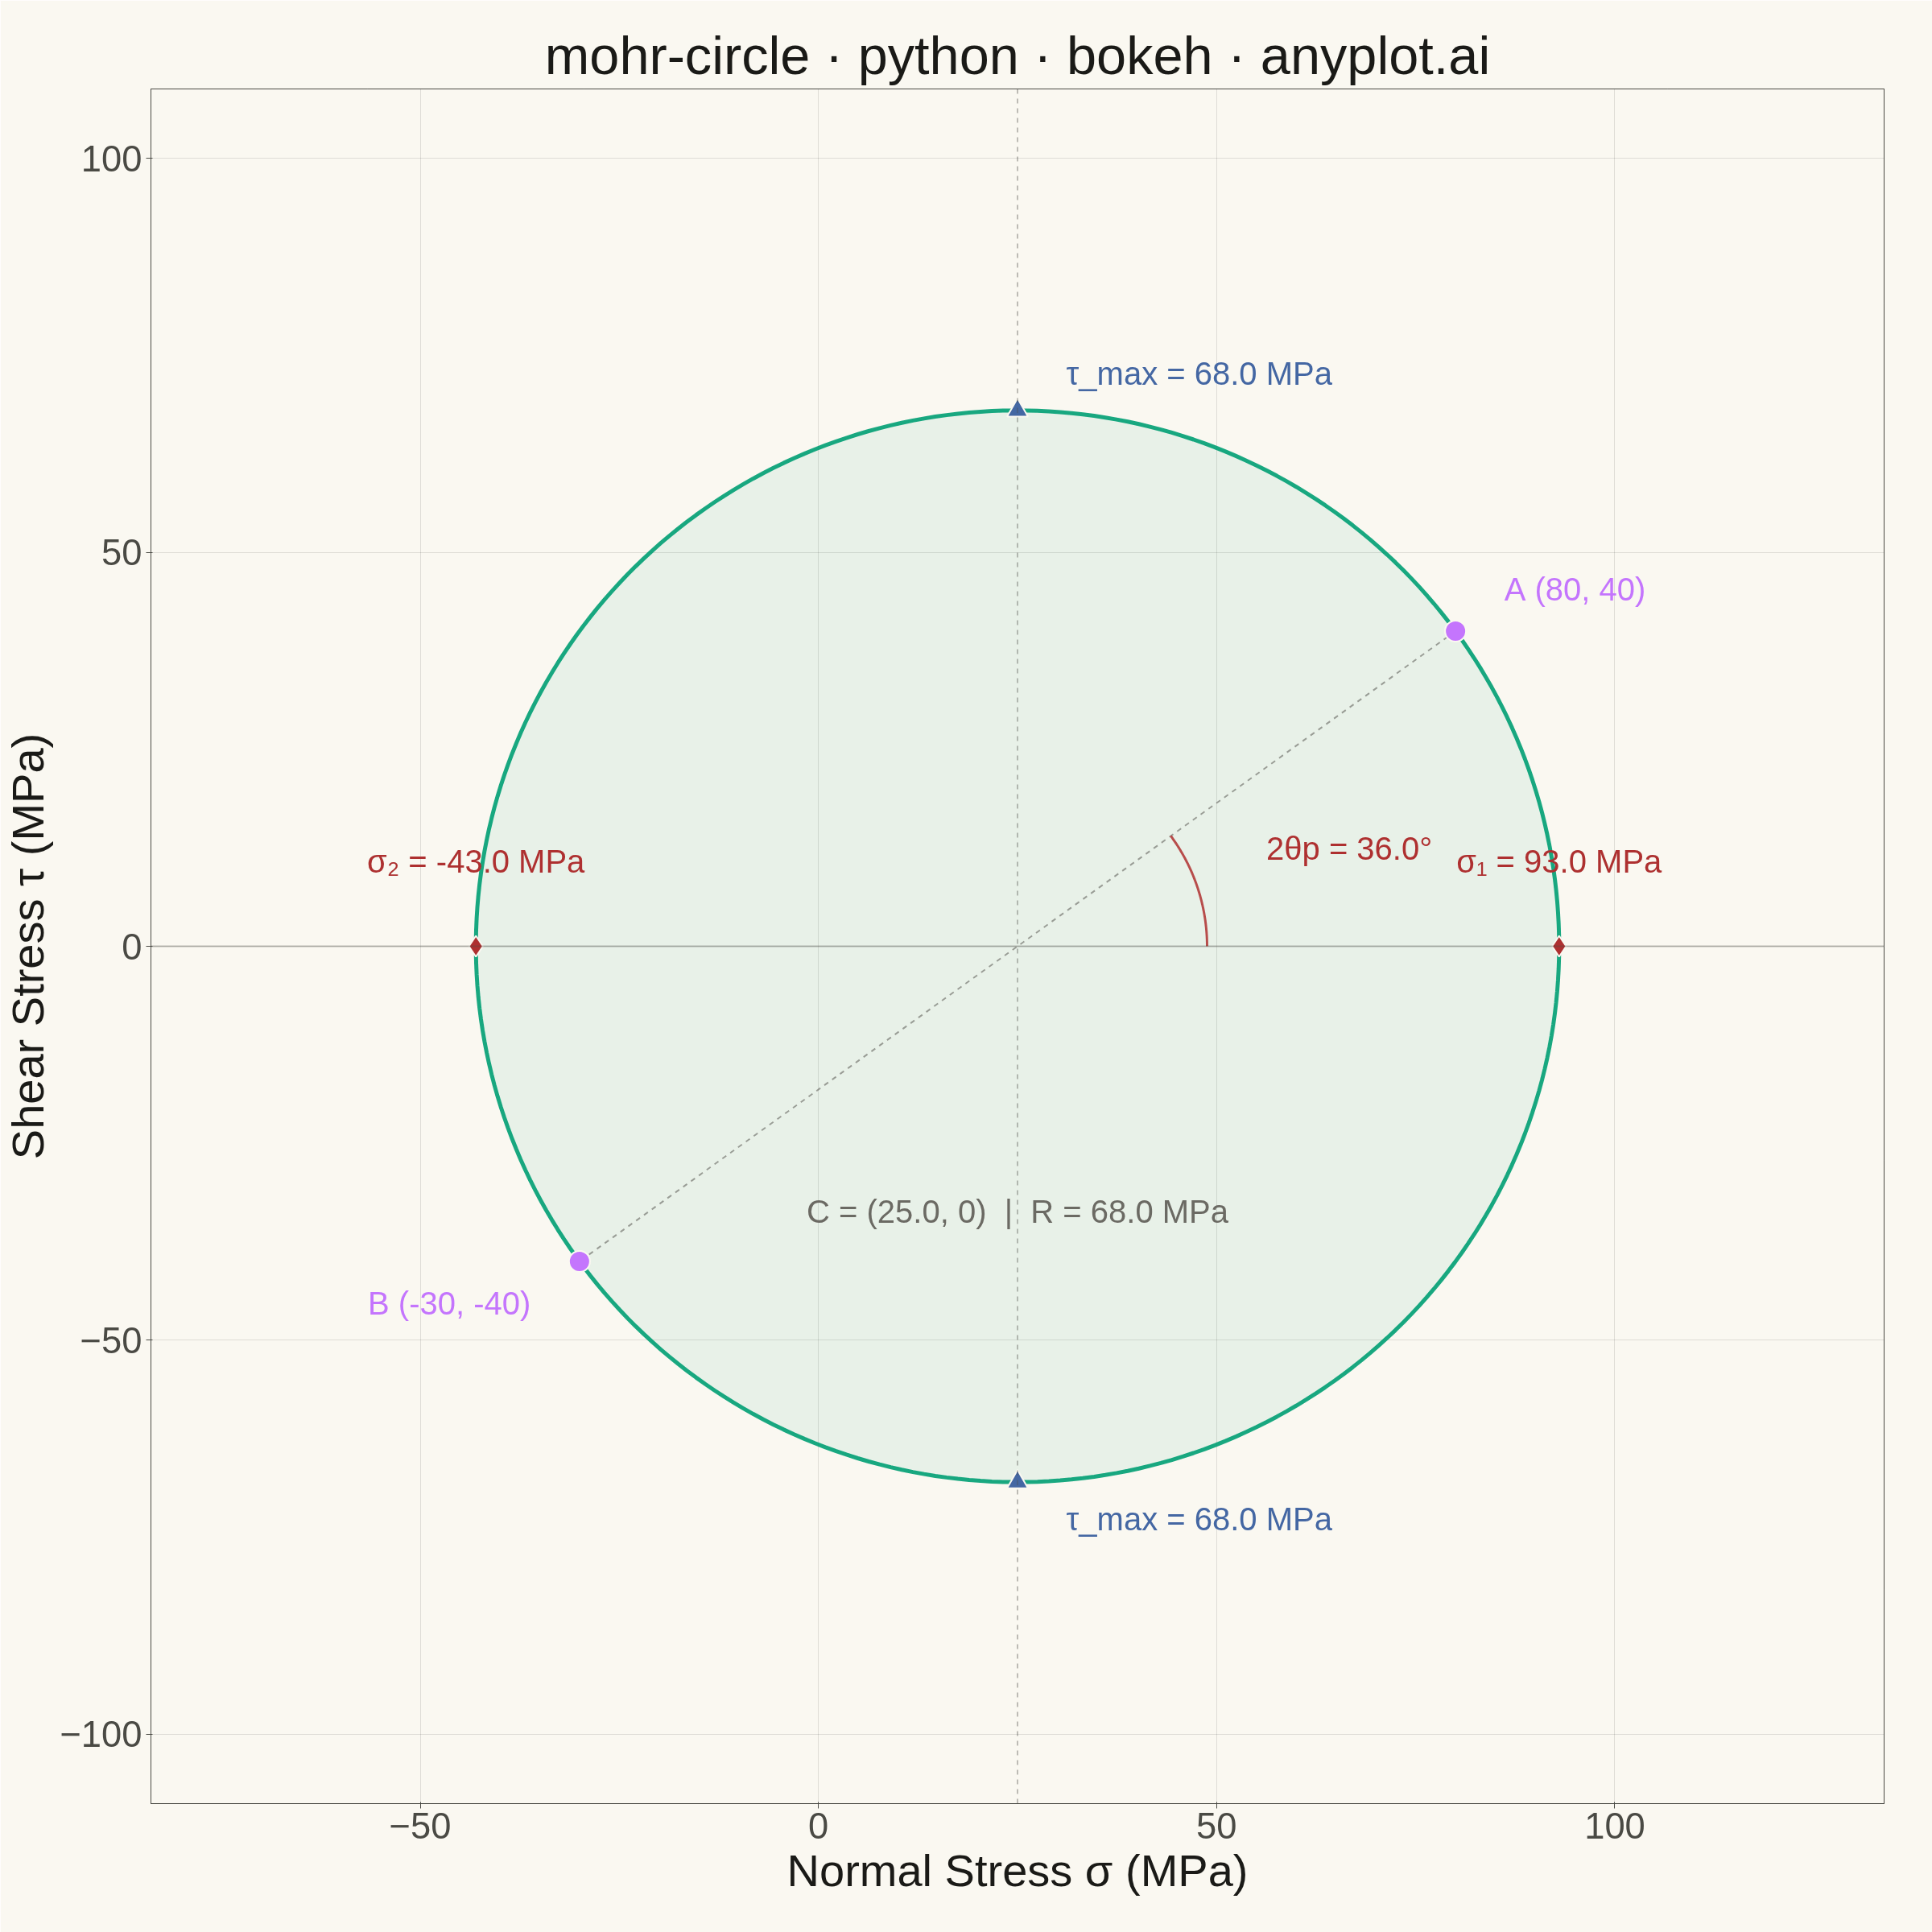
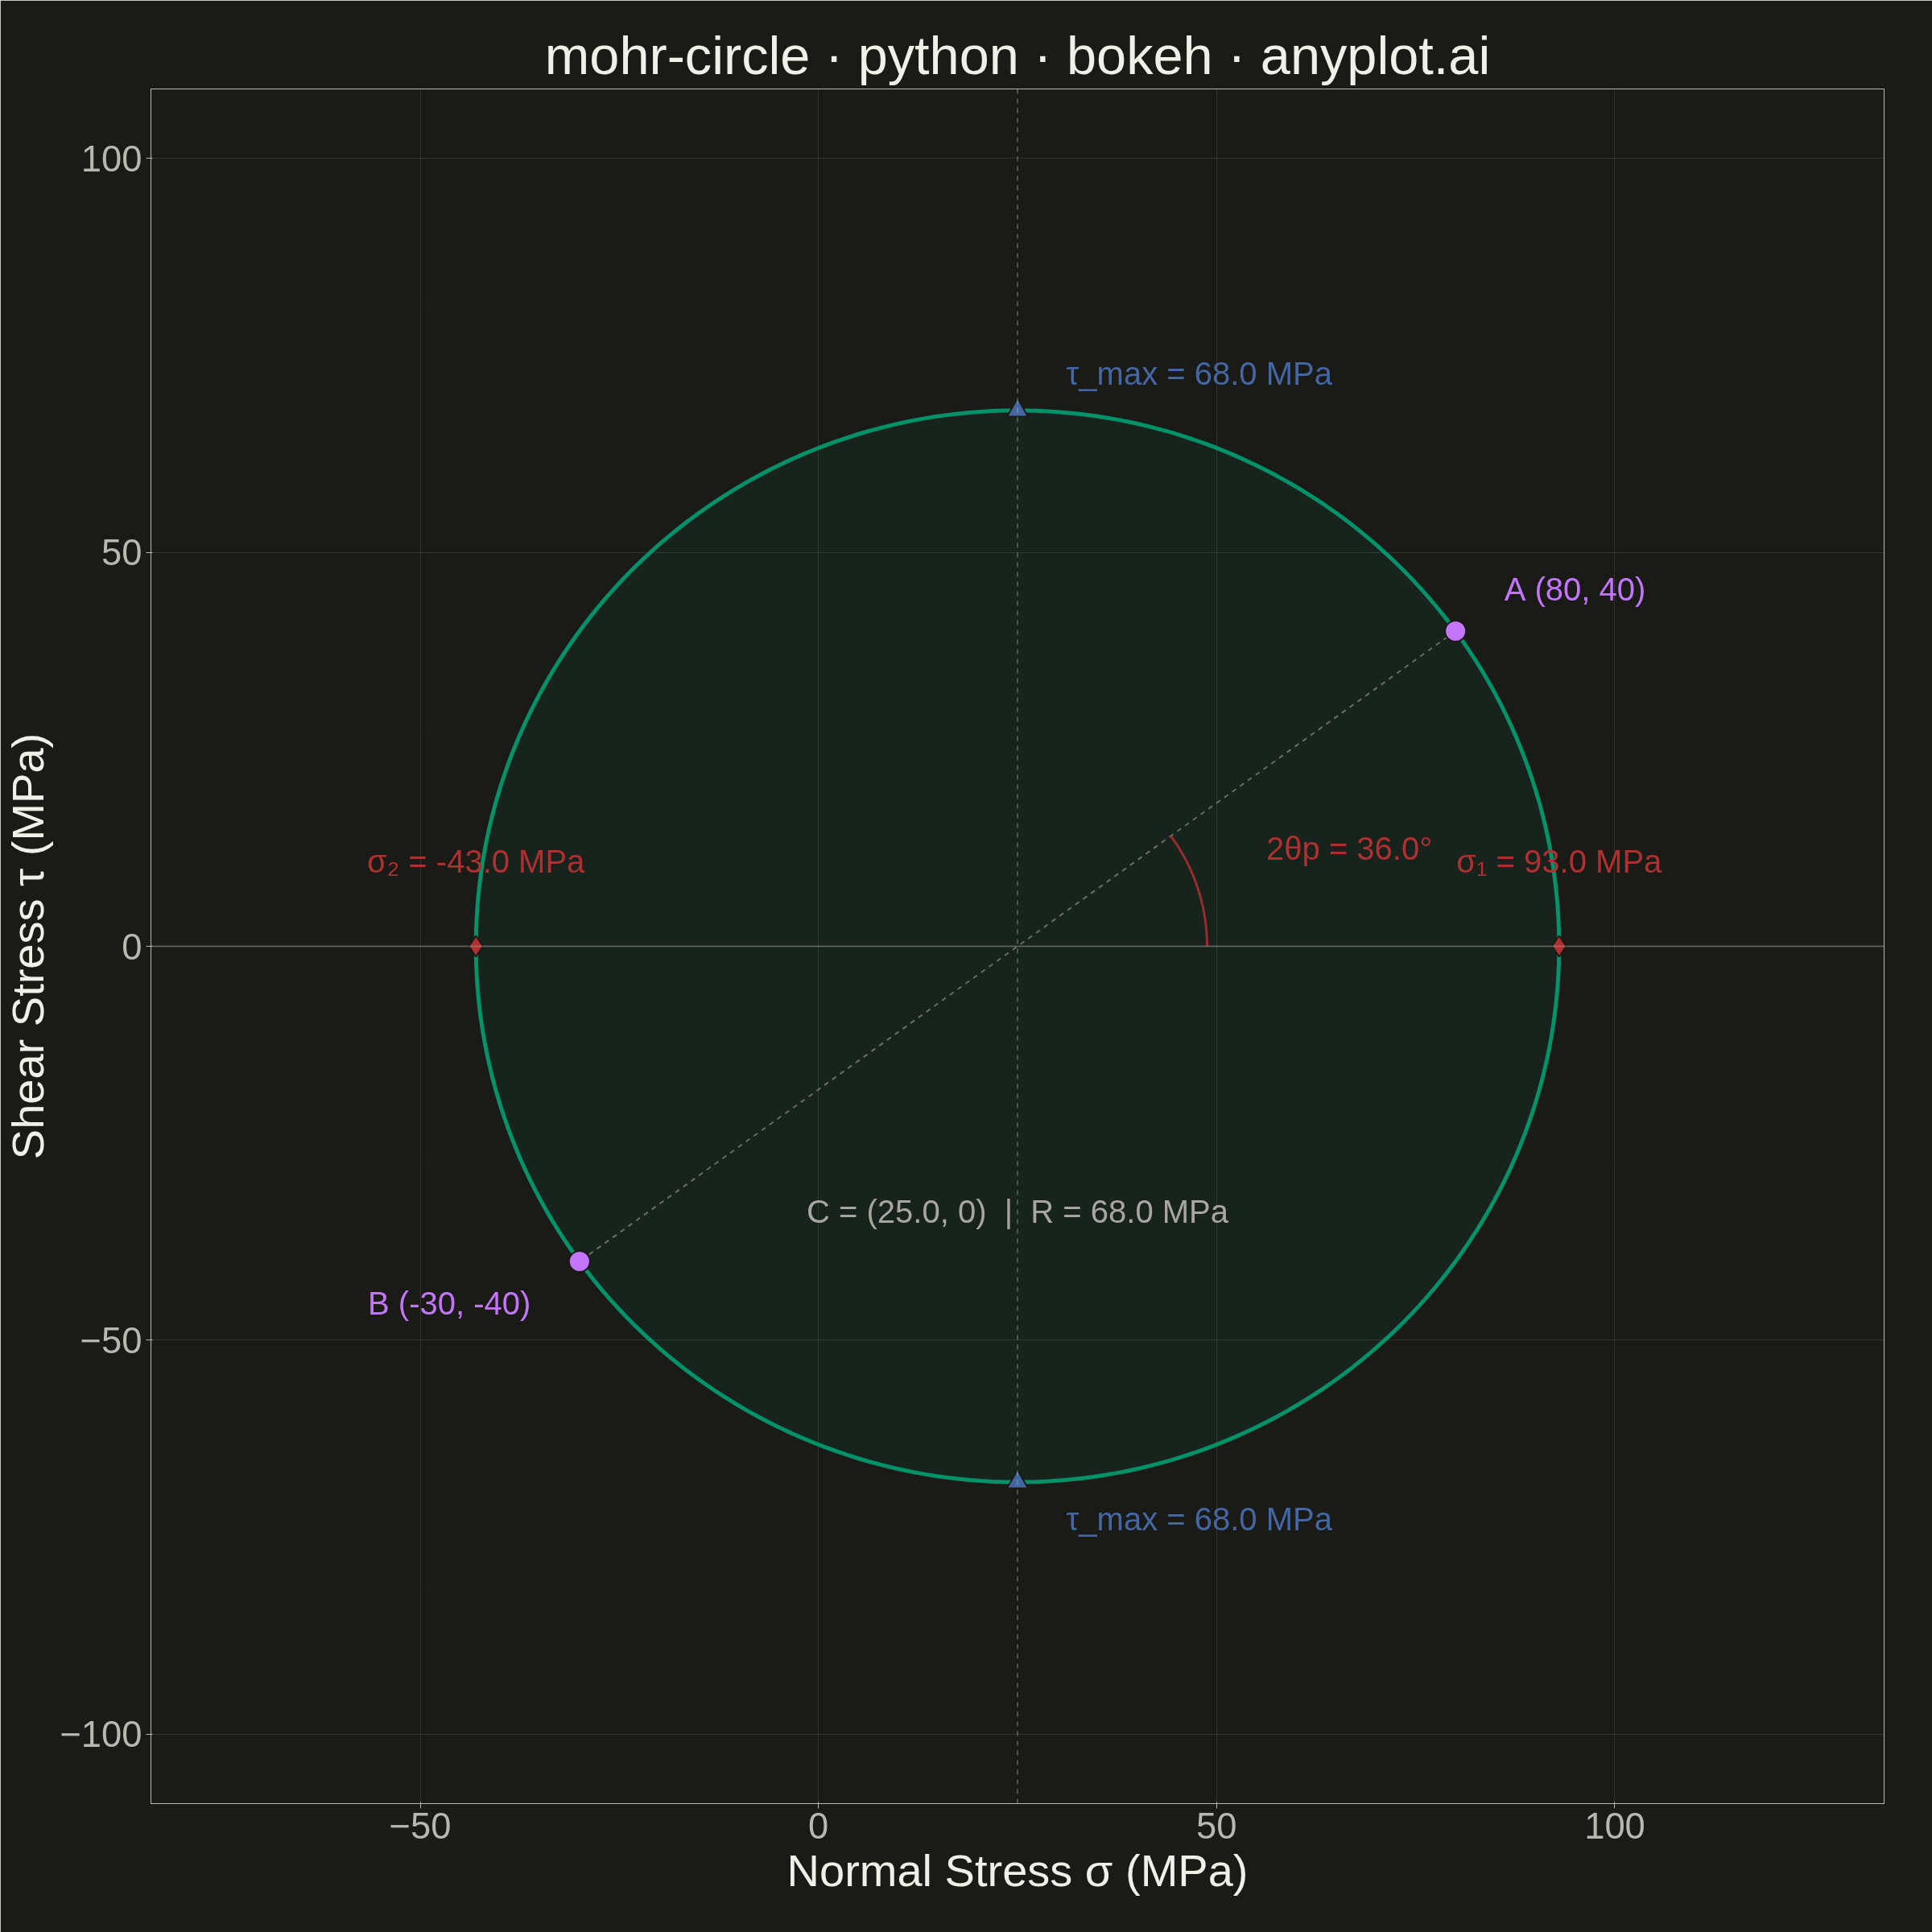
Mohr's Circle is a graphical method used to determine principal stresses, maximum shear stress, and stress transformations from a given 2D stress state. A circle is drawn on a normal stress (σ) vs. shear stress (τ) plane, with the center at ((σx + σy) / 2, 0) and a radius derived from the stress components. It is an essential tool in mechanical and civil engineering for visualizing how stress components change under coordinate rotation.
""" anyplot.ai
mohr-circle: Mohr's Circle for Stress Analysis
Library: bokeh 3.9.0 | Python 3.13.13
Quality: 93/100 | Updated: 2026-05-30
"""

import os
import sys


# Prevent self-import: this file is named bokeh.py, so Python's path search would
# find it before the installed bokeh package. Remove the script's own directory
# from sys.path so `from bokeh.io import …` resolves to the installed package.
_own_dir = os.path.dirname(os.path.abspath(__file__))
sys.path = [p for p in sys.path if os.path.abspath(p) != _own_dir]

import time
from pathlib import Path

import numpy as np
from bokeh.io import output_file, save
from bokeh.models import ColumnDataSource, HoverTool, Label, Span
from bokeh.plotting import figure
from selenium import webdriver
from selenium.webdriver.chrome.options import Options


# Theme tokens (Imprint palette — theme-adaptive chrome)
THEME = os.getenv("ANYPLOT_THEME", "light")
PAGE_BG = "#FAF8F1" if THEME == "light" else "#1A1A17"
ELEVATED_BG = "#FFFDF6" if THEME == "light" else "#242420"
INK = "#1A1A17" if THEME == "light" else "#F0EFE8"
INK_SOFT = "#4A4A44" if THEME == "light" else "#B8B7B0"
INK_MUTED = "#6B6A63" if THEME == "light" else "#A8A79F"

# Imprint categorical palette — hybrid-v3 sort, theme-independent
IMPRINT_PALETTE = [
    "#009E73",  # 1: brand green  — ALWAYS first series (the circle)
    "#C475FD",  # 2: lavender
    "#4467A3",  # 3: blue         — max shear stress
    "#BD8233",  # 4: ochre
    "#AE3030",  # 5: matte red    — semantic anchor for critical/failure
]
BRAND = IMPRINT_PALETTE[0]  # "#009E73"
COLOR_PRINCIPAL = IMPRINT_PALETTE[4]  # matte red — semantic: principal stresses at failure threshold
COLOR_SHEAR = IMPRINT_PALETTE[2]  # blue — maximum shear stress
COLOR_POINTS = IMPRINT_PALETTE[1]  # lavender — input stress points A and B

# Data — typical combined loading stress state (structural beam cross-section)
sigma_x = 80  # MPa (tensile, x-face normal stress)
sigma_y = -30  # MPa (compressive, y-face normal stress)
tau_xy = 40  # MPa (shear stress)

# Mohr's circle geometry
center = (sigma_x + sigma_y) / 2
radius = np.sqrt(((sigma_x - sigma_y) / 2) ** 2 + tau_xy**2)
sigma_1 = center + radius  # major principal stress
sigma_2 = center - radius  # minor principal stress
tau_max = radius  # maximum shear stress
theta_p = 0.5 * np.arctan2(2 * tau_xy, sigma_x - sigma_y)
theta_p_deg = np.degrees(theta_p)

# Circle parametric points (300 segments for smooth curve)
theta = np.linspace(0, 2 * np.pi, 300)
circle_x = center + radius * np.cos(theta)
circle_y = radius * np.sin(theta)

# Stress state points on the circle
ax_pt = (sigma_x, tau_xy)  # Point A: face with σx, τxy
bx_pt = (sigma_y, -tau_xy)  # Point B: face with σy, −τxy

# ColumnDataSources for interactive HoverTool readouts
principal_source = ColumnDataSource(
    data={
        "x": [sigma_1, sigma_2],
        "y": [0, 0],
        "label": ["σ₁ (Major Principal)", "σ₂ (Minor Principal)"],
        "sigma": [f"{sigma_1:.1f}", f"{sigma_2:.1f}"],
        "tau": ["0.0", "0.0"],
    }
)

shear_source = ColumnDataSource(
    data={
        "x": [center, center],
        "y": [tau_max, -tau_max],
        "label": ["τ_max (Top)", "τ_max (Bottom)"],
        "sigma": [f"{center:.1f}", f"{center:.1f}"],
        "tau": [f"{tau_max:.1f}", f"{-tau_max:.1f}"],
    }
)

stress_source = ColumnDataSource(
    data={
        "x": [ax_pt[0], bx_pt[0]],
        "y": [ax_pt[1], bx_pt[1]],
        "label": ["Point A (σx, τxy)", "Point B (σy, −τxy)"],
        "sigma": [f"{ax_pt[0]:.1f}", f"{bx_pt[0]:.1f}"],
        "tau": [f"{ax_pt[1]:.1f}", f"{bx_pt[1]:.1f}"],
    }
)

# Plot — square canvas (2400×2400) for equal-aspect-ratio circle rendering
padding = radius * 0.6
title = "mohr-circle · python · bokeh · anyplot.ai"

p = figure(
    width=2400,
    height=2400,
    title=title,
    x_axis_label="Normal Stress σ (MPa)",
    y_axis_label="Shear Stress τ (MPa)",
    x_range=(sigma_2 - padding, sigma_1 + padding),
    y_range=(-tau_max - padding, tau_max + padding),
    match_aspect=True,
    toolbar_location=None,  # prevents toolbar from adding height to the screenshot
    min_border_bottom=160,  # room for 34pt tick labels + 42pt axis label
    min_border_left=180,
    min_border_top=110,  # room for 50pt title
    min_border_right=60,
)

# Reference lines: horizontal τ=0 axis and vertical through circle center
ref_h = Span(location=0, dimension="width", line_color=INK_SOFT, line_width=2, line_alpha=0.35)
ref_v = Span(
    location=center, dimension="height", line_color=INK_SOFT, line_width=2, line_alpha=0.35, line_dash="dashed"
)
p.add_layout(ref_h)
p.add_layout(ref_v)

# Mohr's circle — brand green fill + outline (primary element)
p.patch(circle_x.tolist(), circle_y.tolist(), fill_color=BRAND, fill_alpha=0.07, line_color=None)
p.line(circle_x, circle_y, line_color=BRAND, line_width=5, line_alpha=0.9)

# Diameter line connecting A–B through center
p.line(
    [ax_pt[0], bx_pt[0]], [ax_pt[1], bx_pt[1]], line_color=INK_SOFT, line_width=2, line_dash="dashed", line_alpha=0.5
)

# Principal stress markers — matte red diamonds (semantic: critical failure-limit values)
principal_r = p.scatter(
    "x",
    "y",
    source=principal_source,
    size=26,
    color=COLOR_PRINCIPAL,
    marker="diamond",
    line_color=PAGE_BG,
    line_width=2,
)

# Maximum shear stress markers — blue triangles
shear_r = p.scatter(
    "x", "y", source=shear_source, size=26, color=COLOR_SHEAR, marker="triangle", line_color=PAGE_BG, line_width=2
)

# Input stress state points A and B — lavender circles
stress_r = p.scatter("x", "y", source=stress_source, size=26, color=COLOR_POINTS, line_color=PAGE_BG, line_width=2)

# HoverTool for interactive stress readouts over all key points
hover = HoverTool(
    renderers=[principal_r, shear_r, stress_r],
    tooltips=[("Point", "@label"), ("σ (MPa)", "@sigma"), ("τ (MPa)", "@tau")],
)
p.add_tools(hover)

# Angle arc showing 2θp rotation from stress point A to principal axis
angle_2tp = np.arctan2(tau_xy, sigma_x - center)
arc_radius = radius * 0.35
arc_angles = np.linspace(0, angle_2tp, 60)
arc_x = center + arc_radius * np.cos(arc_angles)
arc_y = arc_radius * np.sin(arc_angles)
p.line(arc_x, arc_y, line_color=COLOR_PRINCIPAL, line_width=3, line_alpha=0.85)

# Annotations — label font scaled for readability at 2400px
offset_lg = radius * 0.09
ann_sz = "30pt"

p.add_layout(
    Label(
        x=sigma_1,
        y=offset_lg * 1.4,
        text=f"σ₁ = {sigma_1:.1f} MPa",
        text_font_size=ann_sz,
        text_color=COLOR_PRINCIPAL,
        text_align="center",
    )
)
p.add_layout(
    Label(
        x=sigma_2,
        y=offset_lg * 1.4,
        text=f"σ₂ = {sigma_2:.1f} MPa",
        text_font_size=ann_sz,
        text_color=COLOR_PRINCIPAL,
        text_align="center",
    )
)
p.add_layout(
    Label(
        x=center + offset_lg,
        y=tau_max + offset_lg * 0.4,
        text=f"τ_max = {tau_max:.1f} MPa",
        text_font_size=ann_sz,
        text_color=COLOR_SHEAR,
    )
)
p.add_layout(
    Label(
        x=center + offset_lg,
        y=-tau_max - offset_lg * 0.4,
        text=f"τ_max = {tau_max:.1f} MPa",
        text_font_size=ann_sz,
        text_color=COLOR_SHEAR,
        text_baseline="top",
    )
)
p.add_layout(
    Label(
        x=ax_pt[0] + offset_lg,
        y=ax_pt[1] + offset_lg * 0.5,
        text=f"A ({sigma_x}, {tau_xy})",
        text_font_size=ann_sz,
        text_color=COLOR_POINTS,
    )
)
p.add_layout(
    Label(
        x=bx_pt[0] - offset_lg,
        y=bx_pt[1] - offset_lg * 0.5,
        text=f"B ({sigma_y}, {-tau_xy})",
        text_font_size=ann_sz,
        text_color=COLOR_POINTS,
        text_align="right",
        text_baseline="top",
    )
)
p.add_layout(
    Label(
        x=center,
        y=-padding * 0.88,
        text=f"C = ({center:.1f}, 0)  |  R = {radius:.1f} MPa",
        text_font_size=ann_sz,
        text_color=INK_MUTED,
        text_align="center",
    )
)

# 2θp angle label positioned along the arc midpoint
arc_mid = angle_2tp / 2
label_r = arc_radius * 1.38
p.add_layout(
    Label(
        x=center + label_r * np.cos(arc_mid),
        y=label_r * np.sin(arc_mid),
        text=f"2θp = {2 * theta_p_deg:.1f}°",
        text_font_size=ann_sz,
        text_color=COLOR_PRINCIPAL,
    )
)

# Chrome — title/axis/tick sizing per bokeh.md (50pt / 42pt / 34pt)
p.title.text_font_size = "50pt"
p.title.text_color = INK
p.title.align = "center"
p.title.text_font_style = "normal"

p.xaxis.axis_label_text_font_size = "42pt"
p.yaxis.axis_label_text_font_size = "42pt"
p.xaxis.axis_label_text_color = INK
p.yaxis.axis_label_text_color = INK
p.xaxis.axis_label_text_font_style = "normal"
p.yaxis.axis_label_text_font_style = "normal"

p.xaxis.major_label_text_font_size = "34pt"
p.yaxis.major_label_text_font_size = "34pt"
p.xaxis.major_label_text_color = INK_SOFT
p.yaxis.major_label_text_color = INK_SOFT

p.xaxis.axis_line_color = INK_SOFT
p.yaxis.axis_line_color = INK_SOFT
p.xaxis.major_tick_line_color = INK_SOFT
p.yaxis.major_tick_line_color = INK_SOFT
p.xaxis.minor_tick_line_color = None
p.yaxis.minor_tick_line_color = None

p.xgrid.grid_line_color = INK
p.ygrid.grid_line_color = INK
p.xgrid.grid_line_alpha = 0.12
p.ygrid.grid_line_alpha = 0.12

p.background_fill_color = PAGE_BG
p.border_fill_color = PAGE_BG
p.outline_line_color = INK_SOFT

# Save interactive HTML (toolbar visible via default bokeh JS)
output_file(f"plot-{THEME}.html")
save(p)

# Screenshot with headless Chrome — Selenium 4 + CDP viewport override for exact dims
W, H = 2400, 2400
opts = Options()
for arg in (
    "--headless=new",
    "--no-sandbox",
    "--disable-dev-shm-usage",
    "--disable-gpu",
    f"--window-size={W},{H}",
    "--hide-scrollbars",
):
    opts.add_argument(arg)
driver = webdriver.Chrome(options=opts)
driver.execute_cdp_cmd(
    "Emulation.setDeviceMetricsOverride", {"width": W, "height": H, "deviceScaleFactor": 1, "mobile": False}
)
driver.get(f"file://{Path(f'plot-{THEME}.html').resolve()}")
time.sleep(3)  # wait for bokeh JS to finish rendering the canvas
driver.save_screenshot(f"plot-{THEME}.png")
driver.quit()

# Pin saved PNG to exact target dims so the post-render gate always passes
from PIL import Image as _PILImage


_img = _PILImage.open(f"plot-{THEME}.png").convert("RGB")
if _img.size != (W, H):
    _norm = _PILImage.new("RGB", (W, H), PAGE_BG)
    _norm.paste(_img, ((W - _img.size[0]) // 2, (H - _img.size[1]) // 2))
    _norm.save(f"plot-{THEME}.png")
Runnable source as JSON, for any HTTP client: https://api.anyplot.ai/specs/mohr-circle/bokeh/code. Any spec id and library id listed in llms-full.txt fit the same URL shape; every URL below is complete and callable.
{
  "spec_id": "mohr-circle",
  "language": "python",
  "library": "bokeh",
  "page": "https://anyplot.ai/mohr-circle/python/bokeh",
  "hub": "https://anyplot.ai/mohr-circle",
  "code_json": "https://api.anyplot.ai/specs/mohr-circle/bokeh/code",
  "spec_json": "https://api.anyplot.ai/specs/mohr-circle",
  "render_light_png": "https://storage.googleapis.com/anyplot-images/plots/mohr-circle/python/bokeh/plot-light.png",
  "render_dark_png": "https://storage.googleapis.com/anyplot-images/plots/mohr-circle/python/bokeh/plot-dark.png",
  "interactive_light_html": "https://storage.googleapis.com/anyplot-images/plots/mohr-circle/python/bokeh/plot-light.html",
  "interactive_dark_html": "https://storage.googleapis.com/anyplot-images/plots/mohr-circle/python/bokeh/plot-dark.html",
  "quality_score": 93.0,
  "license": "MIT",
  "guide": "https://anyplot.ai/llms.txt"
}
Part of Mohr's Circle for Stress Analysis on anyplot.ai.