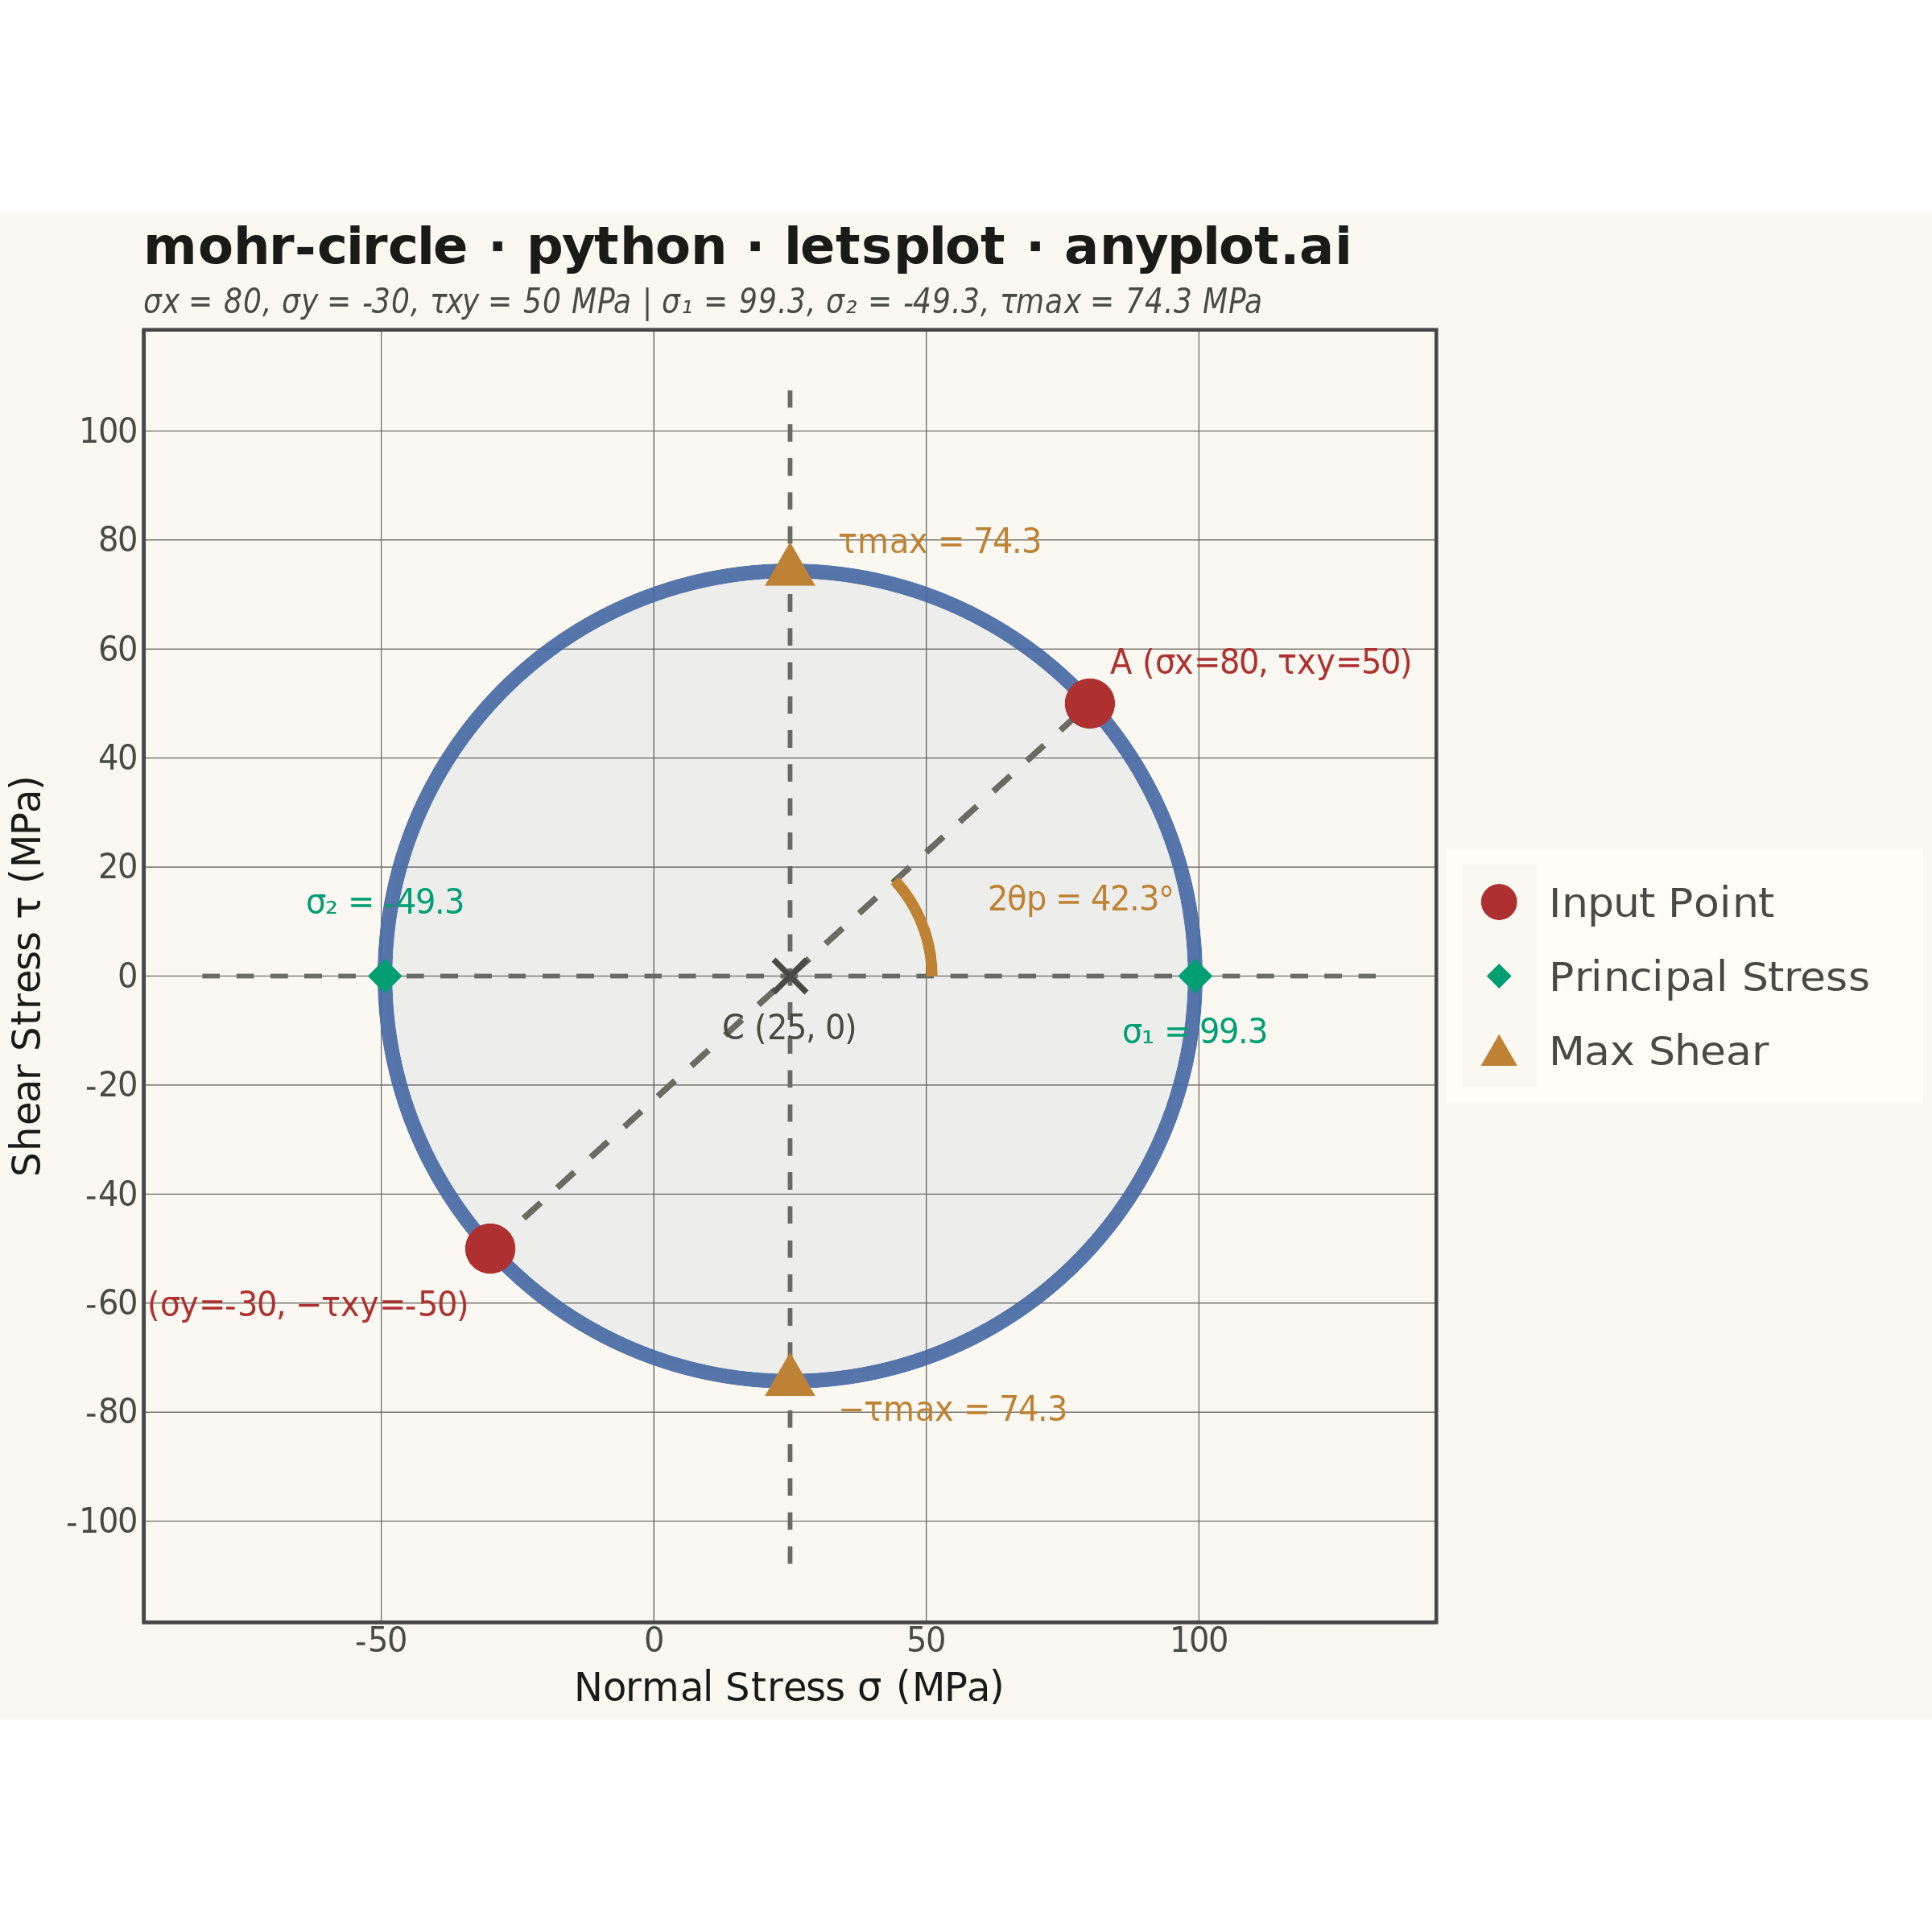
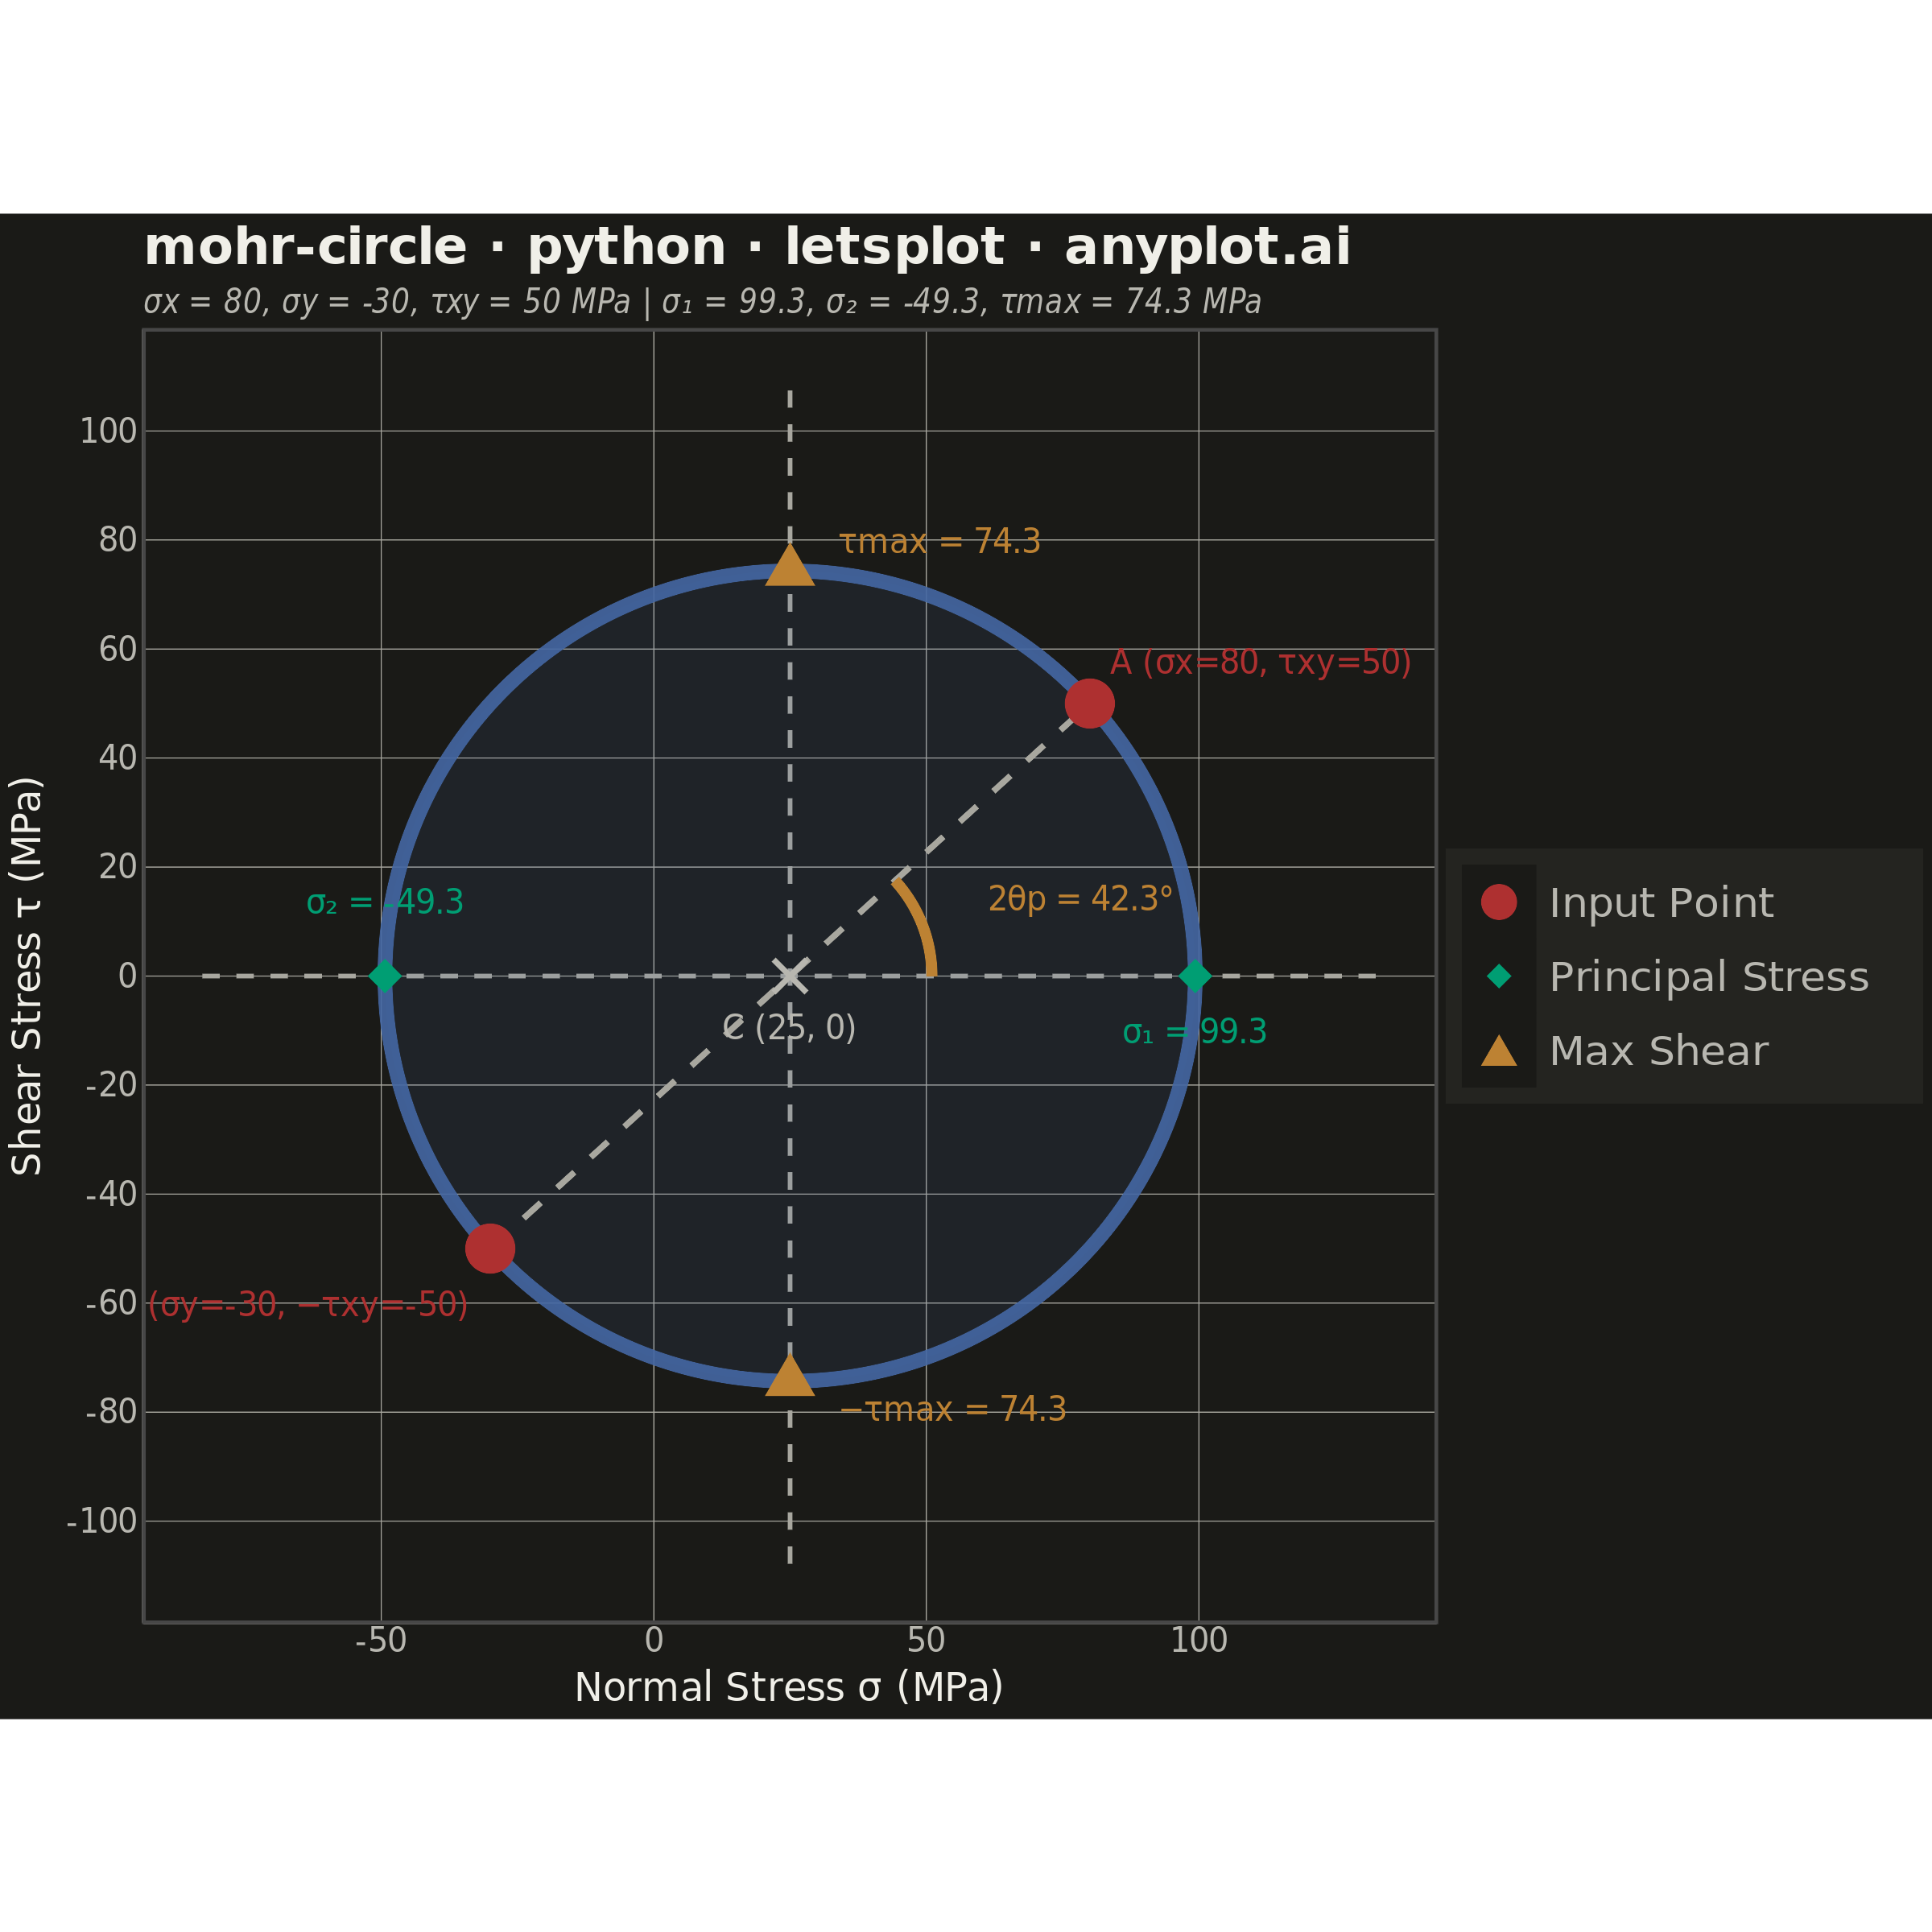
Mohr's Circle is a graphical method used to determine principal stresses, maximum shear stress, and stress transformations from a given 2D stress state. A circle is drawn on a normal stress (σ) vs. shear stress (τ) plane, with the center at ((σx + σy) / 2, 0) and a radius derived from the stress components. It is an essential tool in mechanical and civil engineering for visualizing how stress components change under coordinate rotation.
""" anyplot.ai
mohr-circle: Mohr's Circle for Stress Analysis
Library: letsplot 4.10.1 | Python 3.13.13
Quality: 87/100 | Updated: 2026-05-30
"""

import os

import numpy as np
import pandas as pd
from lets_plot import (
    LetsPlot,
    aes,
    coord_fixed,
    element_blank,
    element_line,
    element_rect,
    element_text,
    geom_line,
    geom_path,
    geom_point,
    geom_polygon,
    geom_text,
    ggplot,
    ggsave,
    ggsize,
    labs,
    layer_tooltips,
    scale_color_manual,
    scale_shape_manual,
    theme,
    theme_minimal,
)


LetsPlot.setup_html()

# Theme tokens — Imprint palette, theme-adaptive chrome
THEME = os.getenv("ANYPLOT_THEME", "light")
PAGE_BG = "#FAF8F1" if THEME == "light" else "#1A1A17"
ELEVATED_BG = "#FFFDF6" if THEME == "light" else "#242420"
INK = "#1A1A17" if THEME == "light" else "#F0EFE8"
INK_SOFT = "#4A4A44" if THEME == "light" else "#B8B7B0"
INK_MUTED = "#6B6A63" if THEME == "light" else "#A8A79F"

# Imprint palette — semantic assignments for stress diagram elements
C_CIRCLE = "#4467A3"  # blue — structural circle outline
C_INPUT = "#AE3030"  # matte red — applied input stress points (semantic: danger/input)
C_PRINCIPAL = "#009E73"  # brand green — principal stress results (primary outcome)
C_SHEAR = "#BD8233"  # ochre — shear stress components

# Category constants for legend
CAT_INPUT = "Input Point"
CAT_PRINCIPAL = "Principal Stress"
CAT_SHEAR = "Max Shear"

# Data — steel column under combined axial and bending load
sigma_x = 80.0  # MPa, axial + bending normal stress
sigma_y = -30.0  # MPa, lateral normal stress
tau_xy = 50.0  # MPa, shear stress from torsion

# Mohr's Circle geometry
center = (sigma_x + sigma_y) / 2.0
radius = np.sqrt(((sigma_x - sigma_y) / 2.0) ** 2 + tau_xy**2)
sigma_1 = center + radius
sigma_2 = center - radius
tau_max = radius
theta_p = 0.5 * np.degrees(np.arctan2(2 * tau_xy, sigma_x - sigma_y))

# Circle path
theta = np.linspace(0, 2 * np.pi, 360)
df_circle = pd.DataFrame({"sigma": center + radius * np.cos(theta), "tau": radius * np.sin(theta)})

# Input stress points A and B
df_input = pd.DataFrame(
    {
        "sigma": [sigma_x, sigma_y],
        "tau": [tau_xy, -tau_xy],
        "category": [CAT_INPUT, CAT_INPUT],
        "label": [f"A (σx={sigma_x:.0f}, τxy={tau_xy:.0f})", f"B (σy={sigma_y:.0f}, −τxy={-tau_xy:.0f})"],
        "detail": [
            f"Normal: {sigma_x:.0f} MPa | Shear: {tau_xy:.0f} MPa",
            f"Normal: {sigma_y:.0f} MPa | Shear: {-tau_xy:.0f} MPa",
        ],
    }
)

# Principal stress points (on the horizontal axis)
df_principal = pd.DataFrame(
    {
        "sigma": [sigma_1, sigma_2],
        "tau": [0.0, 0.0],
        "category": [CAT_PRINCIPAL, CAT_PRINCIPAL],
        "label": [f"σ₁ = {sigma_1:.1f}", f"σ₂ = {sigma_2:.1f}"],
        "detail": [f"Max principal: {sigma_1:.1f} MPa", f"Min principal: {sigma_2:.1f} MPa"],
    }
)

# Maximum shear stress points (top and bottom of circle)
df_shear = pd.DataFrame(
    {
        "sigma": [center, center],
        "tau": [tau_max, -tau_max],
        "category": [CAT_SHEAR, CAT_SHEAR],
        "label": [f"τmax = {tau_max:.1f}", f"−τmax = {tau_max:.1f}"],
        "detail": [f"Max shear: {tau_max:.1f} MPa", f"Min shear: {-tau_max:.1f} MPa"],
    }
)

# Combined points for legend-mapped layer (Input, Principal, Max Shear)
df_legend_points = pd.concat([df_input, df_principal, df_shear], ignore_index=True)

# Center point (separate layer — different size, no legend entry needed)
df_center = pd.DataFrame(
    {
        "sigma": [center],
        "tau": [0.0],
        "label": [f"C ({center:.0f}, 0)"],
        "detail": [f"Mean stress: {center:.1f} MPa | Radius: {radius:.1f} MPa"],
    }
)

# Reference lines through center
pad = radius * 0.45
df_hline = pd.DataFrame({"sigma": [center - radius - pad, center + radius + pad], "tau": [0.0, 0.0]})
df_vline = pd.DataFrame({"sigma": [center, center], "tau": [-radius - pad, radius + pad]})
df_diameter = pd.DataFrame({"sigma": [sigma_x, sigma_y], "tau": [tau_xy, -tau_xy]})

# Angle arc for 2θp (principal plane angle)
arc_r = radius * 0.35
arc_t = np.linspace(0, np.radians(2 * theta_p), 50)
df_arc = pd.DataFrame({"sigma": center + arc_r * np.cos(arc_t), "tau": arc_r * np.sin(arc_t)})

# Theme-adaptive circle fill alpha — slightly stronger on dark for interior visibility
circle_fill_alpha = 0.12 if THEME == "dark" else 0.07

# Title
title = "mohr-circle · python · letsplot · anyplot.ai"

# Build plot
plot = (
    ggplot()
    # Reference lines through center
    + geom_line(data=df_hline, mapping=aes(x="sigma", y="tau"), color=INK_MUTED, size=0.6, linetype="dashed")
    + geom_line(data=df_vline, mapping=aes(x="sigma", y="tau"), color=INK_MUTED, size=0.6, linetype="dashed")
    # Circle fill (subtle, theme-adaptive) then solid outline
    + geom_polygon(
        data=df_circle, mapping=aes(x="sigma", y="tau"), fill=C_CIRCLE, color=C_CIRCLE, alpha=circle_fill_alpha, size=0
    )
    + geom_path(data=df_circle, mapping=aes(x="sigma", y="tau"), color=C_CIRCLE, size=2.0, alpha=0.9)
    # Diameter line A–B
    + geom_line(data=df_diameter, mapping=aes(x="sigma", y="tau"), color=INK_MUTED, size=0.8, linetype="dashed")
    # Principal plane angle arc
    + geom_path(data=df_arc, mapping=aes(x="sigma", y="tau"), color=C_SHEAR, size=1.5)
    # Stress points with mapped color + shape — drives the built-in legend panel
    + geom_point(
        data=df_legend_points,
        mapping=aes(x="sigma", y="tau", color="category", shape="category"),
        size=7,
        tooltips=layer_tooltips().line("@label").line("@detail"),
    )
    + scale_color_manual(values={CAT_INPUT: C_INPUT, CAT_PRINCIPAL: C_PRINCIPAL, CAT_SHEAR: C_SHEAR}, name="")
    + scale_shape_manual(values={CAT_INPUT: 16, CAT_PRINCIPAL: 18, CAT_SHEAR: 17}, name="")
    # Center marker (X cross — fixed aesthetics, separate layer)
    + geom_point(
        data=df_center,
        mapping=aes(x="sigma", y="tau"),
        color=INK_SOFT,
        size=5,
        shape=4,
        tooltips=layer_tooltips().line("@label").line("@detail"),
    )
    # Point A label — nudged right and up
    + geom_text(
        data=df_input.iloc[[0]],
        mapping=aes(x="sigma", y="tau", label="label"),
        color=C_INPUT,
        size=5,
        hjust=0,
        nudge_x=radius * 0.05,
        nudge_y=radius * 0.10,
    )
    # Point B label — nudged left and down
    + geom_text(
        data=df_input.iloc[[1]],
        mapping=aes(x="sigma", y="tau", label="label"),
        color=C_INPUT,
        size=5,
        hjust=1,
        nudge_x=-radius * 0.05,
        nudge_y=-radius * 0.14,
    )
    # σ₁ label — below the point
    + geom_text(
        data=df_principal.iloc[[0]],
        mapping=aes(x="sigma", y="tau", label="label"),
        color=C_PRINCIPAL,
        size=5,
        hjust=0.5,
        nudge_y=-radius * 0.14,
    )
    # σ₂ label — nudged upward (above x-axis) to clear the B label in the lower-left
    + geom_text(
        data=df_principal.iloc[[1]],
        mapping=aes(x="sigma", y="tau", label="label"),
        color=C_PRINCIPAL,
        size=5,
        hjust=0.5,
        nudge_y=radius * 0.18,
    )
    # τmax label — nudged right, above the top marker
    + geom_text(
        data=df_shear.iloc[[0]],
        mapping=aes(x="sigma", y="tau", label="label"),
        color=C_SHEAR,
        size=5,
        hjust=0,
        nudge_x=radius * 0.12,
        nudge_y=radius * 0.07,
    )
    # −τmax label
    + geom_text(
        data=df_shear.iloc[[1]],
        mapping=aes(x="sigma", y="tau", label="label"),
        color=C_SHEAR,
        size=5,
        hjust=0,
        nudge_x=radius * 0.12,
        nudge_y=-radius * 0.07,
    )
    # Principal plane angle annotation
    + geom_text(
        data=pd.DataFrame(
            {
                "sigma": [center + arc_r * 1.5 * np.cos(np.radians(theta_p))],
                "tau": [arc_r * 1.5 * np.sin(np.radians(theta_p))],
                "label": [f"2θp = {2 * theta_p:.1f}°"],
            }
        ),
        mapping=aes(x="sigma", y="tau", label="label"),
        color=C_SHEAR,
        size=5,
        hjust=0,
    )
    # Center label
    + geom_text(
        data=df_center, mapping=aes(x="sigma", y="tau", label="label"), color=INK_SOFT, size=5, nudge_y=-radius * 0.13
    )
    # Axes, title, subtitle
    + labs(
        x="Normal Stress σ (MPa)",
        y="Shear Stress τ (MPa)",
        title=title,
        subtitle=(
            f"σx = {sigma_x:.0f}, σy = {sigma_y:.0f},"
            f" τxy = {tau_xy:.0f} MPa"
            f" | σ₁ = {sigma_1:.1f}, σ₂ = {sigma_2:.1f},"
            f" τmax = {tau_max:.1f} MPa"
        ),
    )
    + coord_fixed()
    + theme_minimal()
    + theme(
        plot_background=element_rect(fill=PAGE_BG, color=PAGE_BG),
        panel_background=element_rect(fill=PAGE_BG),
        panel_grid_major=element_line(color=INK_MUTED, size=0.3),
        panel_grid_minor=element_blank(),
        axis_title=element_text(size=12, color=INK),
        axis_text=element_text(size=10, color=INK_SOFT),
        axis_line=element_line(color=INK_SOFT),
        plot_title=element_text(size=16, face="bold", color=INK),
        plot_subtitle=element_text(size=10, face="italic", color=INK_SOFT),
        legend_background=element_rect(fill=ELEVATED_BG, color=INK_SOFT),
        legend_text=element_text(color=INK_SOFT),
        legend_title=element_text(color=INK),
    )
    + ggsize(600, 600)
)

# Save
ggsave(plot, f"plot-{THEME}.png", scale=4, path=".")
ggsave(plot, f"plot-{THEME}.html", path=".")
Runnable source as JSON, for any HTTP client: https://api.anyplot.ai/specs/mohr-circle/letsplot/code. Any spec id and library id listed in llms-full.txt fit the same URL shape; every URL below is complete and callable.
{
  "spec_id": "mohr-circle",
  "language": "python",
  "library": "letsplot",
  "page": "https://anyplot.ai/mohr-circle/python/letsplot",
  "hub": "https://anyplot.ai/mohr-circle",
  "code_json": "https://api.anyplot.ai/specs/mohr-circle/letsplot/code",
  "spec_json": "https://api.anyplot.ai/specs/mohr-circle",
  "render_light_png": "https://storage.googleapis.com/anyplot-images/plots/mohr-circle/python/letsplot/plot-light.png",
  "render_dark_png": "https://storage.googleapis.com/anyplot-images/plots/mohr-circle/python/letsplot/plot-dark.png",
  "interactive_light_html": "https://storage.googleapis.com/anyplot-images/plots/mohr-circle/python/letsplot/plot-light.html",
  "interactive_dark_html": "https://storage.googleapis.com/anyplot-images/plots/mohr-circle/python/letsplot/plot-dark.html",
  "quality_score": 87.0,
  "license": "MIT",
  "guide": "https://anyplot.ai/llms.txt"
}
Part of Mohr's Circle for Stress Analysis on anyplot.ai.