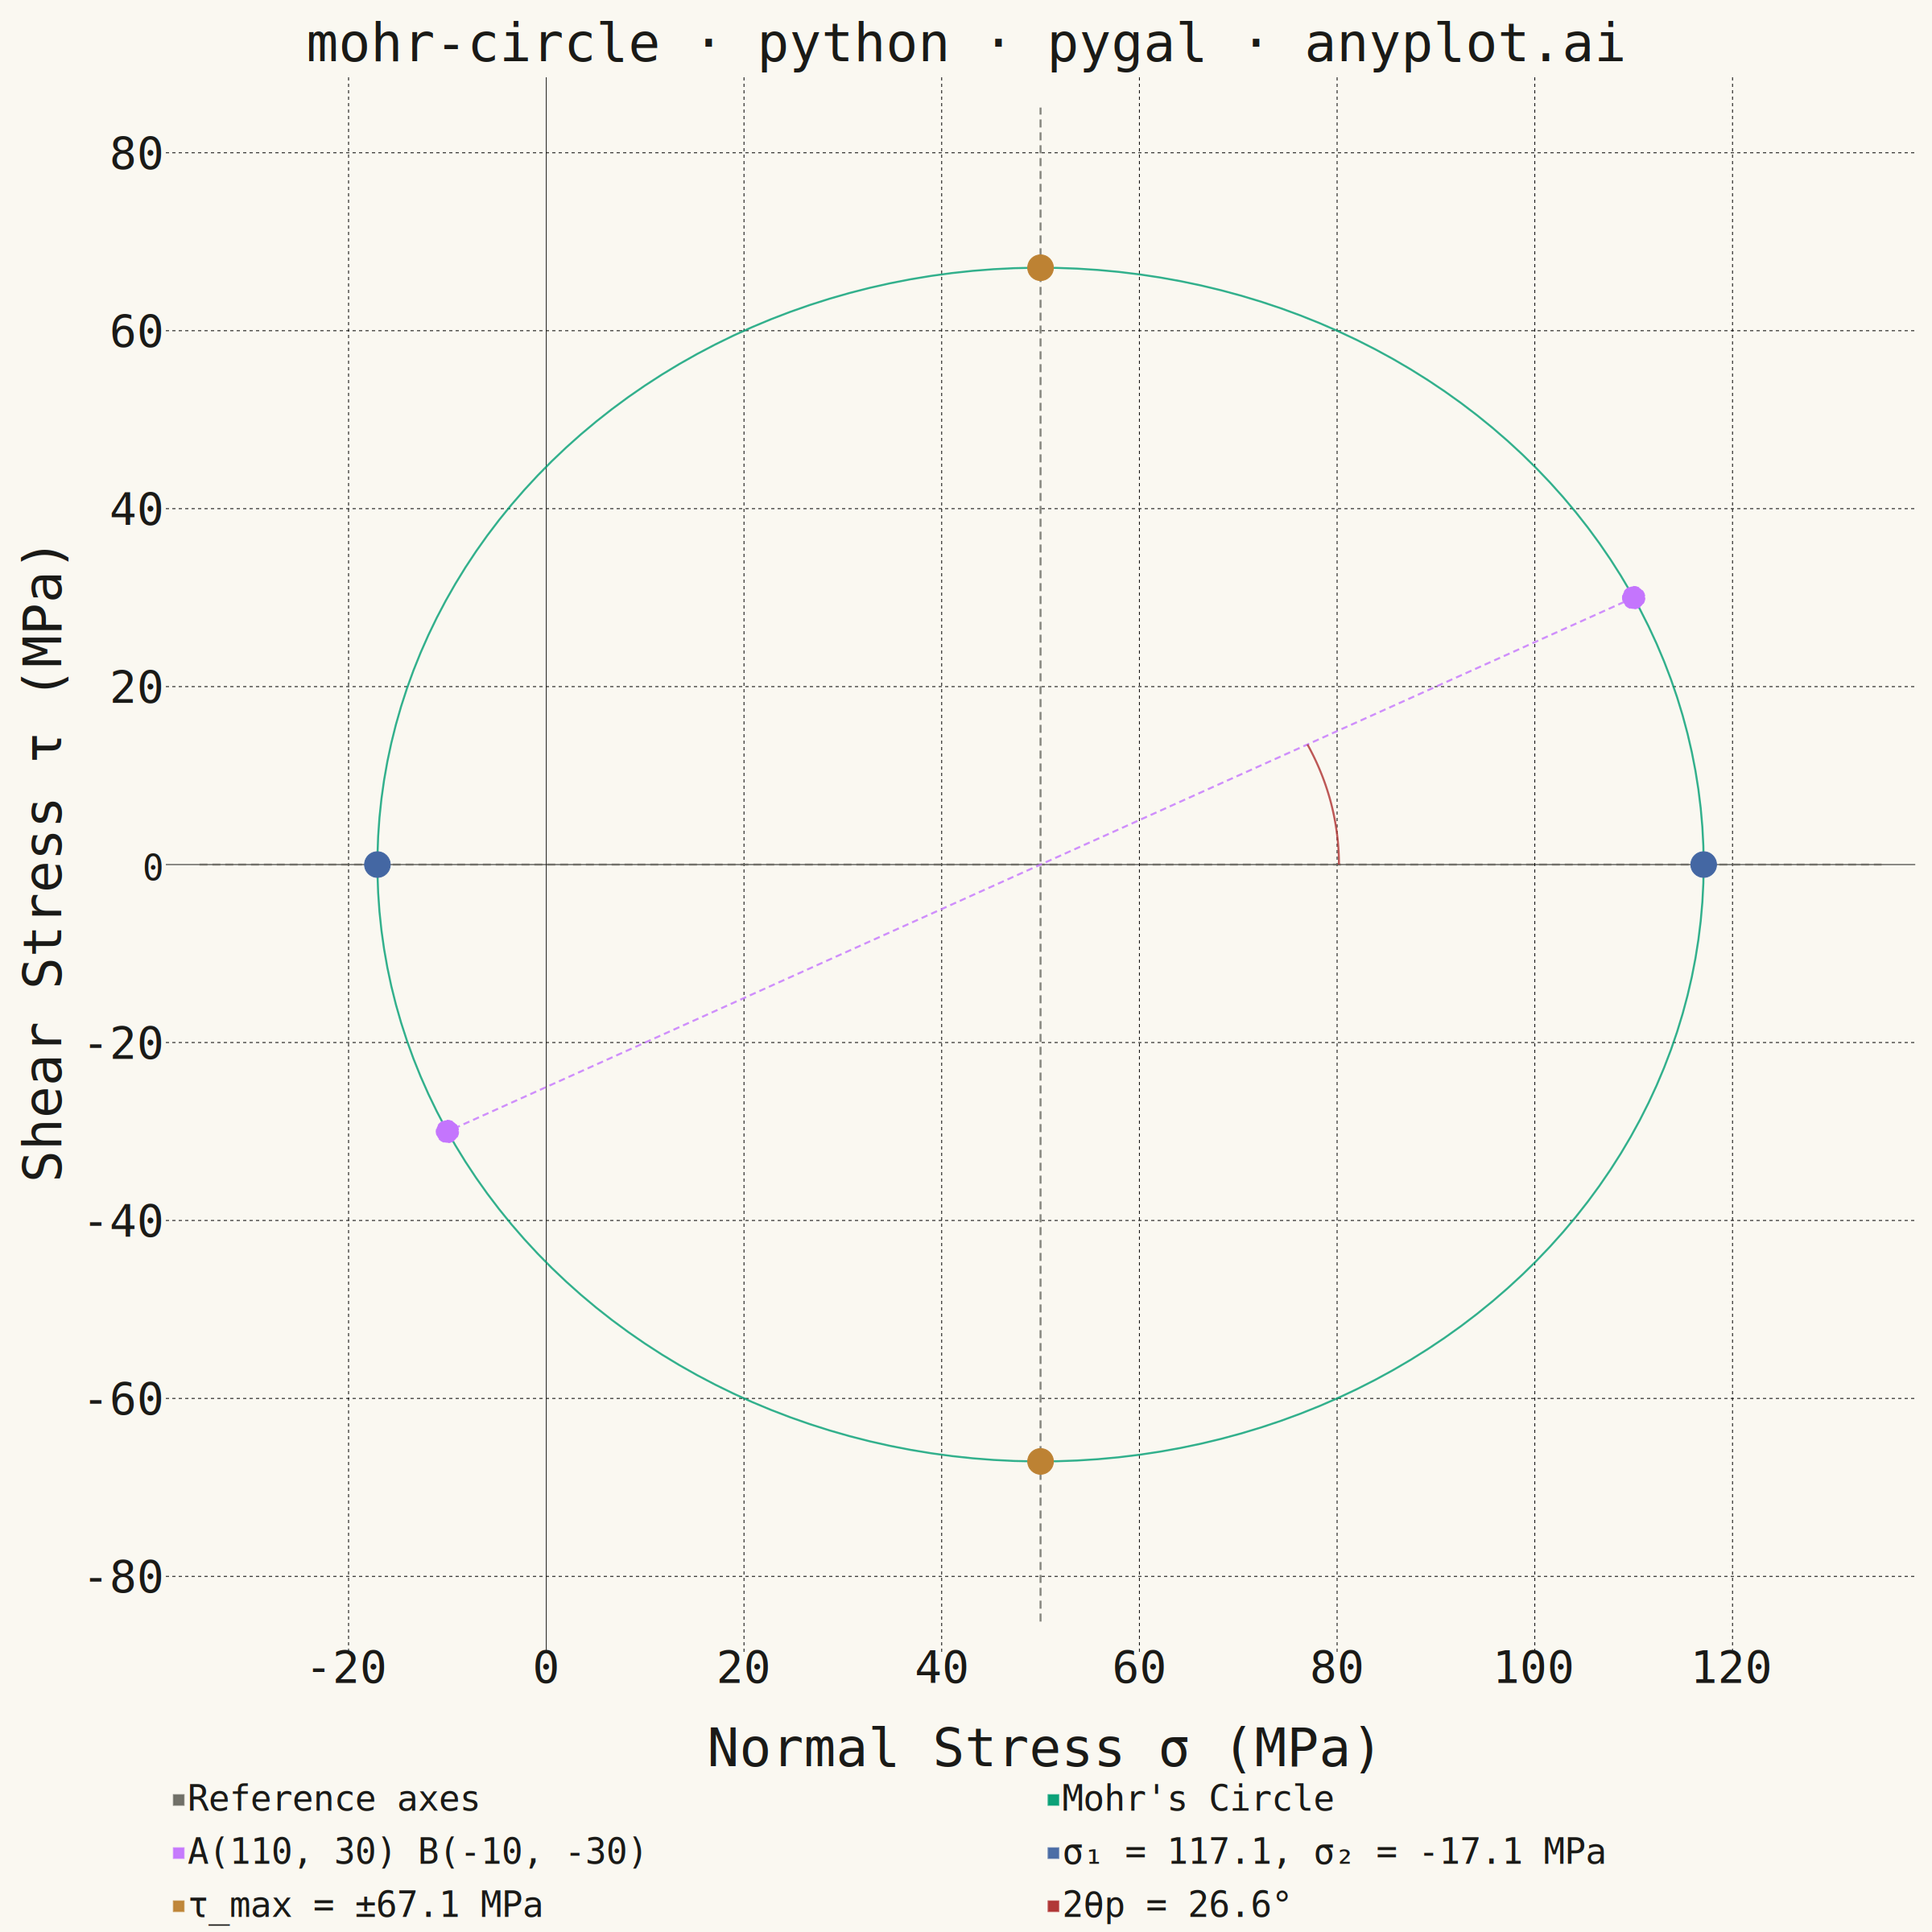
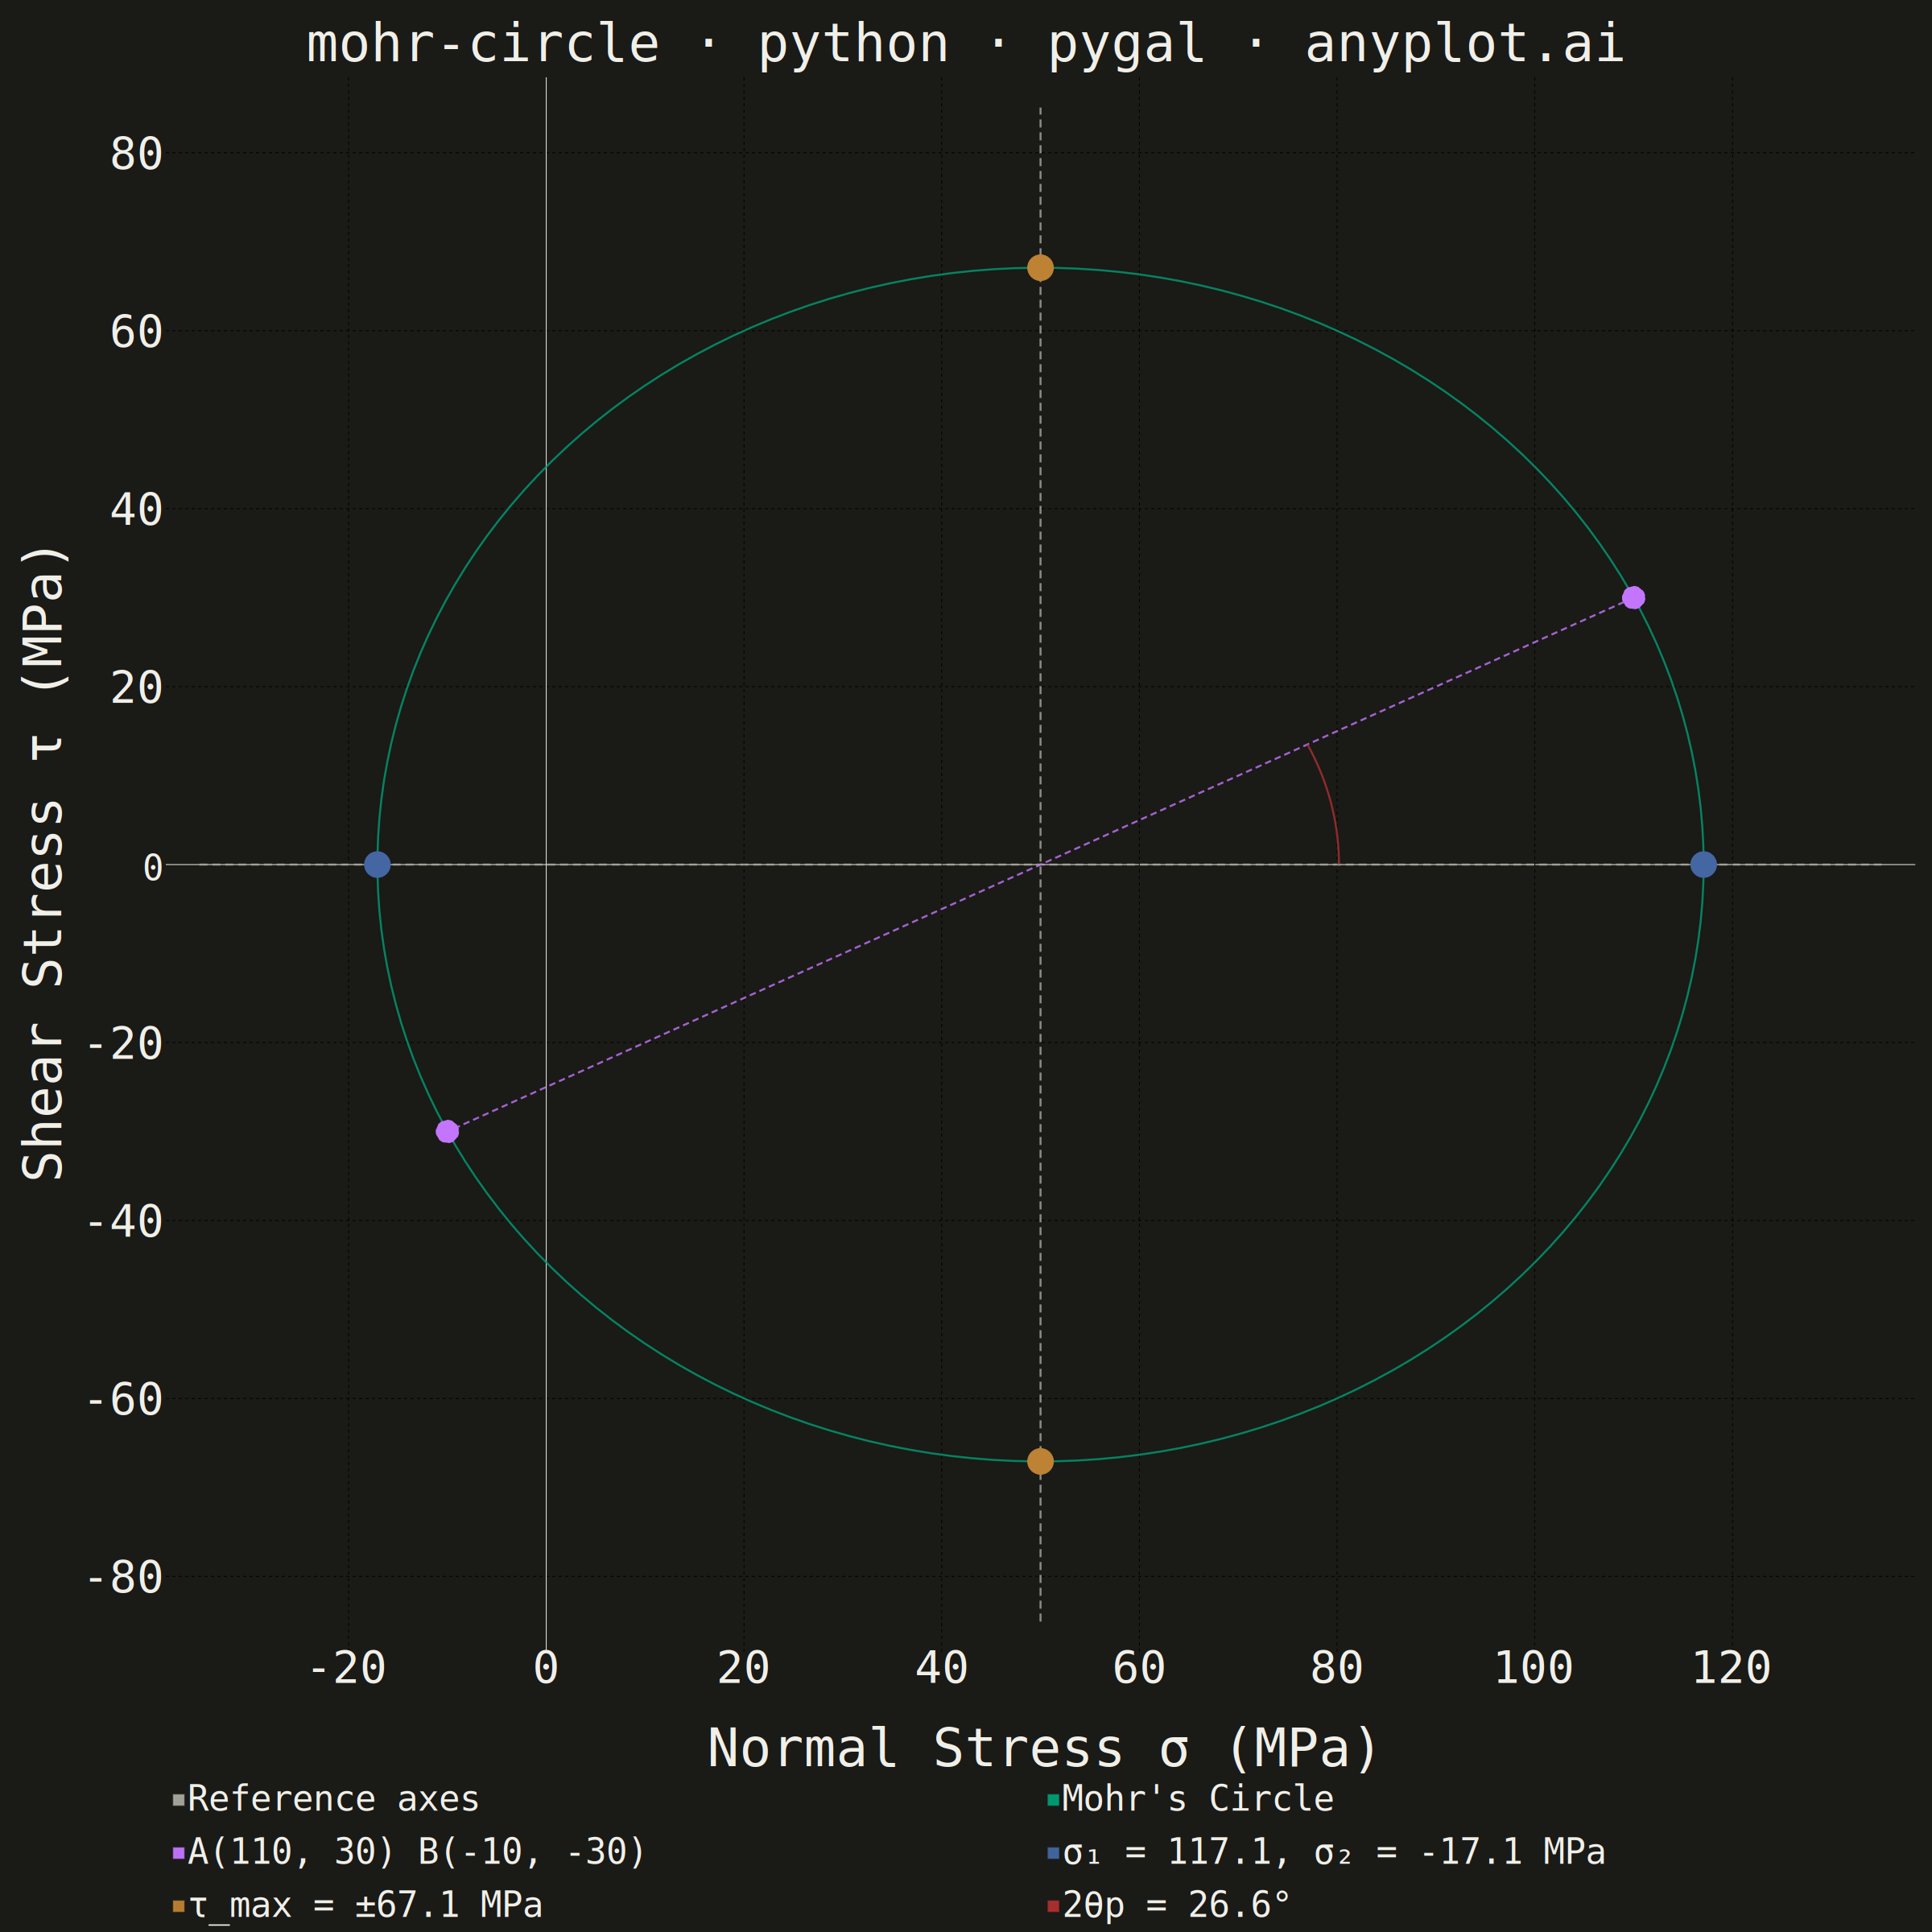
Mohr's Circle is a graphical method used to determine principal stresses, maximum shear stress, and stress transformations from a given 2D stress state. A circle is drawn on a normal stress (σ) vs. shear stress (τ) plane, with the center at ((σx + σy) / 2, 0) and a radius derived from the stress components. It is an essential tool in mechanical and civil engineering for visualizing how stress components change under coordinate rotation.
""" anyplot.ai
mohr-circle: Mohr's Circle for Stress Analysis
Library: pygal 3.1.0 | Python 3.13.13
Quality: 87/100 | Updated: 2026-05-30
"""

import importlib.util
import os
import sys

import numpy as np


# Ensure we import the installed pygal package, not this file
pygal_spec = importlib.util.find_spec("pygal")
if pygal_spec and pygal_spec.origin != __file__:
    import pygal
    from pygal.style import Style
else:
    _script_dir = os.path.dirname(os.path.abspath(__file__))
    sys.path = [p for p in sys.path if os.path.abspath(p) != _script_dir]
    try:
        import pygal
        from pygal.style import Style
    finally:
        sys.path.insert(0, _script_dir)

# Theme tokens — Imprint palette chrome
THEME = os.getenv("ANYPLOT_THEME", "light")
PAGE_BG = "#FAF8F1" if THEME == "light" else "#1A1A17"
INK = "#1A1A17" if THEME == "light" else "#F0EFE8"
INK_MUTED = "#6B6A63" if THEME == "light" else "#A8A79F"

# Imprint palette — 8 hues, theme-independent, hybrid-v3 sort
IMPRINT_PALETTE = ("#009E73", "#C475FD", "#4467A3", "#BD8233", "#AE3030", "#2ABCCD", "#954477", "#99B314")

# Data — concrete column under eccentric axial load + lateral shear
# Differentiated stress state from sibling implementations
sigma_x = 110  # Normal stress in x-direction (MPa) — axial + bending
sigma_y = -10  # Normal stress in y-direction (MPa) — transverse compression
tau_xy = 30  # Shear stress on xy-plane (MPa) — lateral force

# Mohr's Circle parameters
center = (sigma_x + sigma_y) / 2
radius = np.sqrt(((sigma_x - sigma_y) / 2) ** 2 + tau_xy**2)
sigma_1 = center + radius
sigma_2 = center - radius
tau_max = radius
theta_p2 = np.degrees(np.arctan2(tau_xy, (sigma_x - sigma_y) / 2))

# Circle points (200 points for smooth curve)
theta = np.linspace(0, 2 * np.pi, 200)
circle_pts = [(float(center + radius * np.cos(t)), float(radius * np.sin(t))) for t in theta]

# Reference stress points on the circle
point_a = (float(sigma_x), float(tau_xy))
point_b = (float(sigma_y), float(-tau_xy))

# 2θp angle arc — smaller radius keeps arc fully inside circle, improves dark-theme visibility
arc_r = radius * 0.45
arc_angles = np.linspace(0, np.radians(theta_p2), 50)
arc_pts = [(float(center + arc_r * np.cos(a)), float(arc_r * np.sin(a))) for a in arc_angles]

# Axis ranges — tight around circle with balanced padding
padding = 18
x_min = float(sigma_2 - padding)
x_max = float(sigma_1 + padding)
y_min = -(radius + padding)
y_max = radius + padding

# Reference lines through center (horizontal σ-axis + vertical at center)
ref_lines = [
    (float(x_min), 0.0),
    (float(x_max), 0.0),
    None,
    (float(center), float(y_min)),
    (float(center), float(y_max)),
]

# colors[0] = INK_MUTED for structural reference lines (neutral anchor, theme-adaptive)
# colors[1:] = Imprint palette, so Mohr's Circle = #009E73 (brand green, first categorical)
custom_colors = (INK_MUTED,) + IMPRINT_PALETTE[:5]

custom_style = Style(
    background=PAGE_BG,
    plot_background=PAGE_BG,
    foreground=INK,
    foreground_strong=INK,
    foreground_subtle=INK_MUTED,
    colors=custom_colors,
    title_font_size=66,
    label_font_size=56,
    major_label_font_size=44,
    legend_font_size=44,
    value_font_size=36,
    tooltip_font_size=30,
    stroke_width=2.5,
    opacity=0.95,
    opacity_hover=1.0,
)

# Square canvas — equal aspect ratio ensures the circle appears as a true circle
chart = pygal.XY(
    width=2400,
    height=2400,
    style=custom_style,
    title="mohr-circle · python · pygal · anyplot.ai",
    x_title="Normal Stress σ (MPa)",
    y_title="Shear Stress τ (MPa)",
    show_legend=True,
    legend_at_bottom=True,
    legend_at_bottom_columns=2,
    dots_size=5,
    stroke=True,
    show_x_guides=True,
    show_y_guides=True,
    truncate_legend=-1,
    range=(y_min, y_max),
    xrange=(x_min, x_max),
    x_value_formatter=lambda x: f"{x:.0f}",
    y_value_formatter=lambda y: f"{y:.0f} MPa",
    print_values=False,
    js=[],
)

# Reference lines through center (neutral structural layer — drawn behind data)
chart.add(
    "Reference axes",
    ref_lines,
    stroke=True,
    dots_size=0,
    stroke_style={"width": 2, "dasharray": "10, 6"},
    show_dots=False,
    allow_interruptions=True,
)

# Mohr's Circle outline — first categorical series → brand green #009E73
chart.add("Mohr's Circle", circle_pts, stroke=True, dots_size=0, stroke_style={"width": 5}, fill=False)

# Stress points A and B with diameter line
chart.add(
    f"A({sigma_x}, {tau_xy})  B({sigma_y}, {int(-tau_xy)})",
    [
        {"value": point_a, "label": f"A: σx = {sigma_x} MPa, τxy = {tau_xy} MPa"},
        {"value": point_b, "label": f"B: σy = {sigma_y} MPa, τxy = {int(-tau_xy)} MPa"},
    ],
    stroke=True,
    dots_size=14,
    stroke_style={"width": 3, "dasharray": "8, 5"},
)

# Principal stresses on horizontal axis
chart.add(
    f"σ₁ = {sigma_1:.1f}, σ₂ = {sigma_2:.1f} MPa",
    [
        {"value": (float(sigma_1), 0.0), "label": f"σ₁ = {sigma_1:.1f} MPa (max principal)"},
        {"value": (float(sigma_2), 0.0), "label": f"σ₂ = {sigma_2:.1f} MPa (min principal)"},
    ],
    stroke=False,
    dots_size=16,
)

# Max shear stress at top and bottom of circle
chart.add(
    f"τ_max = ±{tau_max:.1f} MPa",
    [
        {"value": (float(center), float(tau_max)), "label": f"τ_max = +{tau_max:.1f} MPa"},
        {"value": (float(center), float(-tau_max)), "label": f"τ_max = −{tau_max:.1f} MPa"},
    ],
    stroke=False,
    dots_size=16,
)

# 2θp angle arc — bold stroke, higher width for dark-theme contrast
chart.add(f"2θp = {theta_p2:.1f}°", arc_pts, stroke=True, dots_size=0, stroke_style={"width": 12})

# Save — theme-suffixed filenames required by pipeline
chart.render_to_png(f"plot-{THEME}.png")
with open(f"plot-{THEME}.html", "wb") as f:
    f.write(chart.render())
Runnable source as JSON, for any HTTP client: https://api.anyplot.ai/specs/mohr-circle/pygal/code. Any spec id and library id listed in llms-full.txt fit the same URL shape; every URL below is complete and callable.
{
  "spec_id": "mohr-circle",
  "language": "python",
  "library": "pygal",
  "page": "https://anyplot.ai/mohr-circle/python/pygal",
  "hub": "https://anyplot.ai/mohr-circle",
  "code_json": "https://api.anyplot.ai/specs/mohr-circle/pygal/code",
  "spec_json": "https://api.anyplot.ai/specs/mohr-circle",
  "render_light_png": "https://storage.googleapis.com/anyplot-images/plots/mohr-circle/python/pygal/plot-light.png",
  "render_dark_png": "https://storage.googleapis.com/anyplot-images/plots/mohr-circle/python/pygal/plot-dark.png",
  "interactive_light_html": "https://storage.googleapis.com/anyplot-images/plots/mohr-circle/python/pygal/plot-light.html",
  "interactive_dark_html": "https://storage.googleapis.com/anyplot-images/plots/mohr-circle/python/pygal/plot-dark.html",
  "quality_score": 87.0,
  "license": "MIT",
  "guide": "https://anyplot.ai/llms.txt"
}
Part of Mohr's Circle for Stress Analysis on anyplot.ai.