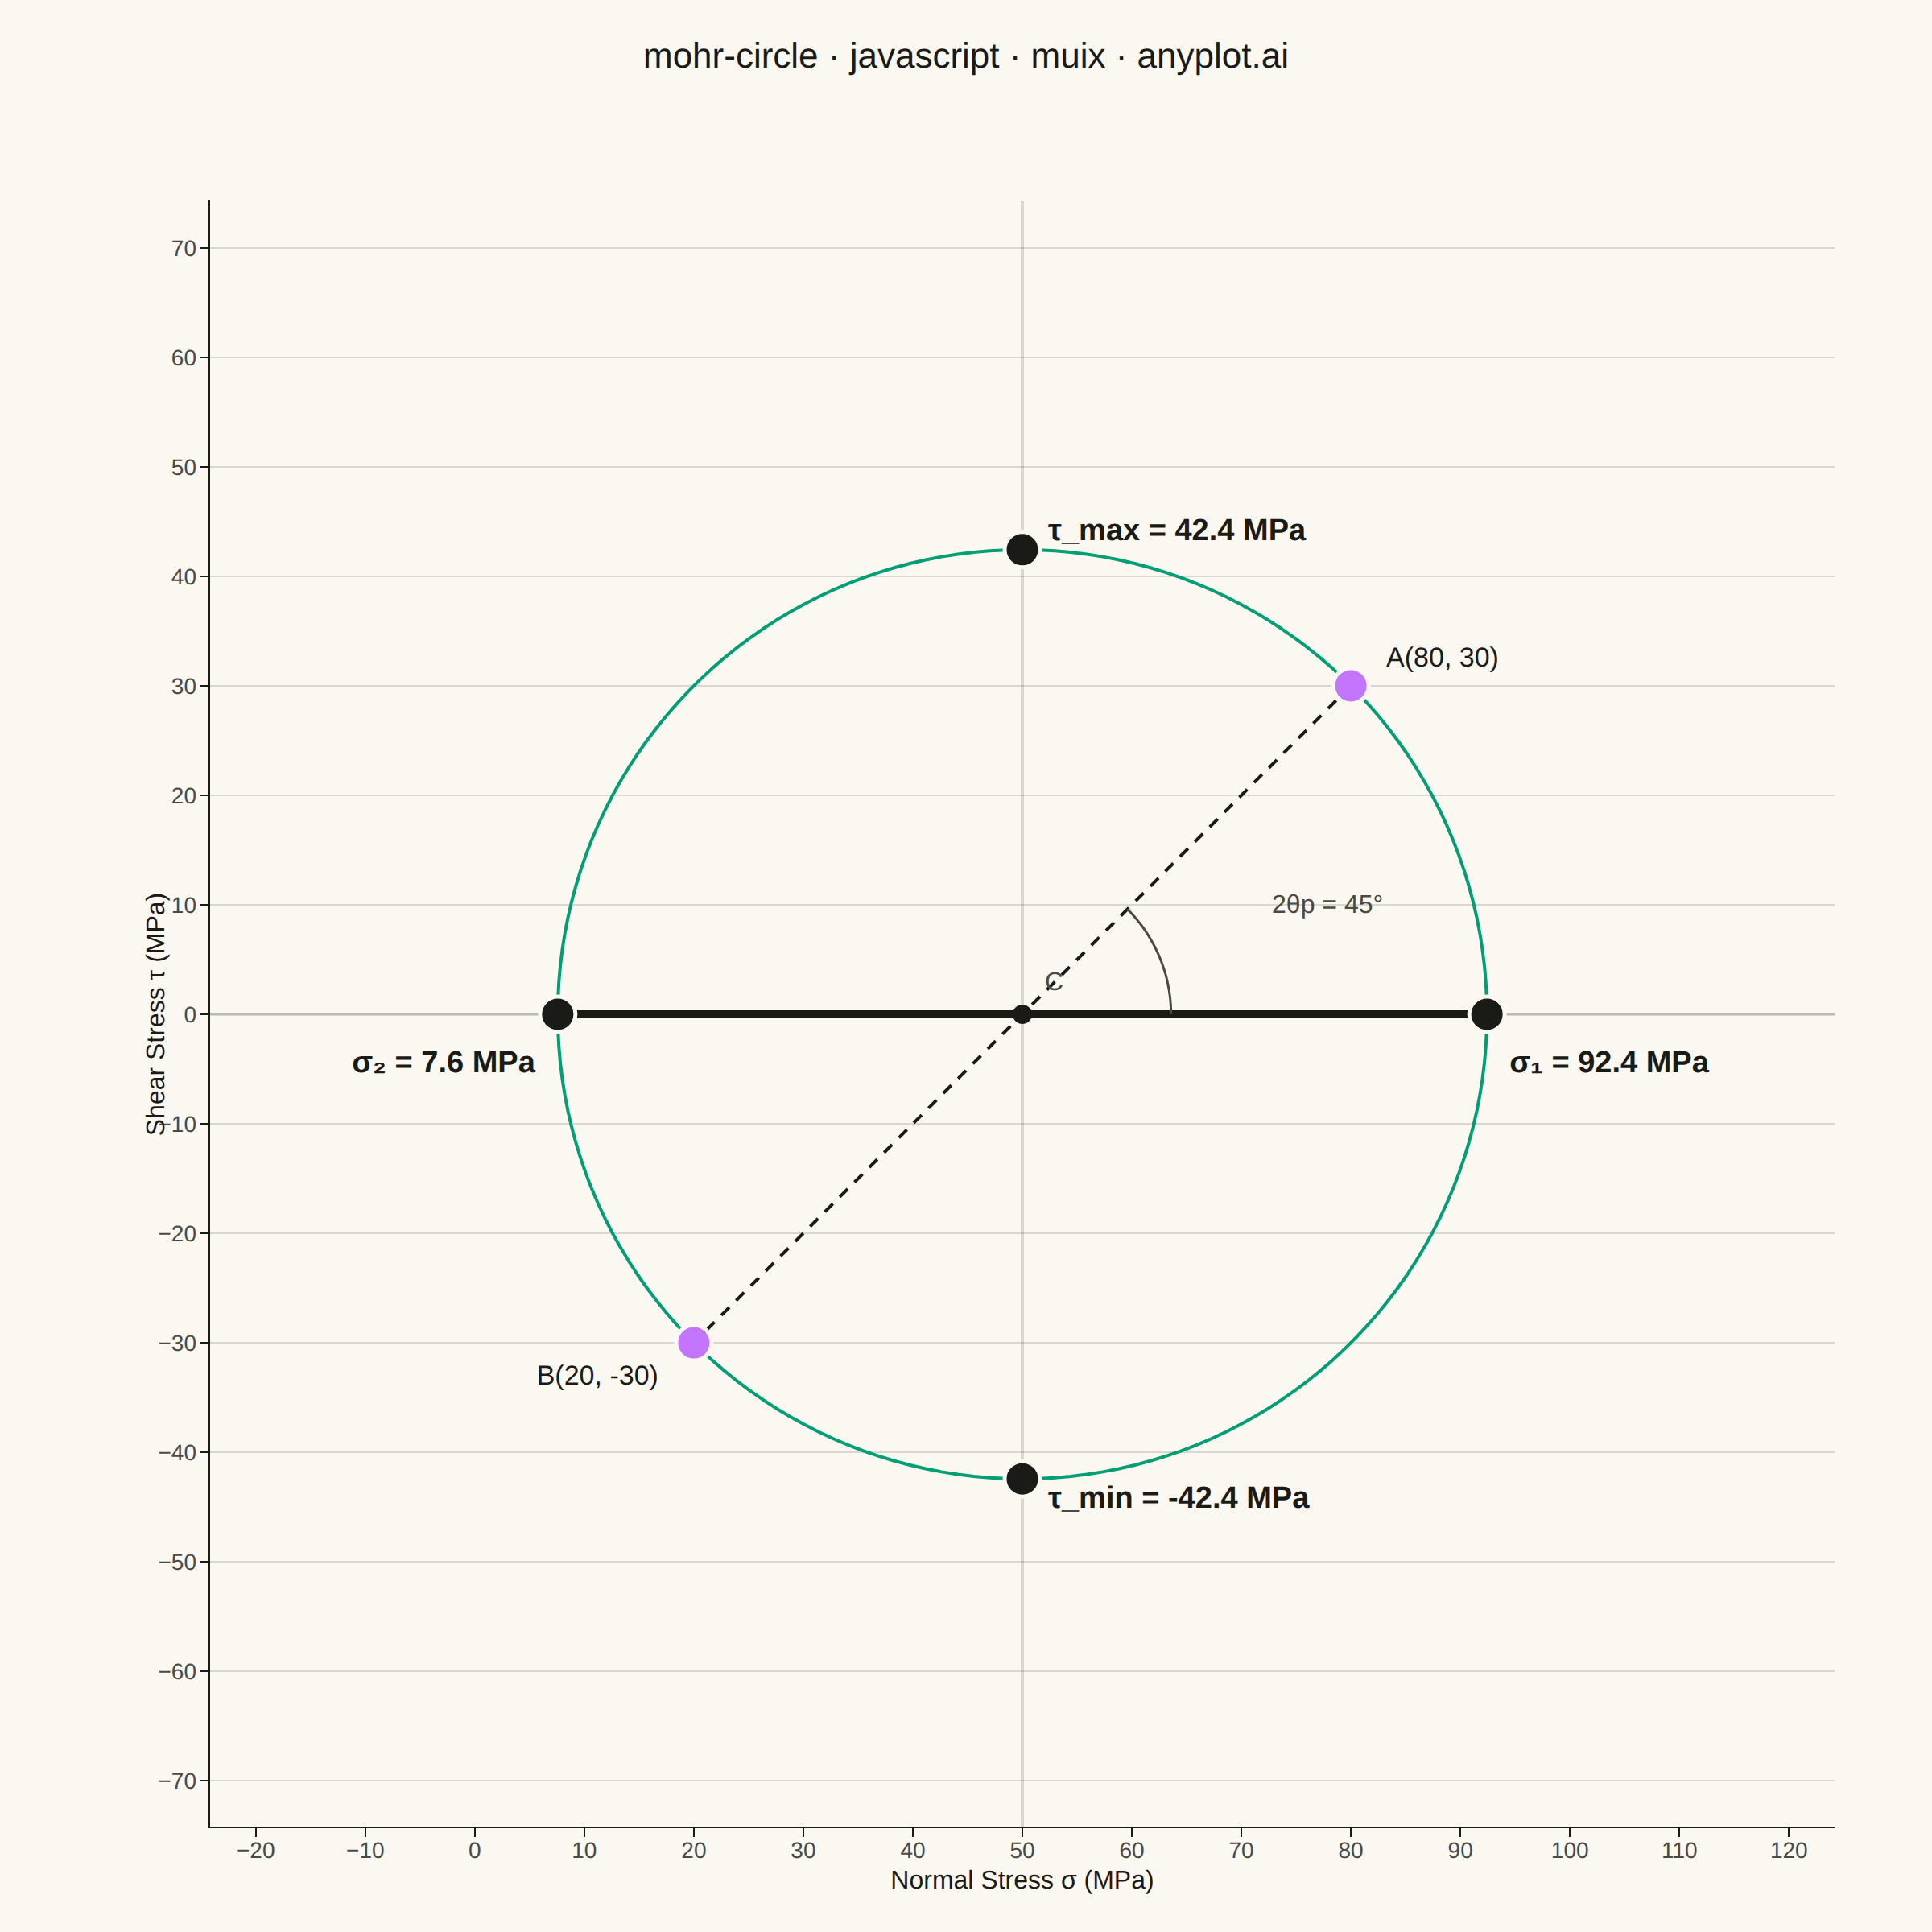
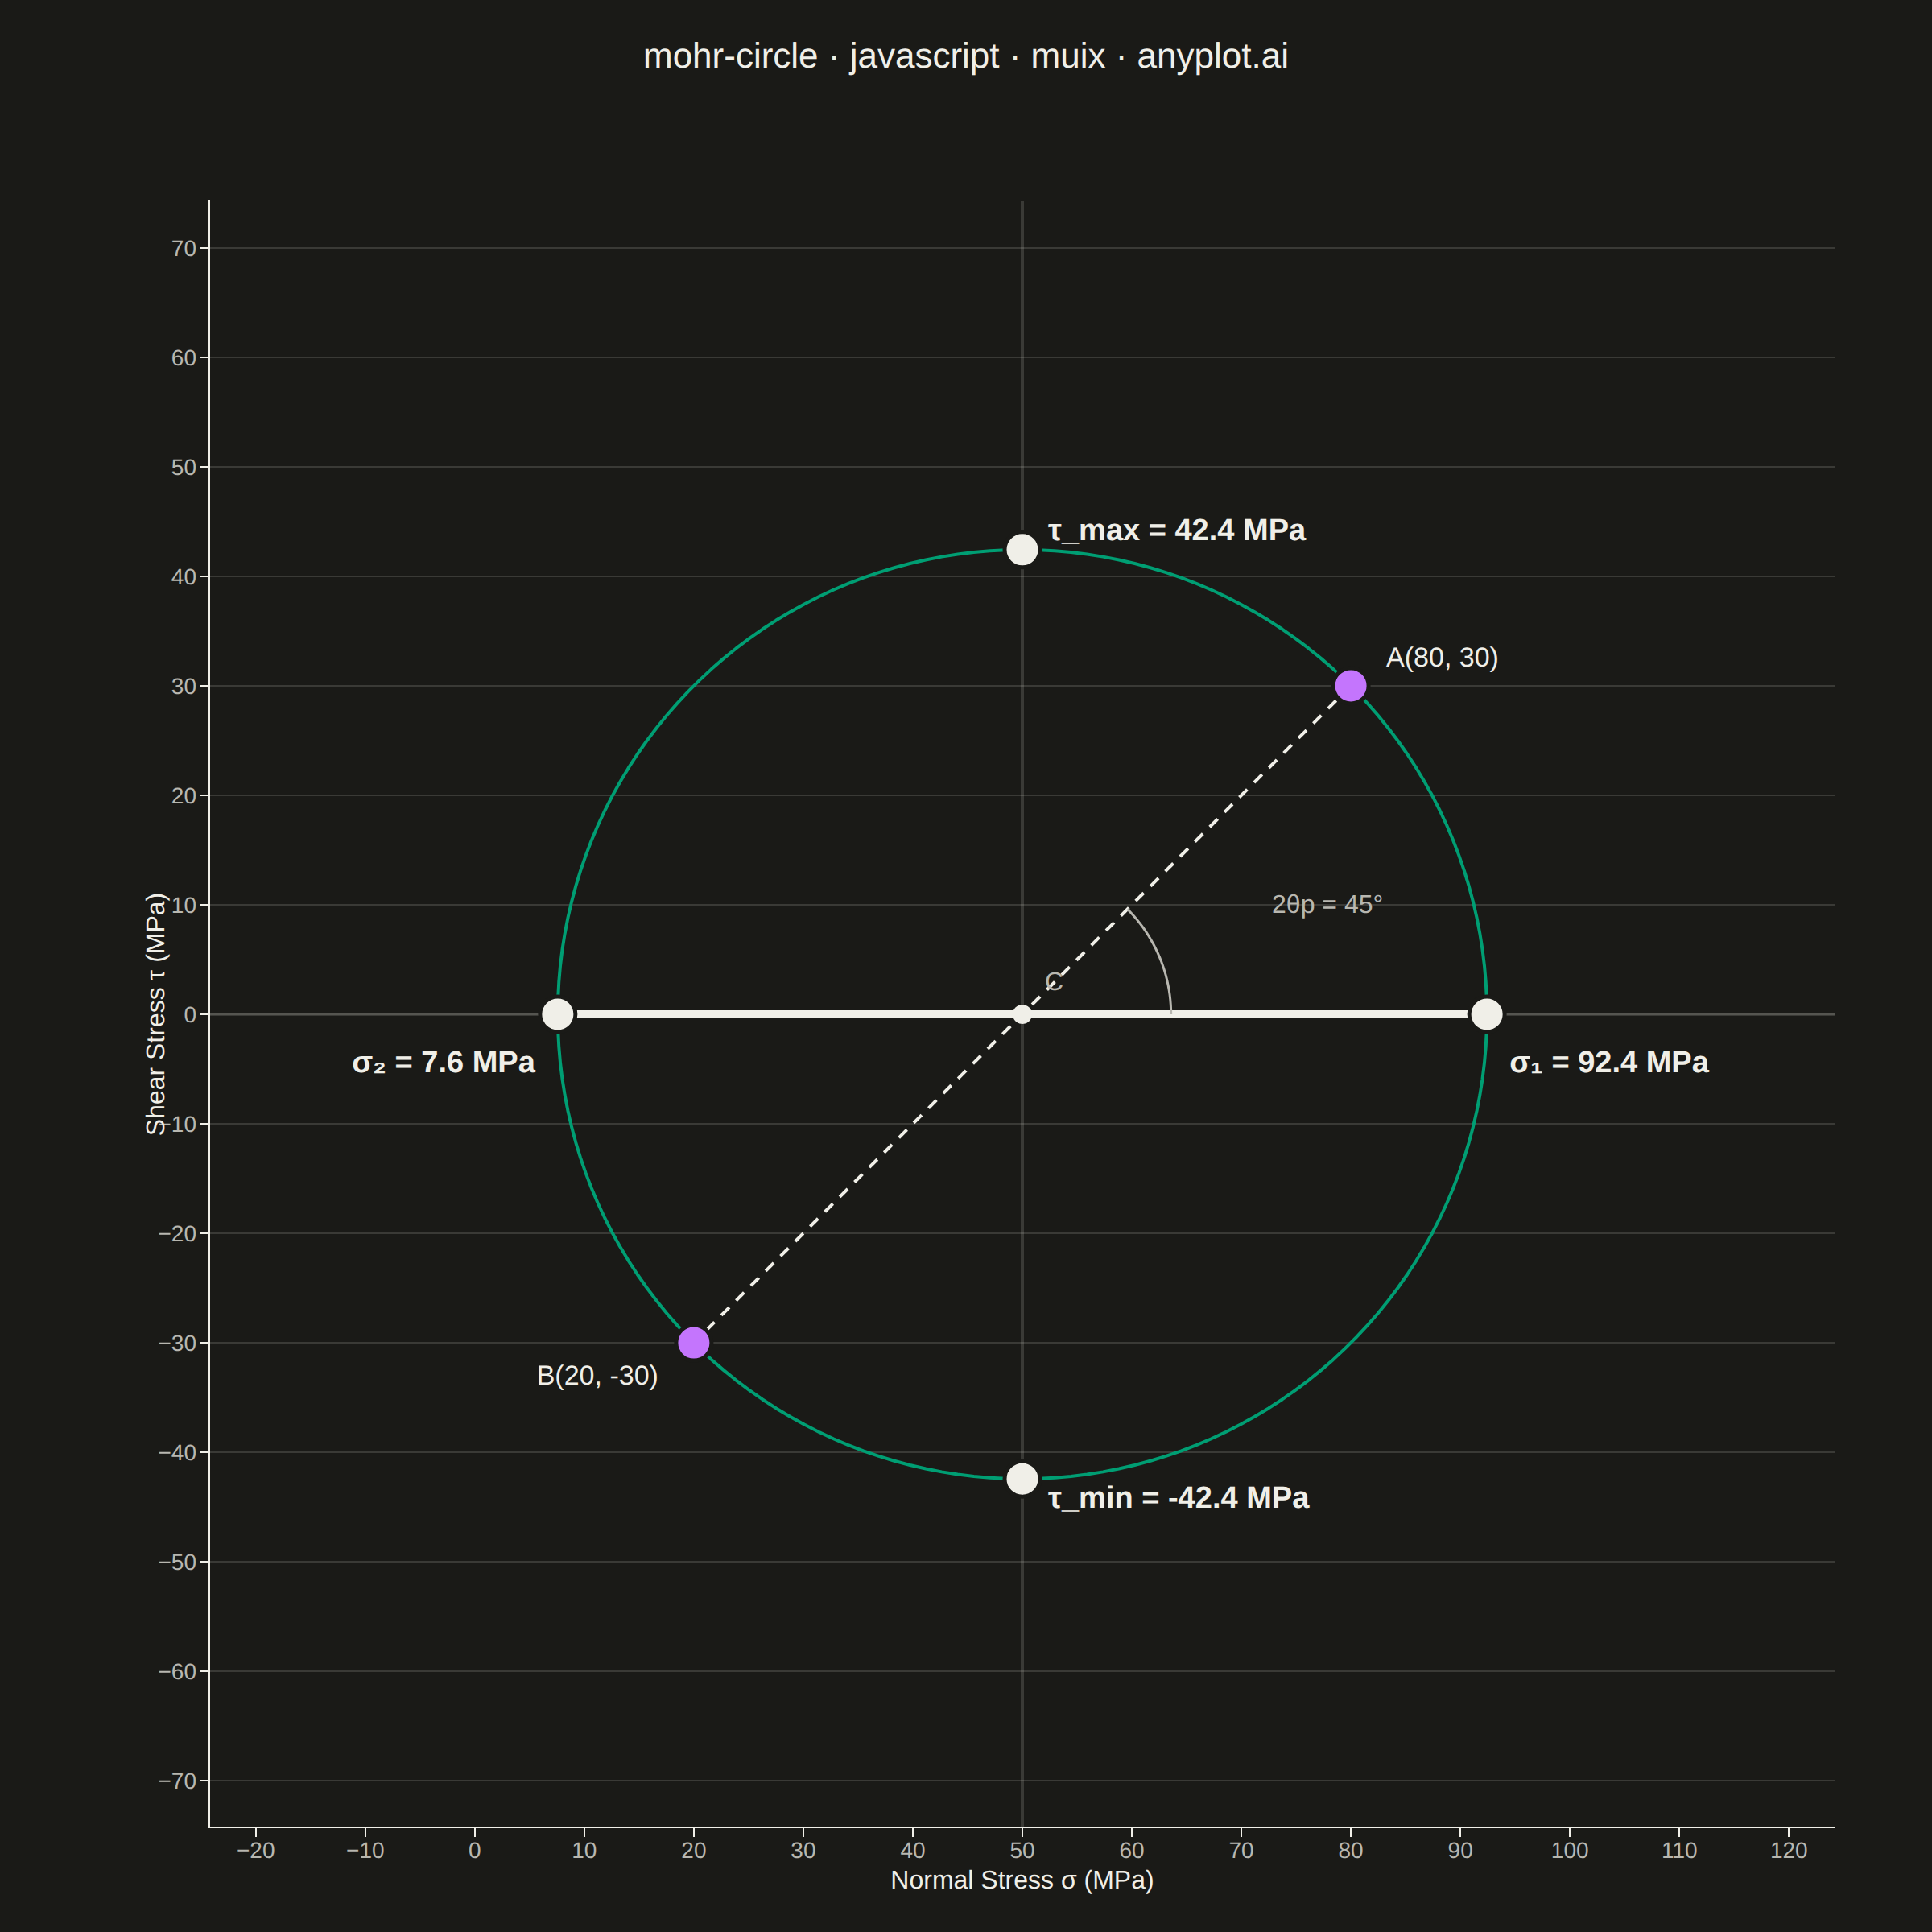
The same plot in 14 other libraries — JavaScript: Chart.js, D3.js, Apache ECharts, Highcharts; Python: Altair, Bokeh, lets-plot, Matplotlib, Plotly, plotnine, Pygal, Seaborn; R: ggplot2; Julia: Makie.jl. Compare all 15 side by side: Mohr's Circle for Stress Analysis in Python, R, Julia and JavaScript.
Mohr's Circle is a graphical method used to determine principal stresses, maximum shear stress, and stress transformations from a given 2D stress state. A circle is drawn on a normal stress (σ) vs. shear stress (τ) plane, with the center at ((σx + σy) / 2, 0) and a radius derived from the stress components. It is an essential tool in mechanical and civil engineering for visualizing how stress components change under coordinate rotation.
// anyplot.ai
// mohr-circle: Mohr's Circle for Stress Analysis
// Library: muix 7.29.1 | JavaScript 22.23.2
// Quality: 90/100 | Created: 2026-08-26
//# anyplot-orientation: square
// anyplot.ai
// mohr-circle: Mohr's Circle for Stress Analysis
// Library: MUI X Charts | React | Node 22
// License: @mui/x-charts — MIT (community). Pro/Premium are out of scope.
// Quality: pending | Created: 2026-08-26
import { ChartContainer } from "@mui/x-charts/ChartContainer";
import { LinePlot } from "@mui/x-charts/LineChart";
import { ChartsXAxis } from "@mui/x-charts/ChartsXAxis";
import { ChartsYAxis } from "@mui/x-charts/ChartsYAxis";
import { ChartsGrid } from "@mui/x-charts/ChartsGrid";
import { ChartsReferenceLine } from "@mui/x-charts/ChartsReferenceLine";
import { ChartsText } from "@mui/x-charts/ChartsText";
import { useXScale, useYScale } from "@mui/x-charts/hooks";

const t = window.ANYPLOT_TOKENS;

// --- Stress state (in-memory, deterministic) --------------------------------
const sigmaX = 80; // MPa — normal stress on the x-face
const sigmaY = 20; // MPa — normal stress on the y-face
const tauXY = 30; // MPa — shear stress on the xy-plane

const center = (sigmaX + sigmaY) / 2;
const radius = Math.sqrt(((sigmaX - sigmaY) / 2) ** 2 + tauXY ** 2);
const sigma1 = center + radius;
const sigma2 = center - radius;
const tauMax = radius;
const twoThetaPDeg = (Math.atan2(tauXY, (sigmaX - sigmaY) / 2) * 180) / Math.PI;

// --- Circle geometry, sampled parametrically (x is non-monotonic, so the
// line series is positioned via an explicit numeric xAxis.data array rather
// than relying on a sorted/categorical axis) --------------------------------
const CIRCLE_STEPS = 180;
const circleX = [];
const circleY = [];
for (let i = 0; i <= CIRCLE_STEPS; i++) {
  const angle = (i / CIRCLE_STEPS) * 2 * Math.PI;
  circleX.push(center + radius * Math.cos(angle));
  circleY.push(radius * Math.sin(angle));
}

// --- Axis domain — equal span on both axes; combined with the equal-size
// drawing area (see MARGIN below) this keeps the circle a true circle. ------
const PAD = radius * 0.75;
const X_MIN = center - radius - PAD;
const X_MAX = center + radius + PAD;
const Y_MIN = -radius - PAD;
const Y_MAX = radius + PAD;

const TITLE = "mohr-circle · javascript · muix · anyplot.ai";
const TITLE_HEIGHT = 70;

// left+right and top+bottom leave an equal-size square drawing area — the
// hard requirement for the circle to render with a true 1:1 aspect ratio.
const MARGIN = { top: 55, bottom: 65, left: 130, right: 60 };

// --- Custom overlay: stress points, reference diameter, angle callout -------
// Community `@mui/x-charts/hooks` (useXScale/useYScale) map data coordinates
// to pixels so the annotations stay aligned with the circle at any size.
function MohrAnnotations() {
  const xScale = useXScale();
  const yScale = useYScale();
  const toPx = (x, y) => ({ x: xScale(x), y: yScale(y) });

  const c = toPx(center, 0);
  const pointA = toPx(sigmaX, tauXY);
  const pointB = toPx(sigmaY, -tauXY);
  const pointS1 = toPx(sigma1, 0);
  const pointS2 = toPx(sigma2, 0);
  const pointTauMax = toPx(center, tauMax);
  const pointTauMin = toPx(center, -tauMax);

  const arcRadius = radius * 0.32;
  const arcStepCount = 24;
  const twoThetaPRad = (twoThetaPDeg * Math.PI) / 180;
  const arcPath = Array.from({ length: arcStepCount + 1 }, (_, i) => {
    const angle = (twoThetaPRad * i) / arcStepCount;
    return toPx(center + arcRadius * Math.cos(angle), arcRadius * Math.sin(angle));
  })
    .map((p, i) => `${i === 0 ? "M" : "L"} ${p.x} ${p.y}`)
    .join(" ");
  const angleLabelPos = toPx(
    center + arcRadius * 1.7 * Math.cos(twoThetaPRad / 2),
    arcRadius * 1.7 * Math.sin(twoThetaPRad / 2),
  );

  const stateColor = t.palette[1]; // the given stress-state points A and B
  const landmarkColor = t.ink; // derived circle geometry (neutral / reference)

  return (
    <g>
      {/* Principal-stress axis — a bold neutral segment between sigma2/sigma1
          makes the headline result the diagram's clear focal point. */}
      <line x1={pointS2.x} y1={pointS2.y} x2={pointS1.x} y2={pointS1.y} stroke={landmarkColor} strokeWidth={5} strokeLinecap="round" />
      <line
        x1={pointA.x}
        y1={pointA.y}
        x2={pointB.x}
        y2={pointB.y}
        stroke={t.ink}
        strokeWidth={2}
        strokeDasharray="7 6"
      />
      <path d={arcPath} fill="none" stroke={t.inkSoft} strokeWidth={1.5} />

      <circle cx={c.x} cy={c.y} r={6} fill={landmarkColor} />
      {[pointS1, pointS2, pointTauMax, pointTauMin].map((p, i) => (
        <circle key={i} cx={p.x} cy={p.y} r={11} fill={landmarkColor} stroke={t.pageBg} strokeWidth={2.5} />
      ))}
      {[pointA, pointB].map((p, i) => (
        <circle key={i} cx={p.x} cy={p.y} r={11} fill={stateColor} stroke={t.pageBg} strokeWidth={2.5} />
      ))}

      <ChartsText
        x={pointA.x + 22}
        y={pointA.y - 18}
        text={`A(${sigmaX}, ${tauXY})`}
        style={{ fontSize: 17, fill: t.ink, dominantBaseline: "central" }}
      />
      <ChartsText
        x={pointB.x - 22}
        y={pointB.y + 20}
        text={`B(${sigmaY}, ${-tauXY})`}
        style={{ fontSize: 17, fill: t.ink, textAnchor: "end", dominantBaseline: "central" }}
      />
      {/* Principal-stress / shear results — bolder and larger than the
          supporting geometry labels so they read as the headline numbers. */}
      <ChartsText
        x={pointS1.x + 14}
        y={pointS1.y + 30}
        text={`σ₁ = ${sigma1.toFixed(1)} MPa`}
        style={{ fontSize: 19, fontWeight: 700, fill: t.ink, dominantBaseline: "central" }}
      />
      <ChartsText
        x={pointS2.x - 14}
        y={pointS2.y + 30}
        text={`σ₂ = ${sigma2.toFixed(1)} MPa`}
        style={{ fontSize: 19, fontWeight: 700, fill: t.ink, textAnchor: "end", dominantBaseline: "central" }}
      />
      <ChartsText
        x={pointTauMax.x + 16}
        y={pointTauMax.y - 12}
        text={`τ_max = ${tauMax.toFixed(1)} MPa`}
        style={{ fontSize: 19, fontWeight: 700, fill: t.ink, dominantBaseline: "central" }}
      />
      <ChartsText
        x={pointTauMin.x + 16}
        y={pointTauMin.y + 12}
        text={`τ_min = ${(-tauMax).toFixed(1)} MPa`}
        style={{ fontSize: 19, fontWeight: 700, fill: t.ink, dominantBaseline: "central" }}
      />
      <ChartsText
        x={c.x + 14}
        y={c.y - 20}
        text="C"
        style={{ fontSize: 16, fill: t.inkSoft, dominantBaseline: "central" }}
      />
      <ChartsText
        x={angleLabelPos.x + 10}
        y={angleLabelPos.y - 8}
        text={`2θp = ${twoThetaPDeg.toFixed(0)}°`}
        style={{ fontSize: 16, fill: t.inkSoft, dominantBaseline: "central" }}
      />
    </g>
  );
}

// --- Chart (default-exported component — the harness mounts it) -------------
export default function Chart() {
  return (
    <div
      style={{
        width: window.ANYPLOT_SIZE.width,
        height: window.ANYPLOT_SIZE.height,
        display: "flex",
        flexDirection: "column",
      }}
    >
      <div
        style={{
          height: TITLE_HEIGHT,
          display: "flex",
          alignItems: "center",
          justifyContent: "center",
          fontSize: 22,
          fontWeight: 500,
          color: t.ink,
        }}
      >
        {TITLE}
      </div>
      <ChartContainer
        width={window.ANYPLOT_SIZE.width}
        height={window.ANYPLOT_SIZE.height - TITLE_HEIGHT}
        margin={MARGIN}
        skipAnimation
        xAxis={[{ scaleType: "linear", data: circleX, min: X_MIN, max: X_MAX }]}
        yAxis={[{ scaleType: "linear", min: Y_MIN, max: Y_MAX }]}
        series={[{ type: "line", data: circleY, color: t.palette[0], curve: "linear", showMark: false }]}
      >
        <ChartsGrid horizontal />
        <ChartsReferenceLine y={0} lineStyle={{ stroke: t.grid, strokeWidth: 2 }} />
        <ChartsReferenceLine x={center} lineStyle={{ stroke: t.grid, strokeWidth: 2 }} />
        <LinePlot />
        <MohrAnnotations />
        <ChartsXAxis
          label="Normal Stress σ (MPa)"
          labelStyle={{ fontSize: 16, fill: t.ink, fontWeight: 500 }}
          tickLabelStyle={{ fontSize: 14, fill: t.inkSoft }}
          stroke={t.inkSoft}
        />
        <ChartsYAxis
          label="Shear Stress τ (MPa)"
          labelStyle={{ fontSize: 16, fill: t.ink, fontWeight: 500 }}
          tickLabelStyle={{ fontSize: 14, fill: t.inkSoft }}
          stroke={t.inkSoft}
        />
      </ChartContainer>
    </div>
  );
}
Runnable source as JSON, for any HTTP client: https://api.anyplot.ai/specs/mohr-circle/muix/code. Any spec id and library id listed in llms-full.txt fit the same URL shape; every URL below is complete and callable.
{
  "spec_id": "mohr-circle",
  "language": "javascript",
  "library": "muix",
  "page": "https://anyplot.ai/mohr-circle/javascript/muix",
  "hub": "https://anyplot.ai/mohr-circle",
  "code_json": "https://api.anyplot.ai/specs/mohr-circle/muix/code",
  "spec_json": "https://api.anyplot.ai/specs/mohr-circle",
  "render_light_png": "https://storage.googleapis.com/anyplot-images/plots/mohr-circle/javascript/muix/plot-light.png",
  "render_dark_png": "https://storage.googleapis.com/anyplot-images/plots/mohr-circle/javascript/muix/plot-dark.png",
  "interactive_light_html": "https://storage.googleapis.com/anyplot-images/plots/mohr-circle/javascript/muix/plot-light.html",
  "interactive_dark_html": "https://storage.googleapis.com/anyplot-images/plots/mohr-circle/javascript/muix/plot-dark.html",
  "quality_score": 90.0,
  "license": "MIT",
  "guide": "https://anyplot.ai/llms.txt"
}
Part of Mohr's Circle for Stress Analysis on anyplot.ai.