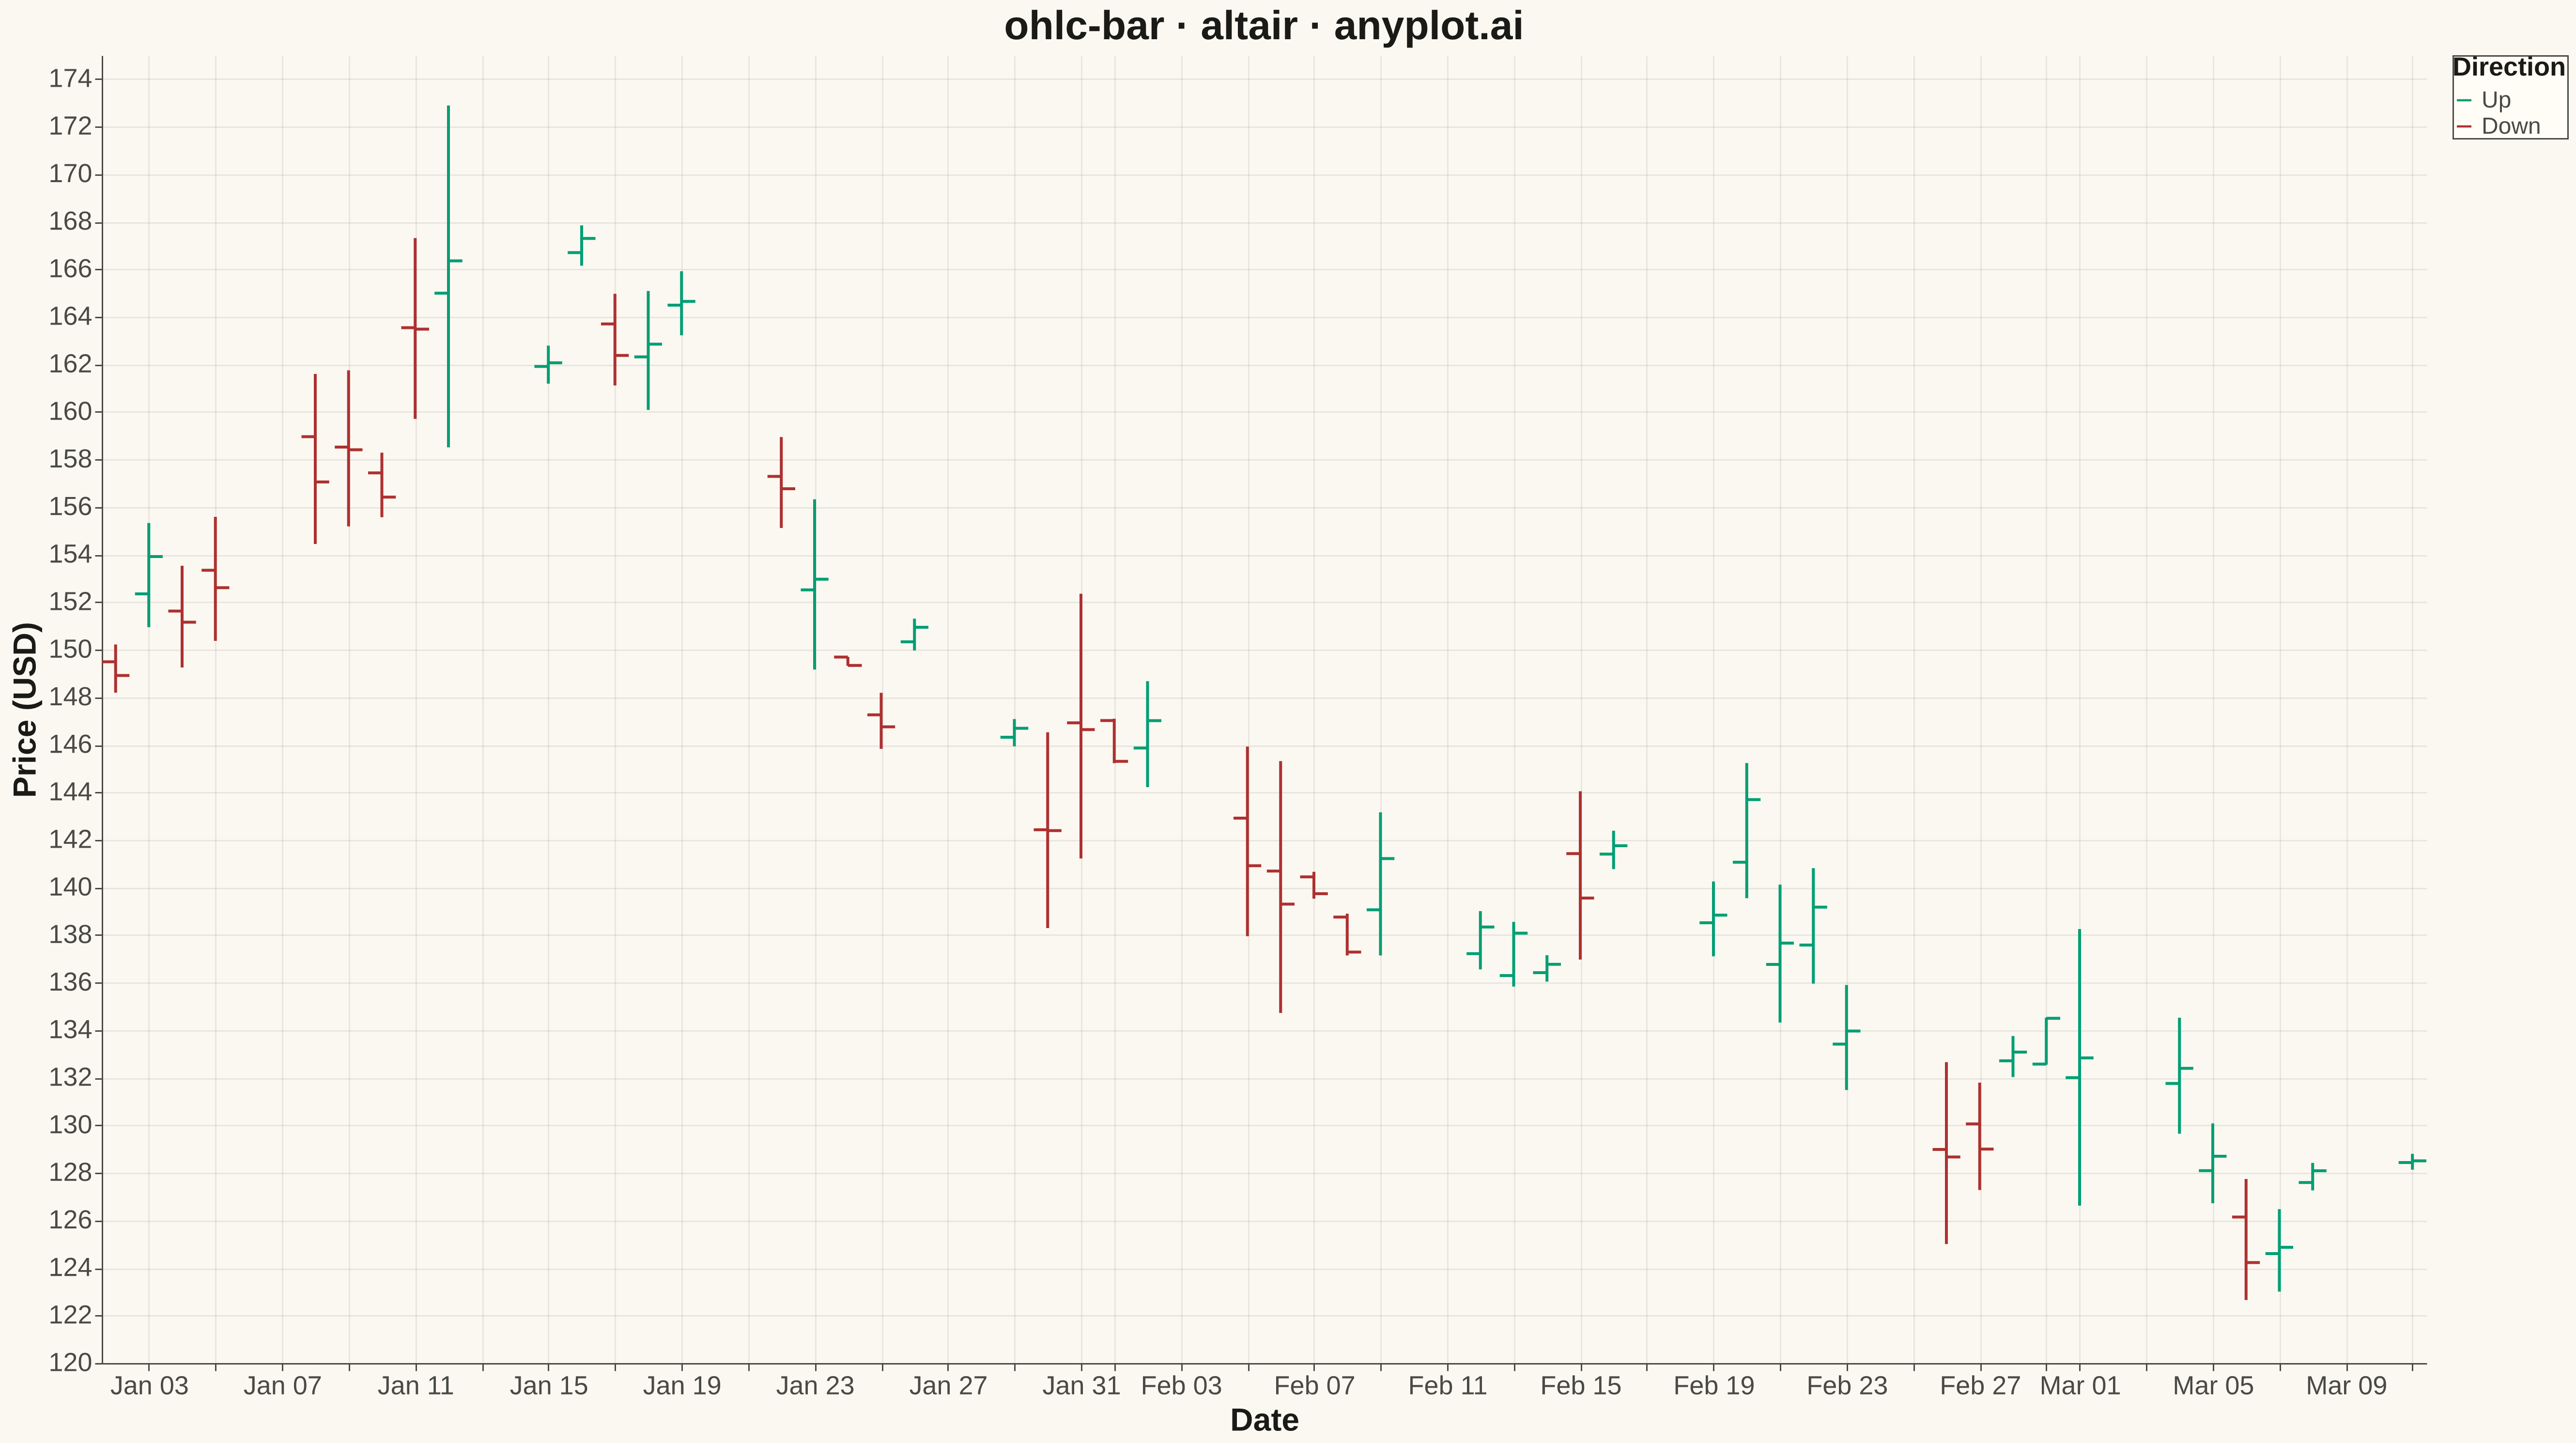
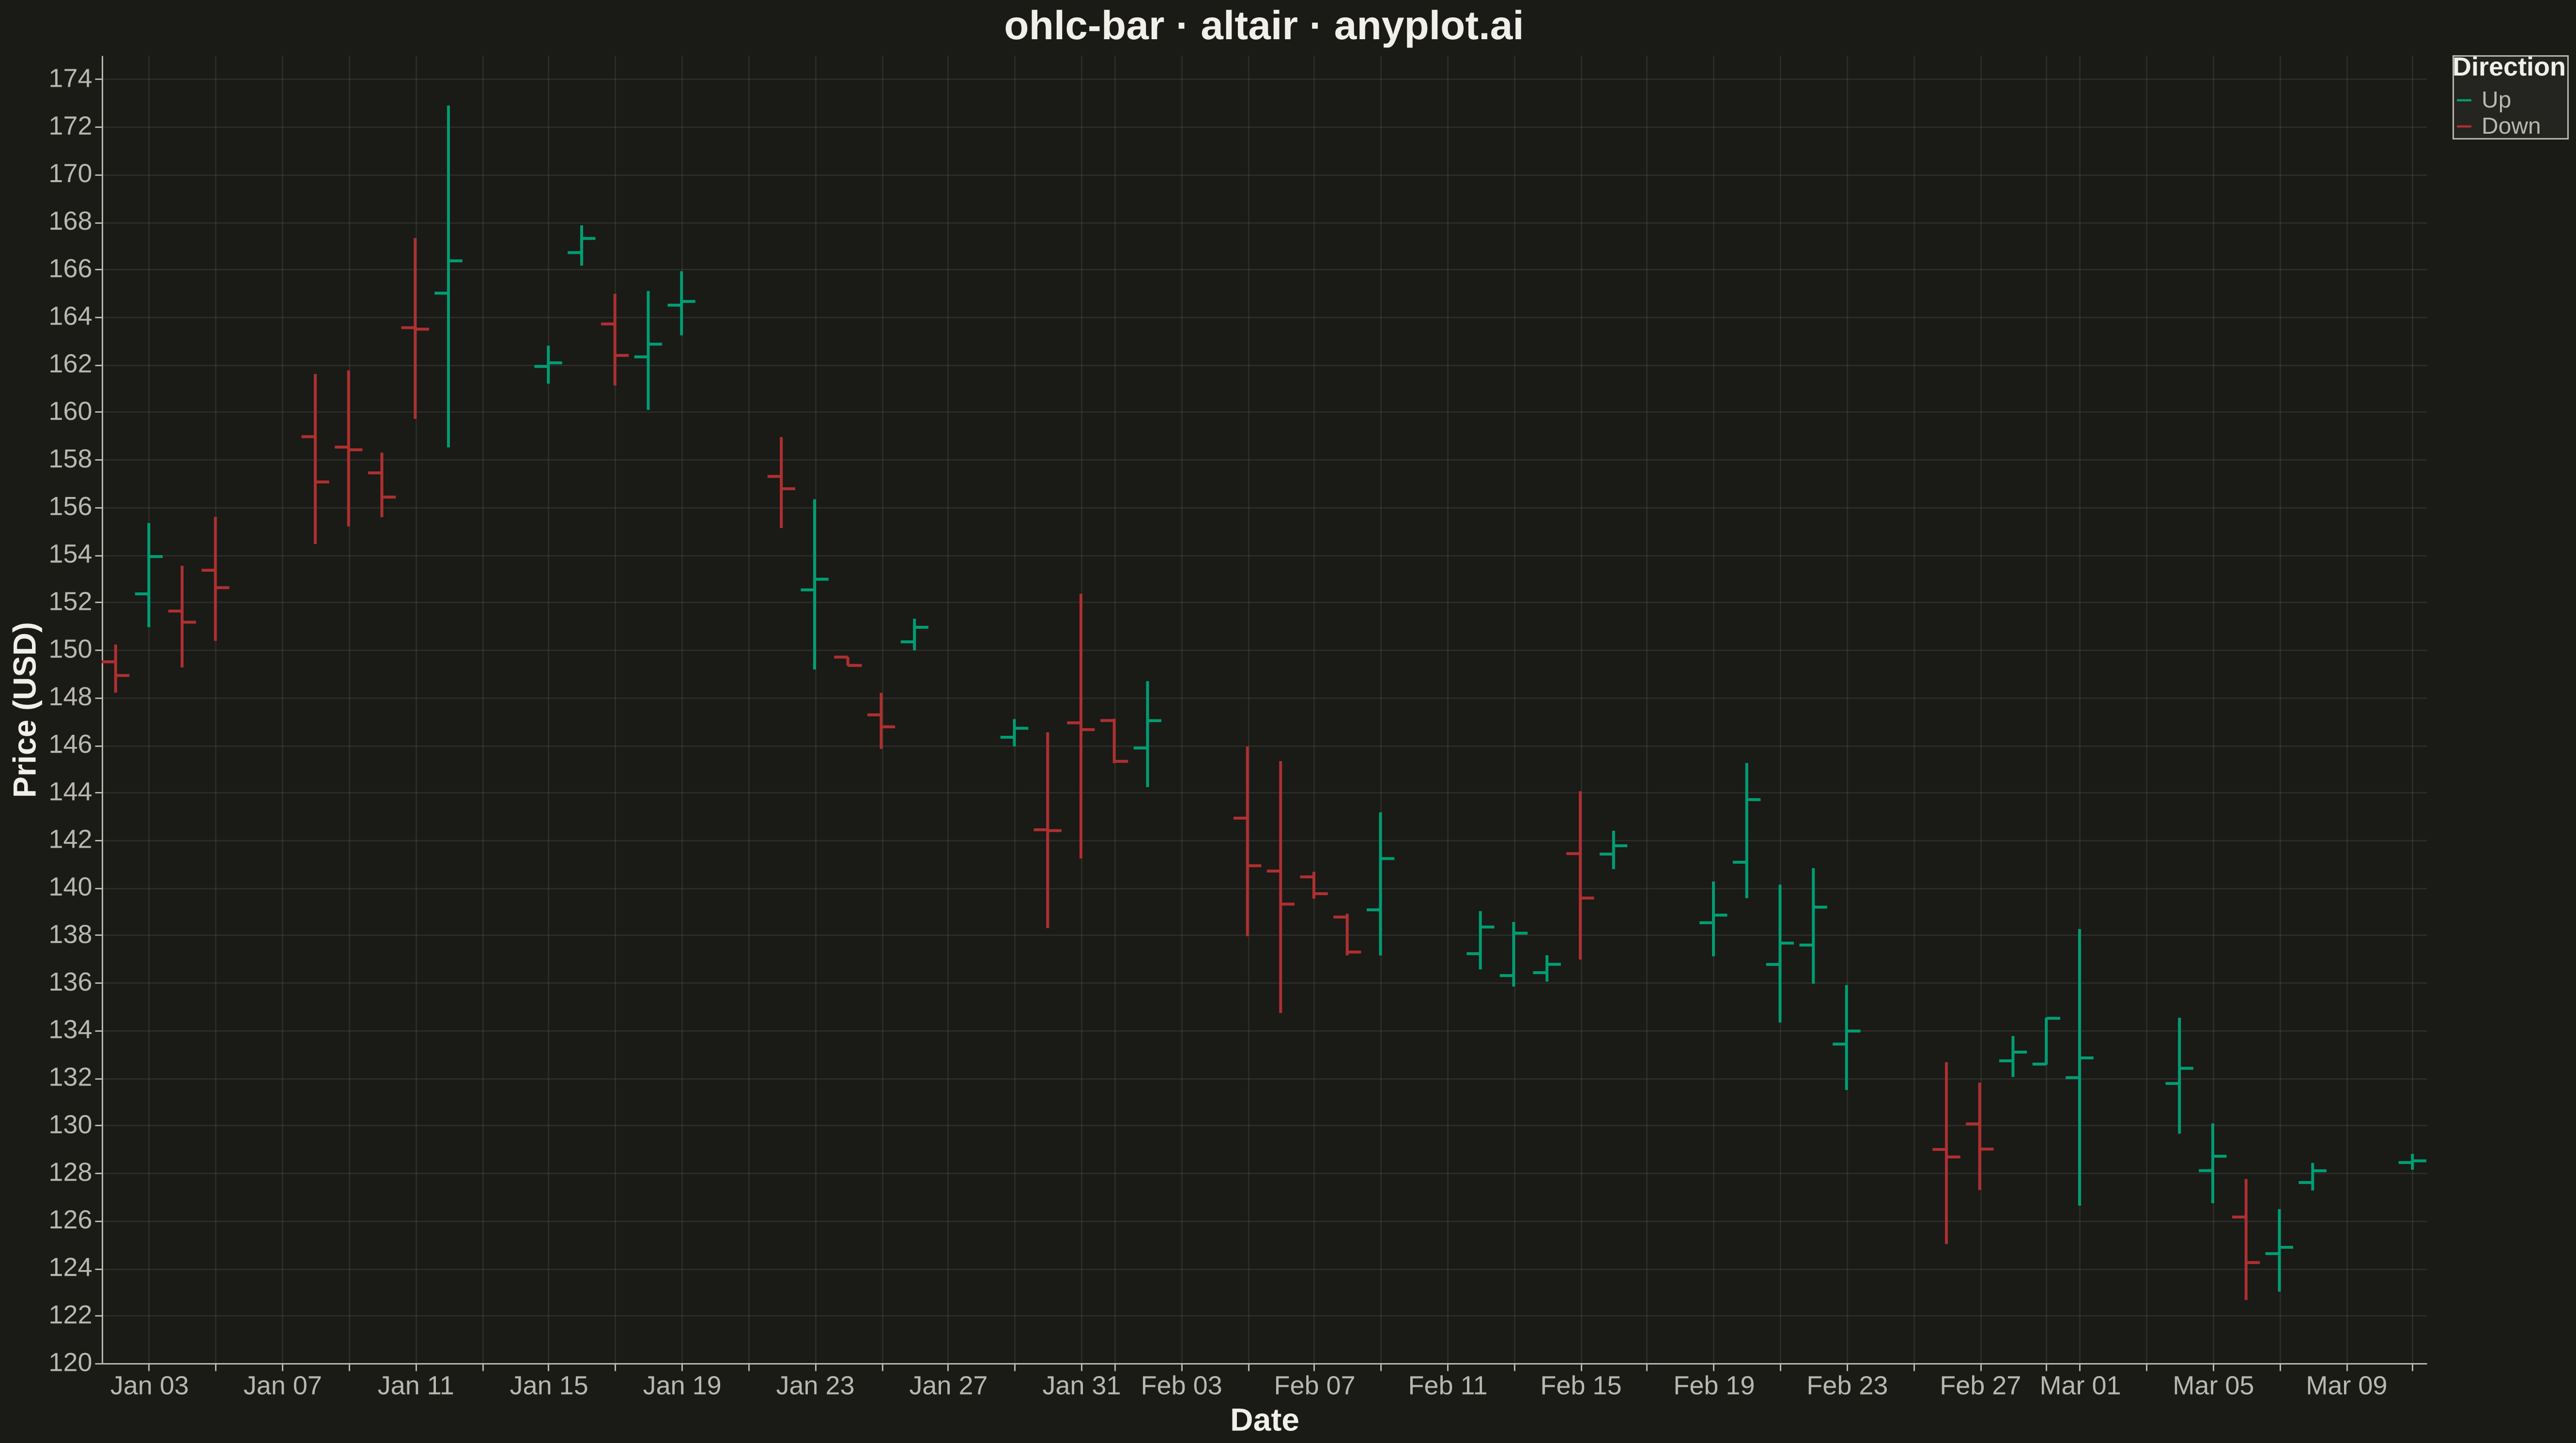
An OHLC (Open-High-Low-Close) bar chart displays financial price data using vertical bars with horizontal tick marks. Each bar shows the price range from high to low as a thin vertical line, with a left tick indicating the opening price and a right tick indicating the closing price. Unlike candlestick charts that use colored bodies, OHLC bars provide a cleaner, less cluttered view favored by technical analysts who prefer to focus on price levels rather than visual patterns.
Preview render from the Altair implementation.