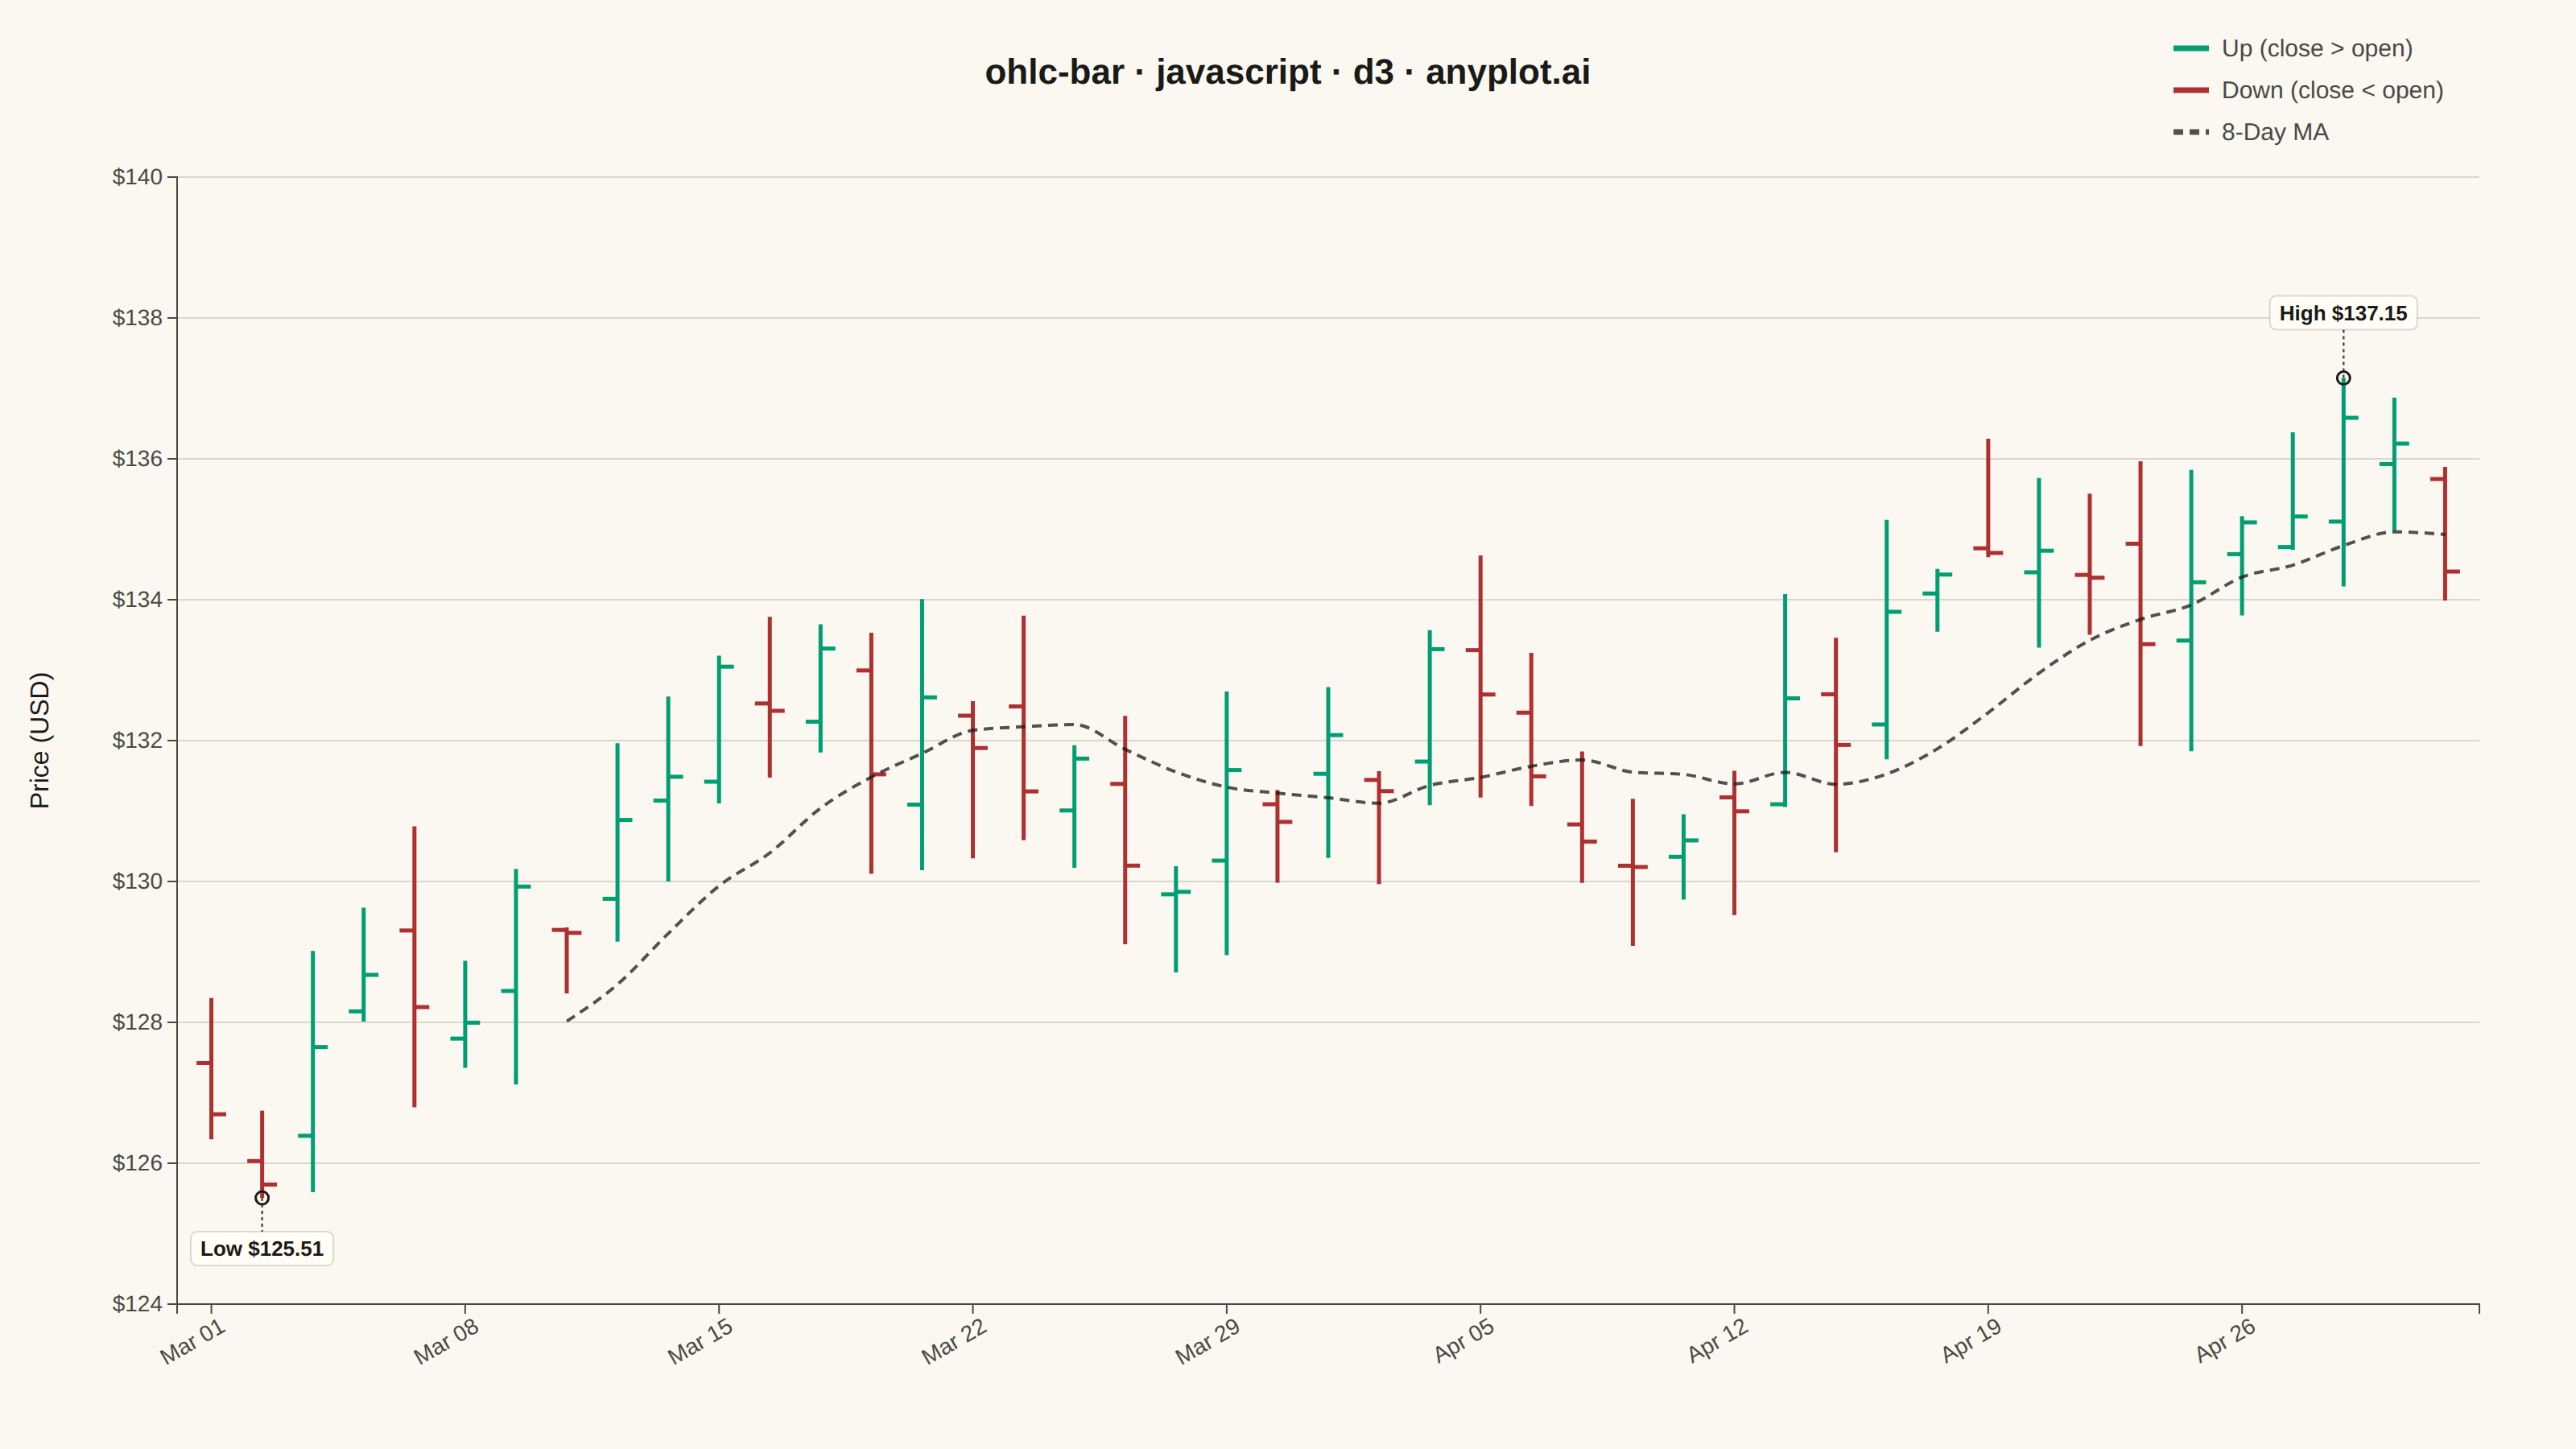
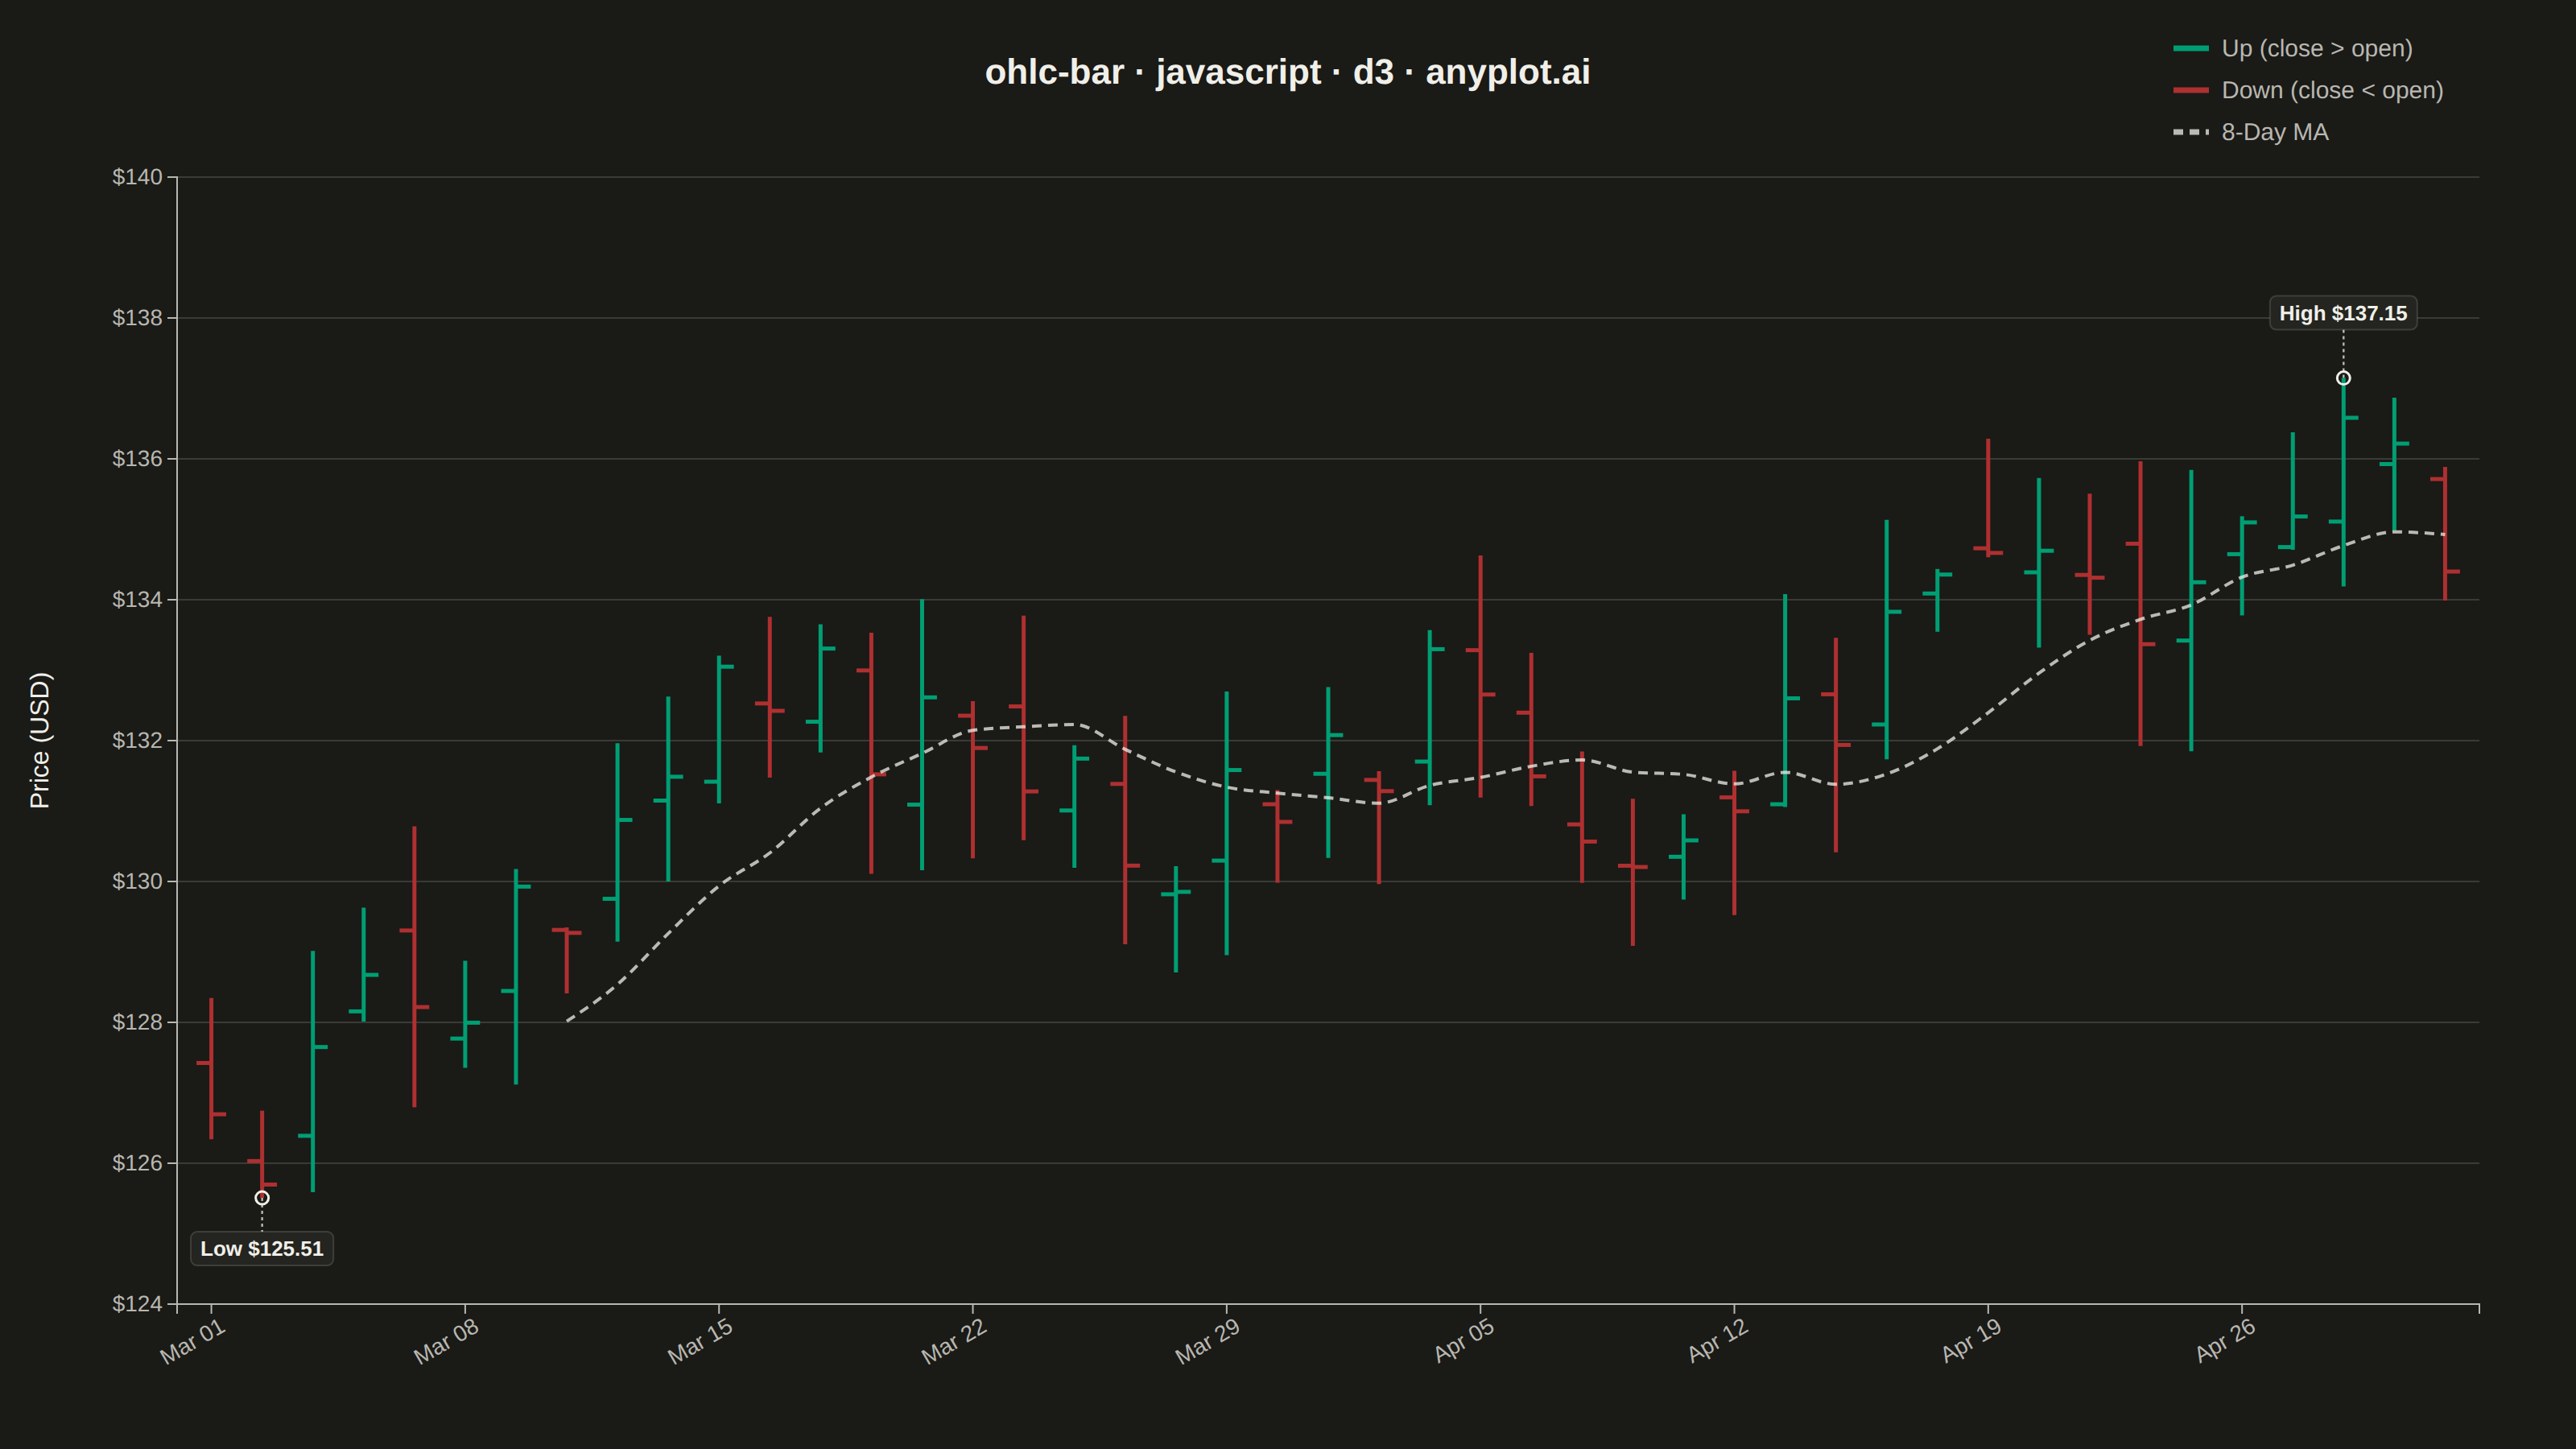
The same plot in 14 other libraries — JavaScript: Chart.js, Apache ECharts, Highcharts, MUI X Charts; Python: Altair, Bokeh, lets-plot, Matplotlib, Plotly, plotnine, Pygal, Seaborn; R: ggplot2; Julia: Makie.jl. Compare all 15 side by side: OHLC Bar Chart in Python, R, Julia and JavaScript.
An OHLC (Open-High-Low-Close) bar chart displays financial price data using vertical bars with horizontal tick marks. Each bar shows the price range from high to low as a thin vertical line, with a left tick indicating the opening price and a right tick indicating the closing price. Unlike candlestick charts that use colored bodies, OHLC bars provide a cleaner, less cluttered view favored by technical analysts who prefer to focus on price levels rather than visual patterns.
// anyplot.ai
// ohlc-bar: OHLC Bar Chart
// Library: d3 7.9.0 | JavaScript 22.23.2
// Quality: 93/100 | Created: 2026-09-02

const t = window.ANYPLOT_TOKENS;
const { width, height } = window.ANYPLOT_SIZE;
const margin = { top: 110, right: 60, bottom: 90, left: 110 };
const iw = width - margin.left - margin.right;
const ih = height - margin.top - margin.bottom;

// --- Data: 45 trading days of synthetic OHLC prices, fixed-seed LCG --------
let seed = 42;
function lcgRandom() {
  seed = (seed * 1664525 + 1013904223) % 4294967296;
  return seed / 4294967296;
}

const numDays = 45;
let date = new Date(2024, 2, 1);
let prevClose = 128;
const data = [];
while (data.length < numDays) {
  const day = date.getDay();
  if (day !== 0 && day !== 6) {
    const drift = (lcgRandom() - 0.48) * 3.2;
    const open = prevClose + (lcgRandom() - 0.5) * 1.4;
    const close = open + drift;
    const wickUp = lcgRandom() * 1.6;
    const wickDown = lcgRandom() * 1.6;
    const high = Math.max(open, close) + wickUp;
    const low = Math.min(open, close) - wickDown;
    data.push({ date: new Date(date), open, high, low, close });
    prevClose = close;
  }
  date.setDate(date.getDate() + 1);
}

// --- SVG mount ---------------------------------------------------------------
const svg = d3.select("#container").append("svg").attr("width", width).attr("height", height);
const g = svg.append("g").attr("transform", `translate(${margin.left},${margin.top})`);

// --- Scales --------------------------------------------------------------------
const x = d3
  .scaleBand()
  .domain(data.map((d) => d.date.toISOString()))
  .range([0, iw])
  .padding(0.35);

const priceExtent = d3.extent(data.flatMap((d) => [d.high, d.low]));
const pad = (priceExtent[1] - priceExtent[0]) * 0.08;
const y = d3
  .scaleLinear()
  .domain([priceExtent[0] - pad, priceExtent[1] + pad])
  .nice()
  .range([ih, 0]);

// --- Gridlines (y-axis only, subtle) --------------------------------------------
g.append("g")
  .call(d3.axisLeft(y).tickSize(-iw).tickFormat(""))
  .call((sel) => sel.select(".domain").remove())
  .selectAll("line")
  .attr("stroke", t.grid);

// --- Axes ------------------------------------------------------------------------
const tickEvery = Math.ceil(numDays / 9);
const xAxis = g
  .append("g")
  .attr("transform", `translate(0,${ih})`)
  .call(
    d3
      .axisBottom(x)
      .tickValues(x.domain().filter((_, i) => i % tickEvery === 0))
      .tickFormat((d) => d3.timeFormat("%b %d")(new Date(d)))
  );
const yAxis = g.append("g").call(d3.axisLeft(y).tickFormat((d) => `$${d.toFixed(0)}`));

for (const ax of [xAxis, yAxis]) {
  ax.selectAll("text").attr("fill", t.inkSoft).style("font-size", "14px");
  ax.selectAll("line").attr("stroke", t.inkSoft);
  ax.select(".domain").attr("stroke", t.inkSoft);
}
xAxis.selectAll("text").attr("transform", "rotate(-30)").style("text-anchor", "end");

g.append("text")
  .attr("x", -ih / 2)
  .attr("y", -80)
  .attr("transform", "rotate(-90)")
  .attr("text-anchor", "middle")
  .attr("fill", t.ink)
  .style("font-size", "16px")
  .text("Price (USD)");

// --- OHLC bars ---------------------------------------------------------------
const bw = x.bandwidth();
const tickLen = Math.max(4, bw * 0.45);
const upColor = t.palette[0]; // brand green — close > open
const downColor = t.palette[4]; // matte red — close < open (finance semantic exception)

const bars = g
  .selectAll(".ohlc-bar")
  .data(data)
  .join("g")
  .attr("class", "ohlc-bar")
  .attr("transform", (d) => `translate(${x(d.date.toISOString()) + bw / 2},0)`);

bars
  .append("line")
  .attr("x1", 0)
  .attr("x2", 0)
  .attr("y1", (d) => y(d.high))
  .attr("y2", (d) => y(d.low))
  .attr("stroke", (d) => (d.close >= d.open ? upColor : downColor))
  .attr("stroke-width", 2.5);

bars
  .append("line")
  .attr("x1", -tickLen)
  .attr("x2", 0)
  .attr("y1", (d) => y(d.open))
  .attr("y2", (d) => y(d.open))
  .attr("stroke", (d) => (d.close >= d.open ? upColor : downColor))
  .attr("stroke-width", 2.5);

bars
  .append("line")
  .attr("x1", 0)
  .attr("x2", tickLen)
  .attr("y1", (d) => y(d.close))
  .attr("y2", (d) => y(d.close))
  .attr("stroke", (d) => (d.close >= d.open ? upColor : downColor))
  .attr("stroke-width", 2.5);

// --- Moving-average overlay (d3-shape line generator, smoothed) ------------------
const maWindow = 8;
const maData = data
  .map((d, i) => (i < maWindow - 1 ? null : { date: d.date, value: d3.mean(data.slice(i - maWindow + 1, i + 1), (s) => s.close) }))
  .filter((d) => d !== null);

const maLine = d3
  .line()
  .curve(d3.curveMonotoneX)
  .x((d) => x(d.date.toISOString()) + bw / 2)
  .y((d) => y(d.value));

g.append("path")
  .datum(maData)
  .attr("fill", "none")
  .attr("stroke", t.ink)
  .attr("stroke-width", 2)
  .attr("stroke-dasharray", "6,4")
  .attr("stroke-opacity", 0.75)
  .attr("d", maLine);

// --- Extreme callouts (highlight the period high/low for a clear focal point) ----
function addExtremeCallout(point, priceKey, label, direction) {
  const cx = x(point.date.toISOString()) + bw / 2;
  const cy = y(point[priceKey]);
  const leaderLen = 30;
  const textY = cy + (direction === "up" ? -leaderLen - 6 : leaderLen + 6);
  const calloutG = g.append("g").attr("class", "extreme-callout");

  calloutG
    .append("line")
    .attr("x1", cx)
    .attr("y1", cy)
    .attr("x2", cx)
    .attr("y2", cy + (direction === "up" ? -leaderLen : leaderLen))
    .attr("stroke", t.inkSoft)
    .attr("stroke-width", 1.2)
    .attr("stroke-dasharray", "2,2");

  calloutG
    .append("circle")
    .attr("cx", cx)
    .attr("cy", cy)
    .attr("r", 4)
    .attr("fill", "none")
    .attr("stroke", t.ink)
    .attr("stroke-width", 1.5);

  const labelText = calloutG
    .append("text")
    .attr("x", cx)
    .attr("y", textY)
    .attr("text-anchor", "middle")
    .attr("fill", t.ink)
    .style("font-size", "13px")
    .style("font-weight", "600")
    .text(`${label} $${point[priceKey].toFixed(2)}`);

  const bbox = labelText.node().getBBox();
  calloutG
    .insert("rect", "text")
    .attr("x", bbox.x - 6)
    .attr("y", bbox.y - 3)
    .attr("width", bbox.width + 12)
    .attr("height", bbox.height + 6)
    .attr("rx", 4)
    .attr("fill", t.elevatedBg)
    .attr("stroke", t.grid);
}

const maxHighPoint = data.reduce((a, b) => (b.high > a.high ? b : a));
const minLowPoint = data.reduce((a, b) => (b.low < a.low ? b : a));
addExtremeCallout(maxHighPoint, "high", "High", "up");
addExtremeCallout(minLowPoint, "low", "Low", "down");

// --- Legend (semantic up/down colors + moving-average key) -----------------------
const legend = svg.append("g").attr("transform", `translate(${width - margin.right - 190},${margin.top - 80})`);
const legendItems = [
  { label: "Up (close > open)", color: upColor, dash: null },
  { label: "Down (close < open)", color: downColor, dash: null },
  { label: `${maWindow}-Day MA`, color: t.ink, dash: "6,4" },
];
legendItems.forEach((item, i) => {
  const row = legend.append("g").attr("transform", `translate(0,${i * 26})`);
  const swatch = row.append("line").attr("x1", 0).attr("x2", 22).attr("y1", 0).attr("y2", 0).attr("stroke", item.color).attr("stroke-width", 3.5);
  if (item.dash) swatch.attr("stroke-dasharray", item.dash).attr("stroke-opacity", 0.75);
  row
    .append("text")
    .attr("x", 30)
    .attr("y", 5)
    .attr("fill", t.inkSoft)
    .style("font-size", "15px")
    .text(item.label);
});

// --- Title -----------------------------------------------------------------------
svg
  .append("text")
  .attr("x", width / 2)
  .attr("y", 52)
  .attr("text-anchor", "middle")
  .attr("fill", t.ink)
  .style("font-size", "22px")
  .style("font-weight", "600")
  .text("ohlc-bar · javascript · d3 · anyplot.ai");
Runnable source as JSON, for any HTTP client: https://api.anyplot.ai/specs/ohlc-bar/d3/code. Any spec id and library id listed in llms-full.txt fit the same URL shape; every URL below is complete and callable.
{
  "spec_id": "ohlc-bar",
  "language": "javascript",
  "library": "d3",
  "page": "https://anyplot.ai/ohlc-bar/javascript/d3",
  "hub": "https://anyplot.ai/ohlc-bar",
  "code_json": "https://api.anyplot.ai/specs/ohlc-bar/d3/code",
  "spec_json": "https://api.anyplot.ai/specs/ohlc-bar",
  "render_light_png": "https://storage.googleapis.com/anyplot-images/plots/ohlc-bar/javascript/d3/plot-light.png",
  "render_dark_png": "https://storage.googleapis.com/anyplot-images/plots/ohlc-bar/javascript/d3/plot-dark.png",
  "interactive_light_html": "https://storage.googleapis.com/anyplot-images/plots/ohlc-bar/javascript/d3/plot-light.html",
  "interactive_dark_html": "https://storage.googleapis.com/anyplot-images/plots/ohlc-bar/javascript/d3/plot-dark.html",
  "quality_score": 93.0,
  "license": "MIT",
  "guide": "https://anyplot.ai/llms.txt"
}
Part of OHLC Bar Chart on anyplot.ai.