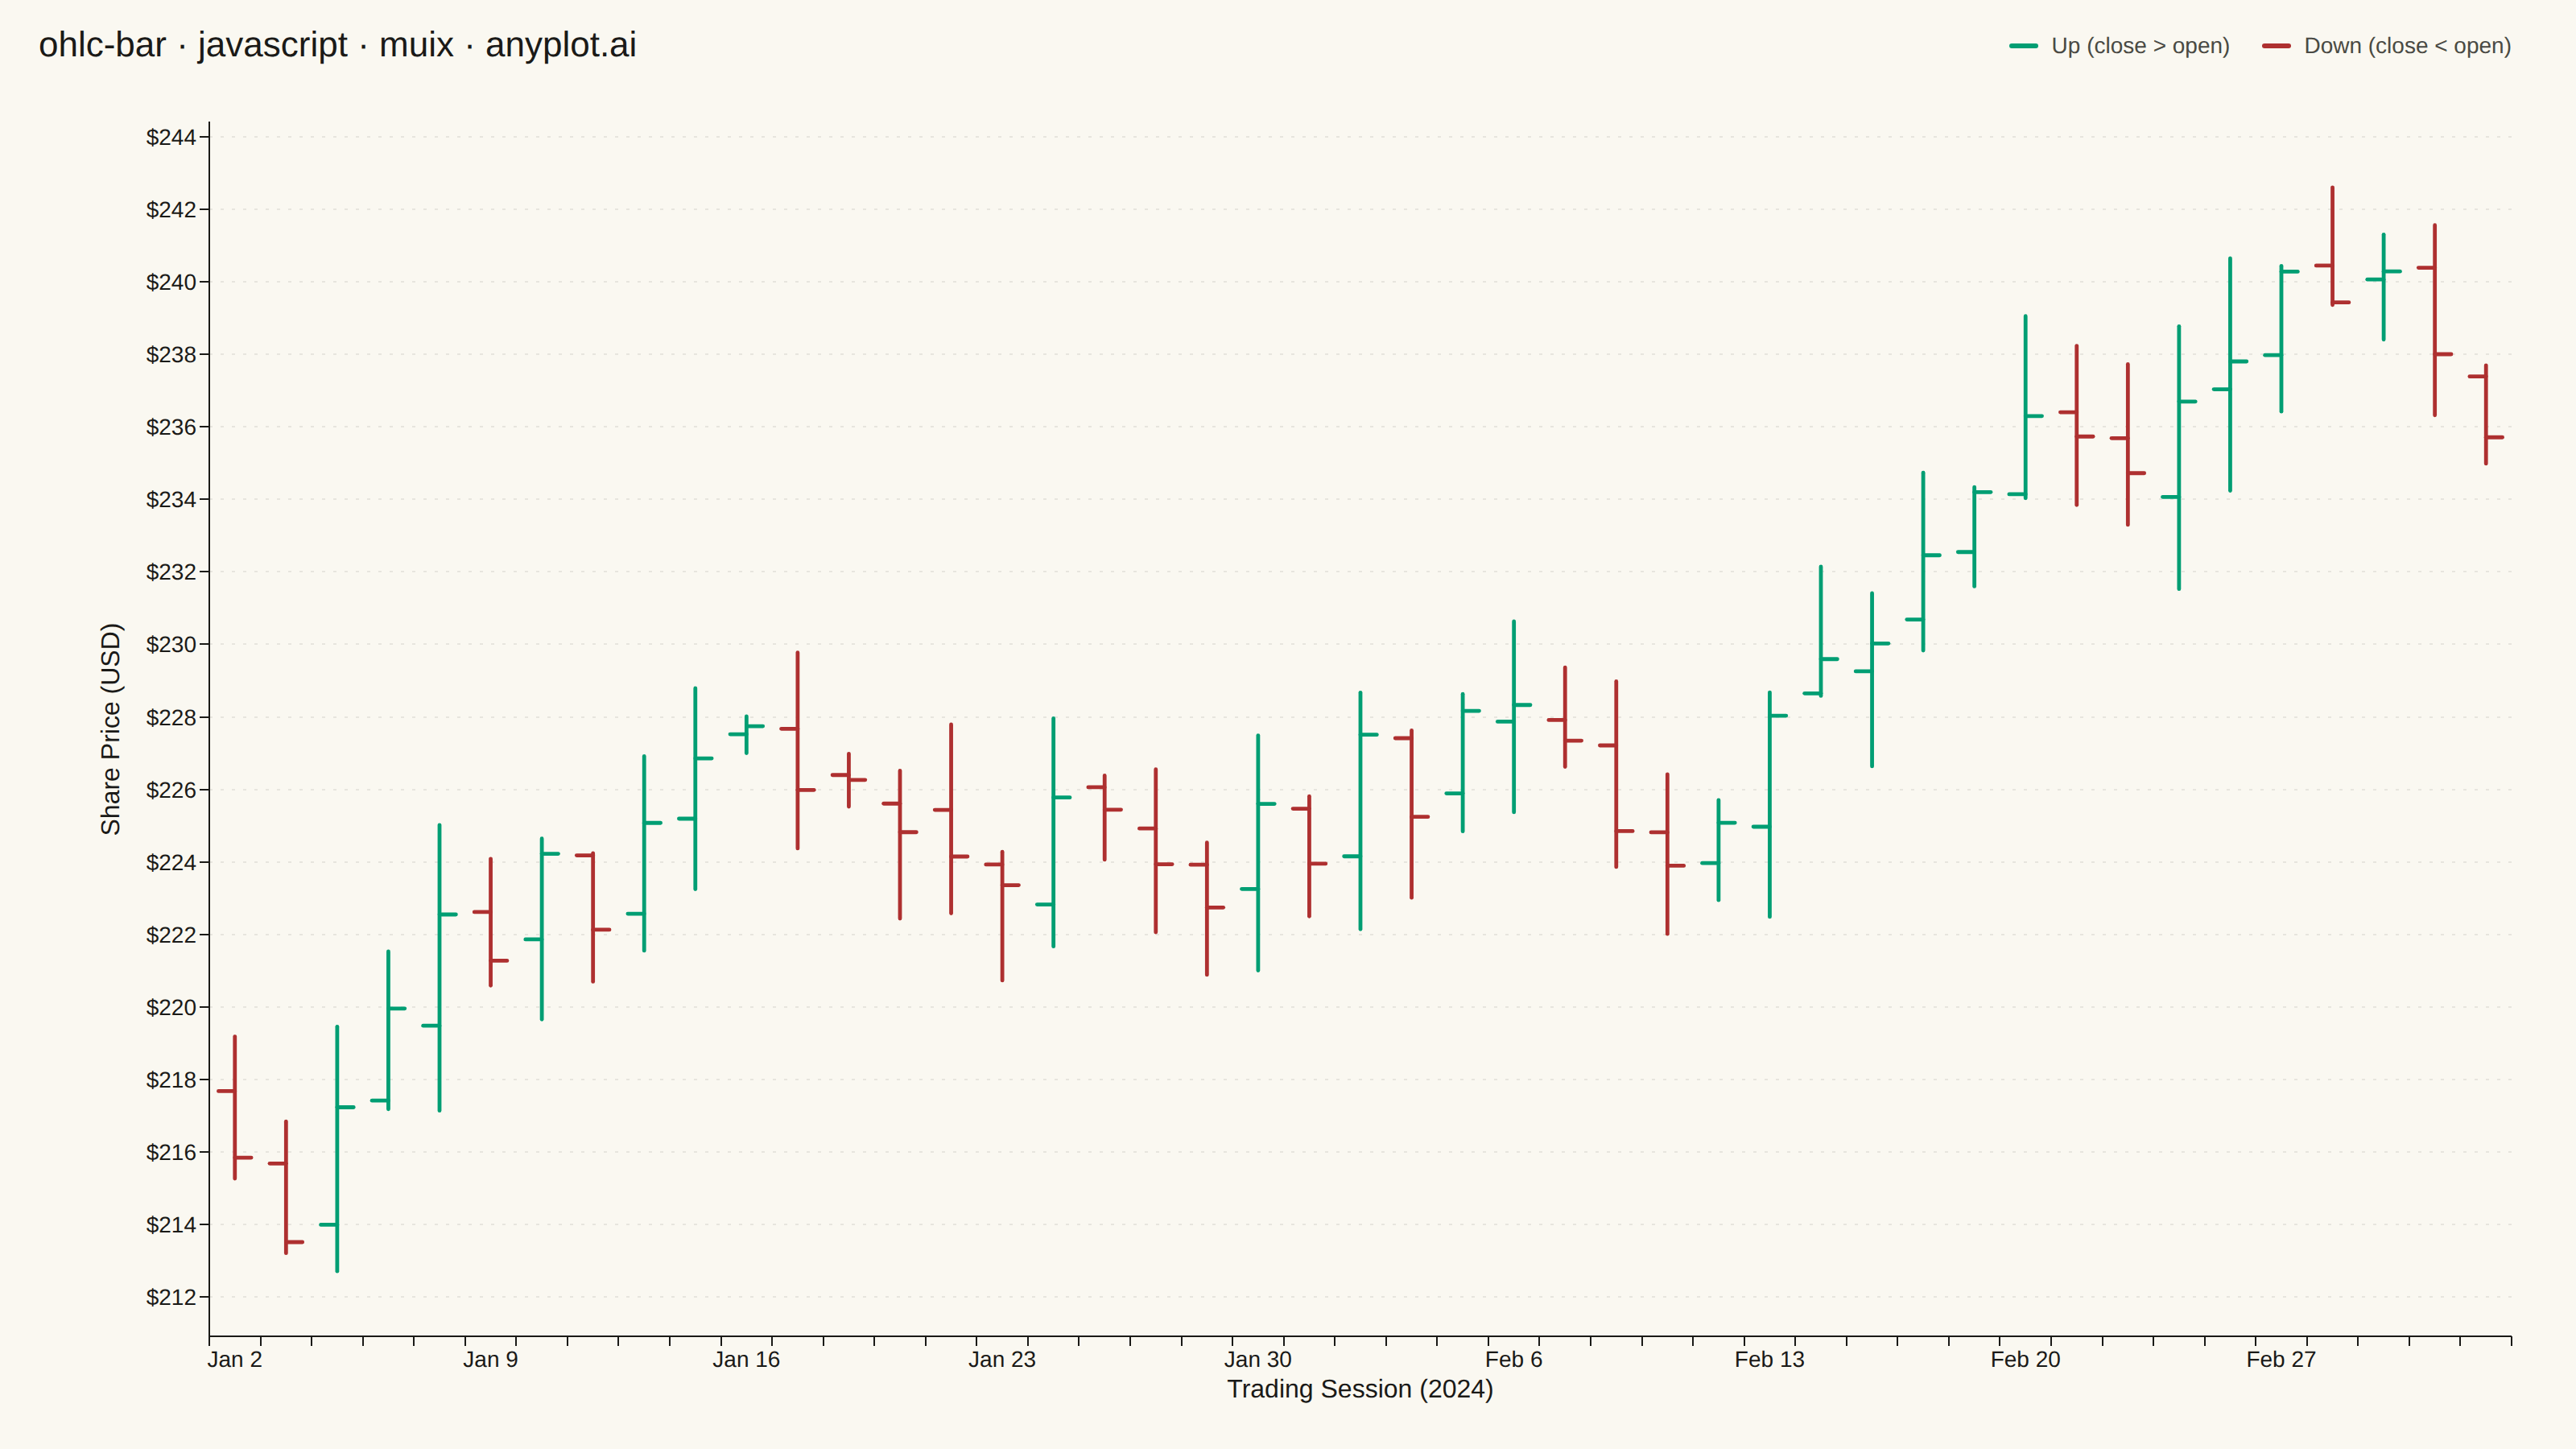
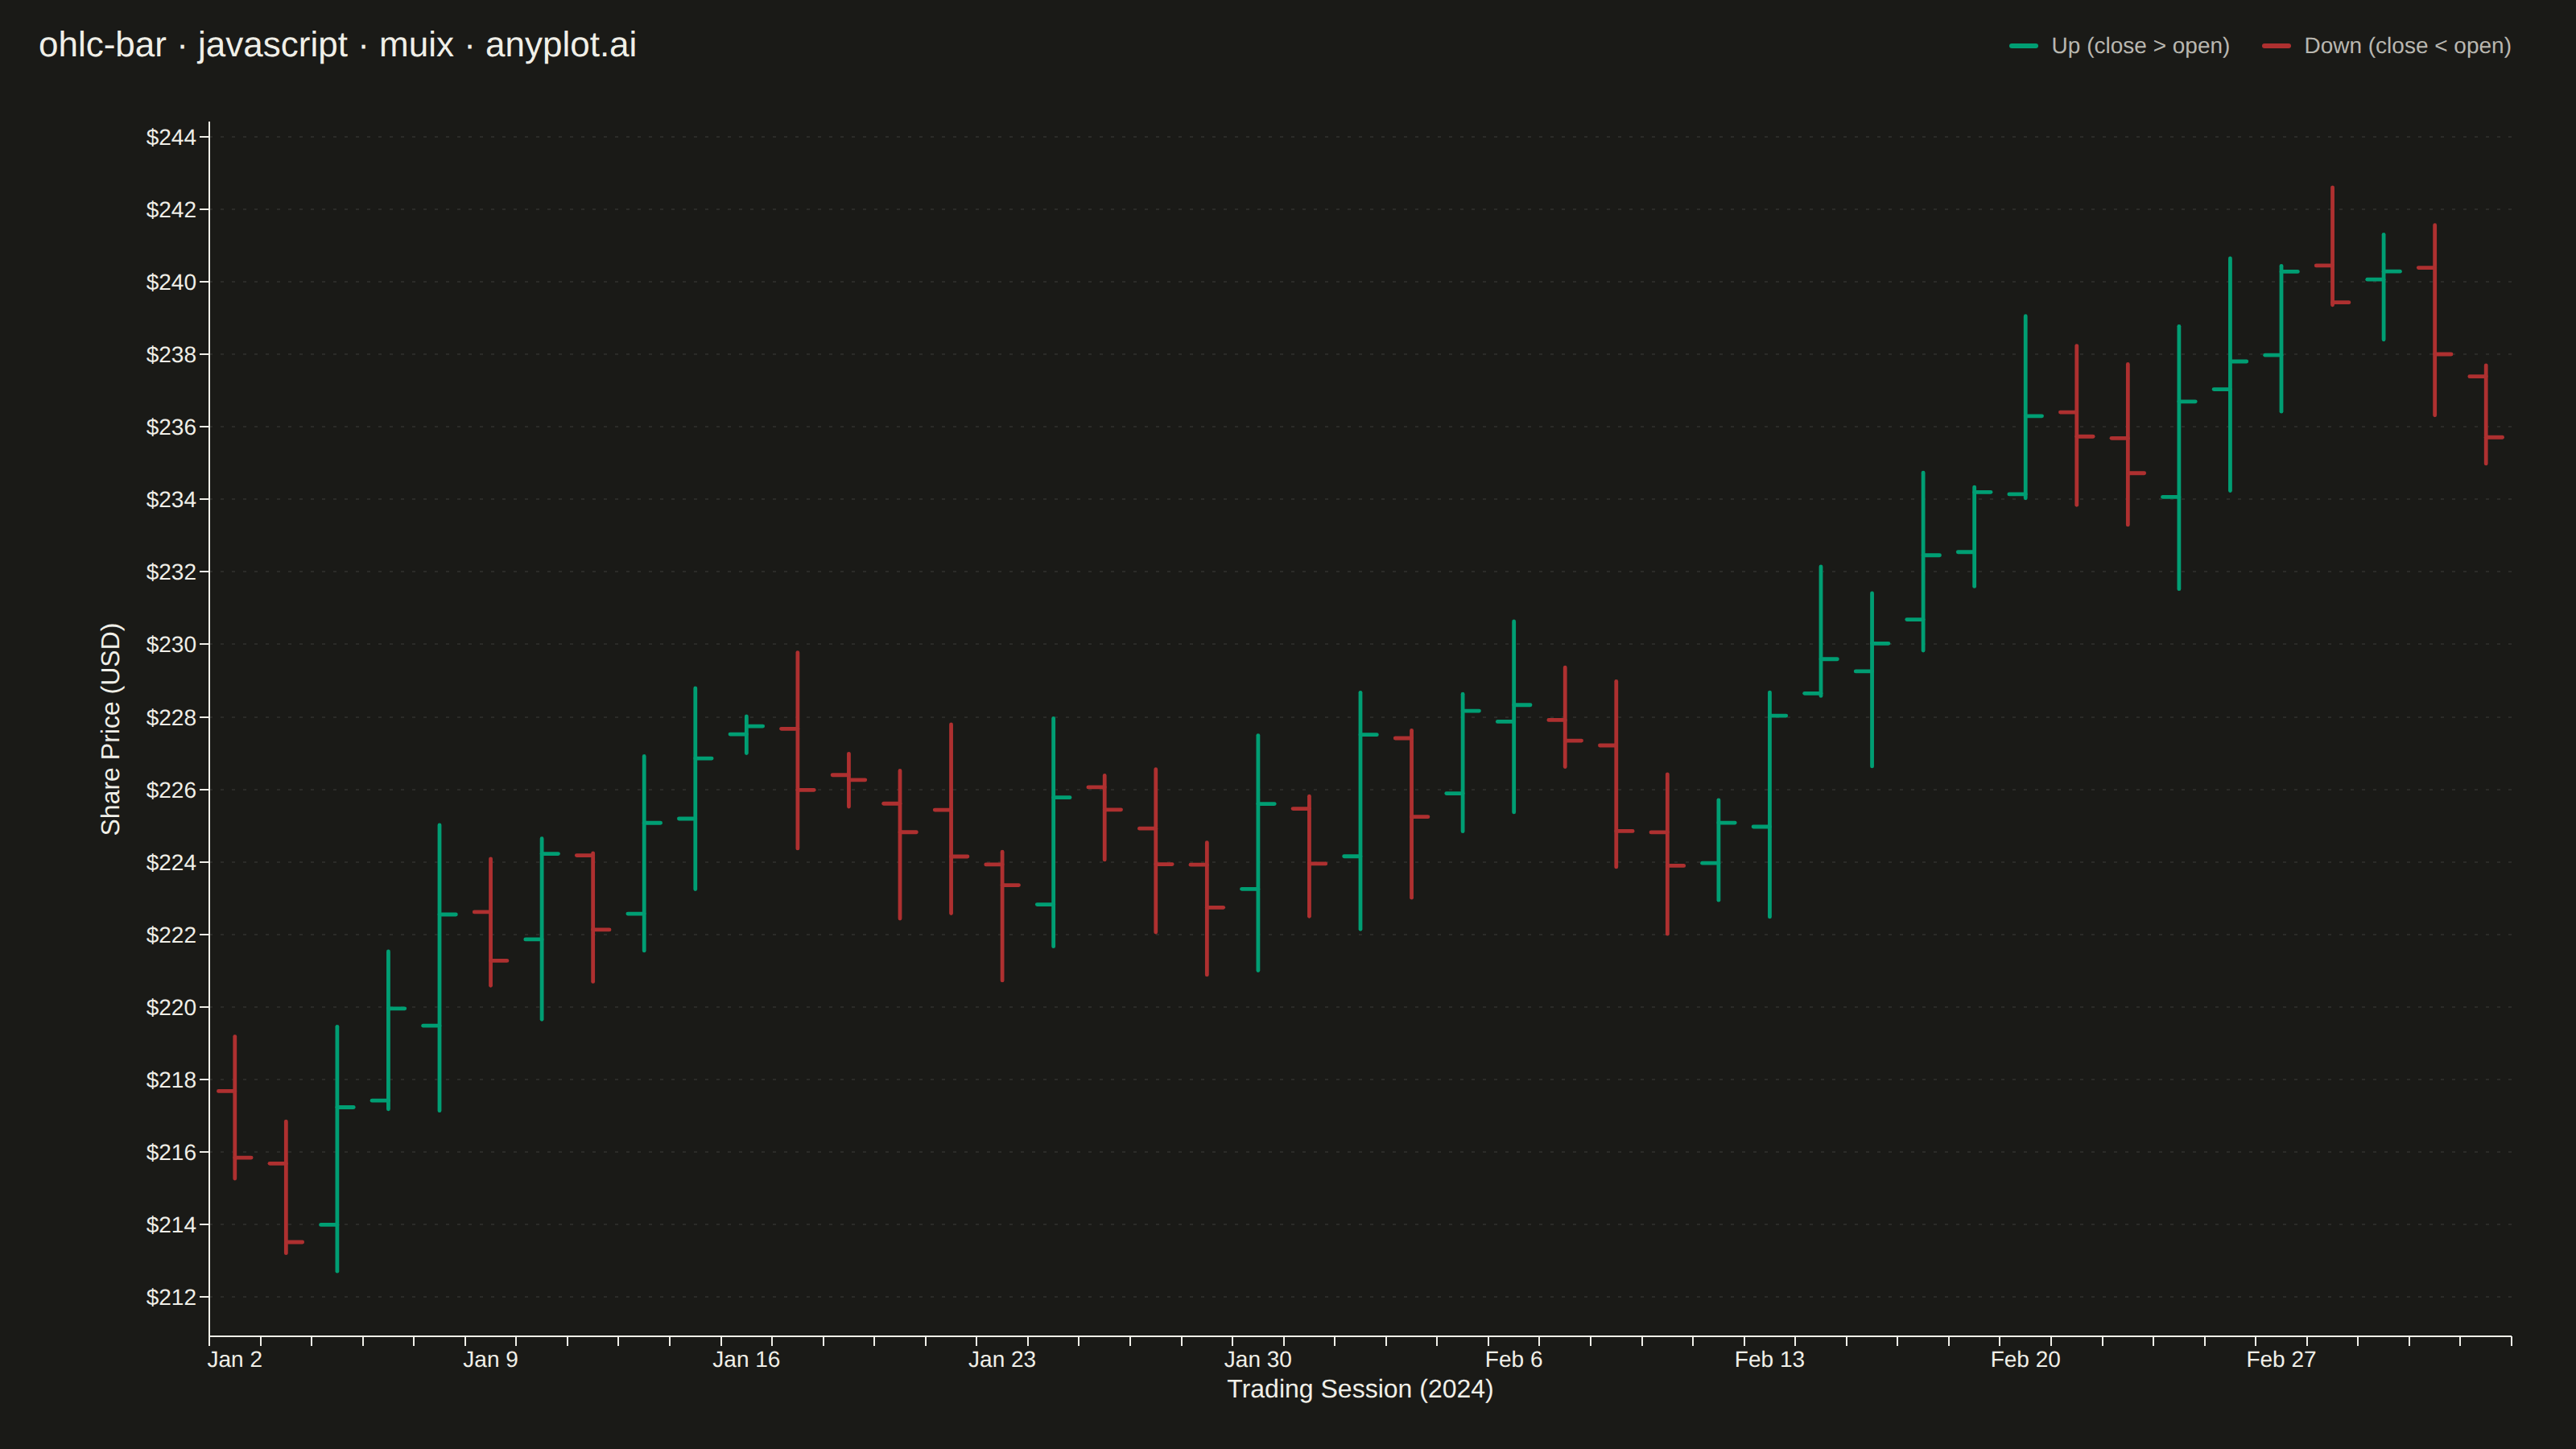
The same plot in 14 other libraries — JavaScript: Chart.js, D3.js, Apache ECharts, Highcharts; Python: Altair, Bokeh, lets-plot, Matplotlib, Plotly, plotnine, Pygal, Seaborn; R: ggplot2; Julia: Makie.jl. Compare all 15 side by side: OHLC Bar Chart in Python, R, Julia and JavaScript.
An OHLC (Open-High-Low-Close) bar chart displays financial price data using vertical bars with horizontal tick marks. Each bar shows the price range from high to low as a thin vertical line, with a left tick indicating the opening price and a right tick indicating the closing price. Unlike candlestick charts that use colored bodies, OHLC bars provide a cleaner, less cluttered view favored by technical analysts who prefer to focus on price levels rather than visual patterns.
// anyplot.ai
// ohlc-bar: OHLC Bar Chart
// Library: muix 7.29.1 | JavaScript 22.23.2
// Quality: 90/100 | Created: 2026-09-02
import { ChartContainer } from "@mui/x-charts/ChartContainer";
import { ChartsGrid } from "@mui/x-charts/ChartsGrid";
import { ChartsXAxis } from "@mui/x-charts/ChartsXAxis";
import { ChartsYAxis } from "@mui/x-charts/ChartsYAxis";
import { useXScale, useYScale } from "@mui/x-charts/hooks";

const t = window.ANYPLOT_TOKENS;
const TITLE = "ohlc-bar · javascript · muix · anyplot.ai";
const TITLE_HEIGHT = 56;

// --- Data (in-memory, deterministic LCG — no seeded RNG in the browser) -----
function lcg(seed) {
  let state = seed;
  return () => {
    state = (state * 1664525 + 1013904223) % 4294967296;
    return state / 4294967296;
  };
}

const PERIODS = 45;

// Trading-day dates only (skip Sat/Sun), starting the first Tuesday of 2024.
const dates = [];
const cursor = new Date(2024, 0, 2);
while (dates.length < PERIODS) {
  const dow = cursor.getDay();
  if (dow !== 0 && dow !== 6) {
    dates.push(cursor.toLocaleDateString("en-US", { month: "short", day: "numeric" }));
  }
  cursor.setDate(cursor.getDate() + 1);
}

// Daily OHLC via a mild-drift random walk, expressed as percentage moves so
// the wick/gap sizes scale naturally with price.
const rand = lcg(42);
const opens = [];
const highs = [];
const lows = [];
const closes = [];
let prevClose = 218;
for (let i = 0; i < PERIODS; i++) {
  const gapPct = (rand() - 0.5) * 0.006;
  const open = prevClose * (1 + gapPct);
  const movePct = (rand() - 0.47) * 0.026 + 0.0015;
  const close = open * (1 + movePct);
  const wickUpPct = rand() * 0.012;
  const wickDownPct = rand() * 0.012;
  const high = Math.max(open, close) * (1 + wickUpPct);
  const low = Math.min(open, close) * (1 - wickDownPct);
  opens.push(open);
  highs.push(high);
  lows.push(low);
  closes.push(close);
  prevClose = close;
}

const yMin = Math.min(...lows);
const yMax = Math.max(...highs);
const yPad = (yMax - yMin) * 0.06;

// --- OHLC bar overlay ---------------------------------------------------
// No candlestick/OHLC series ships in the community package (7.29.1) — a
// custom SVG layer positioned via the chart's own band/linear scale hooks
// reproduces it while staying entirely within the community ChartContainer
// surface, the same technique used for box-whisker overlays.
function OhlcBars() {
  const xScale = useXScale();
  const yScale = useYScale();
  const bandwidth = xScale.bandwidth();
  const tickWidth = Math.min(bandwidth * 0.4, 11);

  return (
    <g>
      {dates.map((date, i) => {
        const center = xScale(date) + bandwidth / 2;
        const isUp = closes[i] >= opens[i];
        const color = isUp ? t.palette[0] : t.palette[4];

        return (
          <g key={date} stroke={color} strokeWidth={2.4} strokeLinecap="round">
            <line
              x1={center}
              x2={center}
              y1={yScale(highs[i])}
              y2={yScale(lows[i])}
            />
            <line
              x1={center - tickWidth}
              x2={center}
              y1={yScale(opens[i])}
              y2={yScale(opens[i])}
            />
            <line
              x1={center}
              x2={center + tickWidth}
              y1={yScale(closes[i])}
              y2={yScale(closes[i])}
            />
          </g>
        );
      })}
    </g>
  );
}

function LegendSwatch({ color, label }) {
  return (
    <div style={{ display: "flex", alignItems: "center", gap: 8 }}>
      <span
        style={{
          width: 18,
          height: 3,
          borderRadius: 2,
          backgroundColor: color,
        }}
      />
      <span style={{ fontSize: 14, color: t.inkSoft }}>{label}</span>
    </div>
  );
}

export default function Chart() {
  const chartHeight = window.ANYPLOT_SIZE.height - TITLE_HEIGHT;

  return (
    <div
      style={{
        width: window.ANYPLOT_SIZE.width,
        height: window.ANYPLOT_SIZE.height,
      }}
    >
      <div
        style={{
          height: TITLE_HEIGHT,
          display: "flex",
          alignItems: "center",
          justifyContent: "space-between",
          paddingLeft: 24,
          paddingRight: 40,
        }}
      >
        <span style={{ fontSize: 22, fontWeight: 500, color: t.ink }}>
          {TITLE}
        </span>
        <div style={{ display: "flex", alignItems: "center", gap: 20 }}>
          <LegendSwatch color={t.palette[0]} label="Up (close > open)" />
          <LegendSwatch color={t.palette[4]} label="Down (close < open)" />
        </div>
      </div>
      <ChartContainer
        width={window.ANYPLOT_SIZE.width}
        height={chartHeight}
        series={[]}
        skipAnimation
        margin={{ top: 20, right: 40, bottom: 70, left: 130 }}
        xAxis={[
          {
            id: "sessions",
            data: dates,
            scaleType: "band",
            label: "Trading Session (2024)",
            labelStyle: { fontSize: 16 },
            tickLabelStyle: { fontSize: 14 },
            tickLabelInterval: (_value, index) => index % 5 === 0,
          },
        ]}
        yAxis={[
          {
            id: "price",
            min: yMin - yPad,
            max: yMax + yPad,
            label: "Share Price (USD)",
            labelStyle: { fontSize: 16 },
            // tickFontSize drives the label's reserved offset from the axis
            // (MUI X spaces the rotated label by tickFontSize + tickSize, not
            // by the actual rendered tick text width) — set generously so the
            // "$XXX" ticks (rendered at tickLabelStyle's 14px) never collide
            // with the axis label.
            tickFontSize: 40,
            tickLabelStyle: { fontSize: 14 },
            valueFormatter: (v) => `$${v.toFixed(0)}`,
          },
        ]}
      >
        <ChartsGrid
          horizontal
          sx={{
            "& .MuiChartsGrid-line": {
              opacity: 0.55,
              strokeDasharray: "2 5",
            },
          }}
        />
        <OhlcBars />
        <ChartsXAxis axisId="sessions" />
        <ChartsYAxis axisId="price" />
      </ChartContainer>
    </div>
  );
}
Runnable source as JSON, for any HTTP client: https://api.anyplot.ai/specs/ohlc-bar/muix/code. Any spec id and library id listed in llms-full.txt fit the same URL shape; every URL below is complete and callable.
{
  "spec_id": "ohlc-bar",
  "language": "javascript",
  "library": "muix",
  "page": "https://anyplot.ai/ohlc-bar/javascript/muix",
  "hub": "https://anyplot.ai/ohlc-bar",
  "code_json": "https://api.anyplot.ai/specs/ohlc-bar/muix/code",
  "spec_json": "https://api.anyplot.ai/specs/ohlc-bar",
  "render_light_png": "https://storage.googleapis.com/anyplot-images/plots/ohlc-bar/javascript/muix/plot-light.png",
  "render_dark_png": "https://storage.googleapis.com/anyplot-images/plots/ohlc-bar/javascript/muix/plot-dark.png",
  "interactive_light_html": "https://storage.googleapis.com/anyplot-images/plots/ohlc-bar/javascript/muix/plot-light.html",
  "interactive_dark_html": "https://storage.googleapis.com/anyplot-images/plots/ohlc-bar/javascript/muix/plot-dark.html",
  "quality_score": 90.0,
  "license": "MIT",
  "guide": "https://anyplot.ai/llms.txt"
}
Part of OHLC Bar Chart on anyplot.ai.