The same plot in 14 other libraries — JavaScript: Chart.js, D3.js, Highcharts, MUI X Charts; Python: Altair, Bokeh, lets-plot, Matplotlib, Plotly, plotnine, Pygal, Seaborn; R: ggplot2; Julia: Makie.jl. Compare all 15 side by side: OHLC Bar Chart in Python, R, Julia and JavaScript.
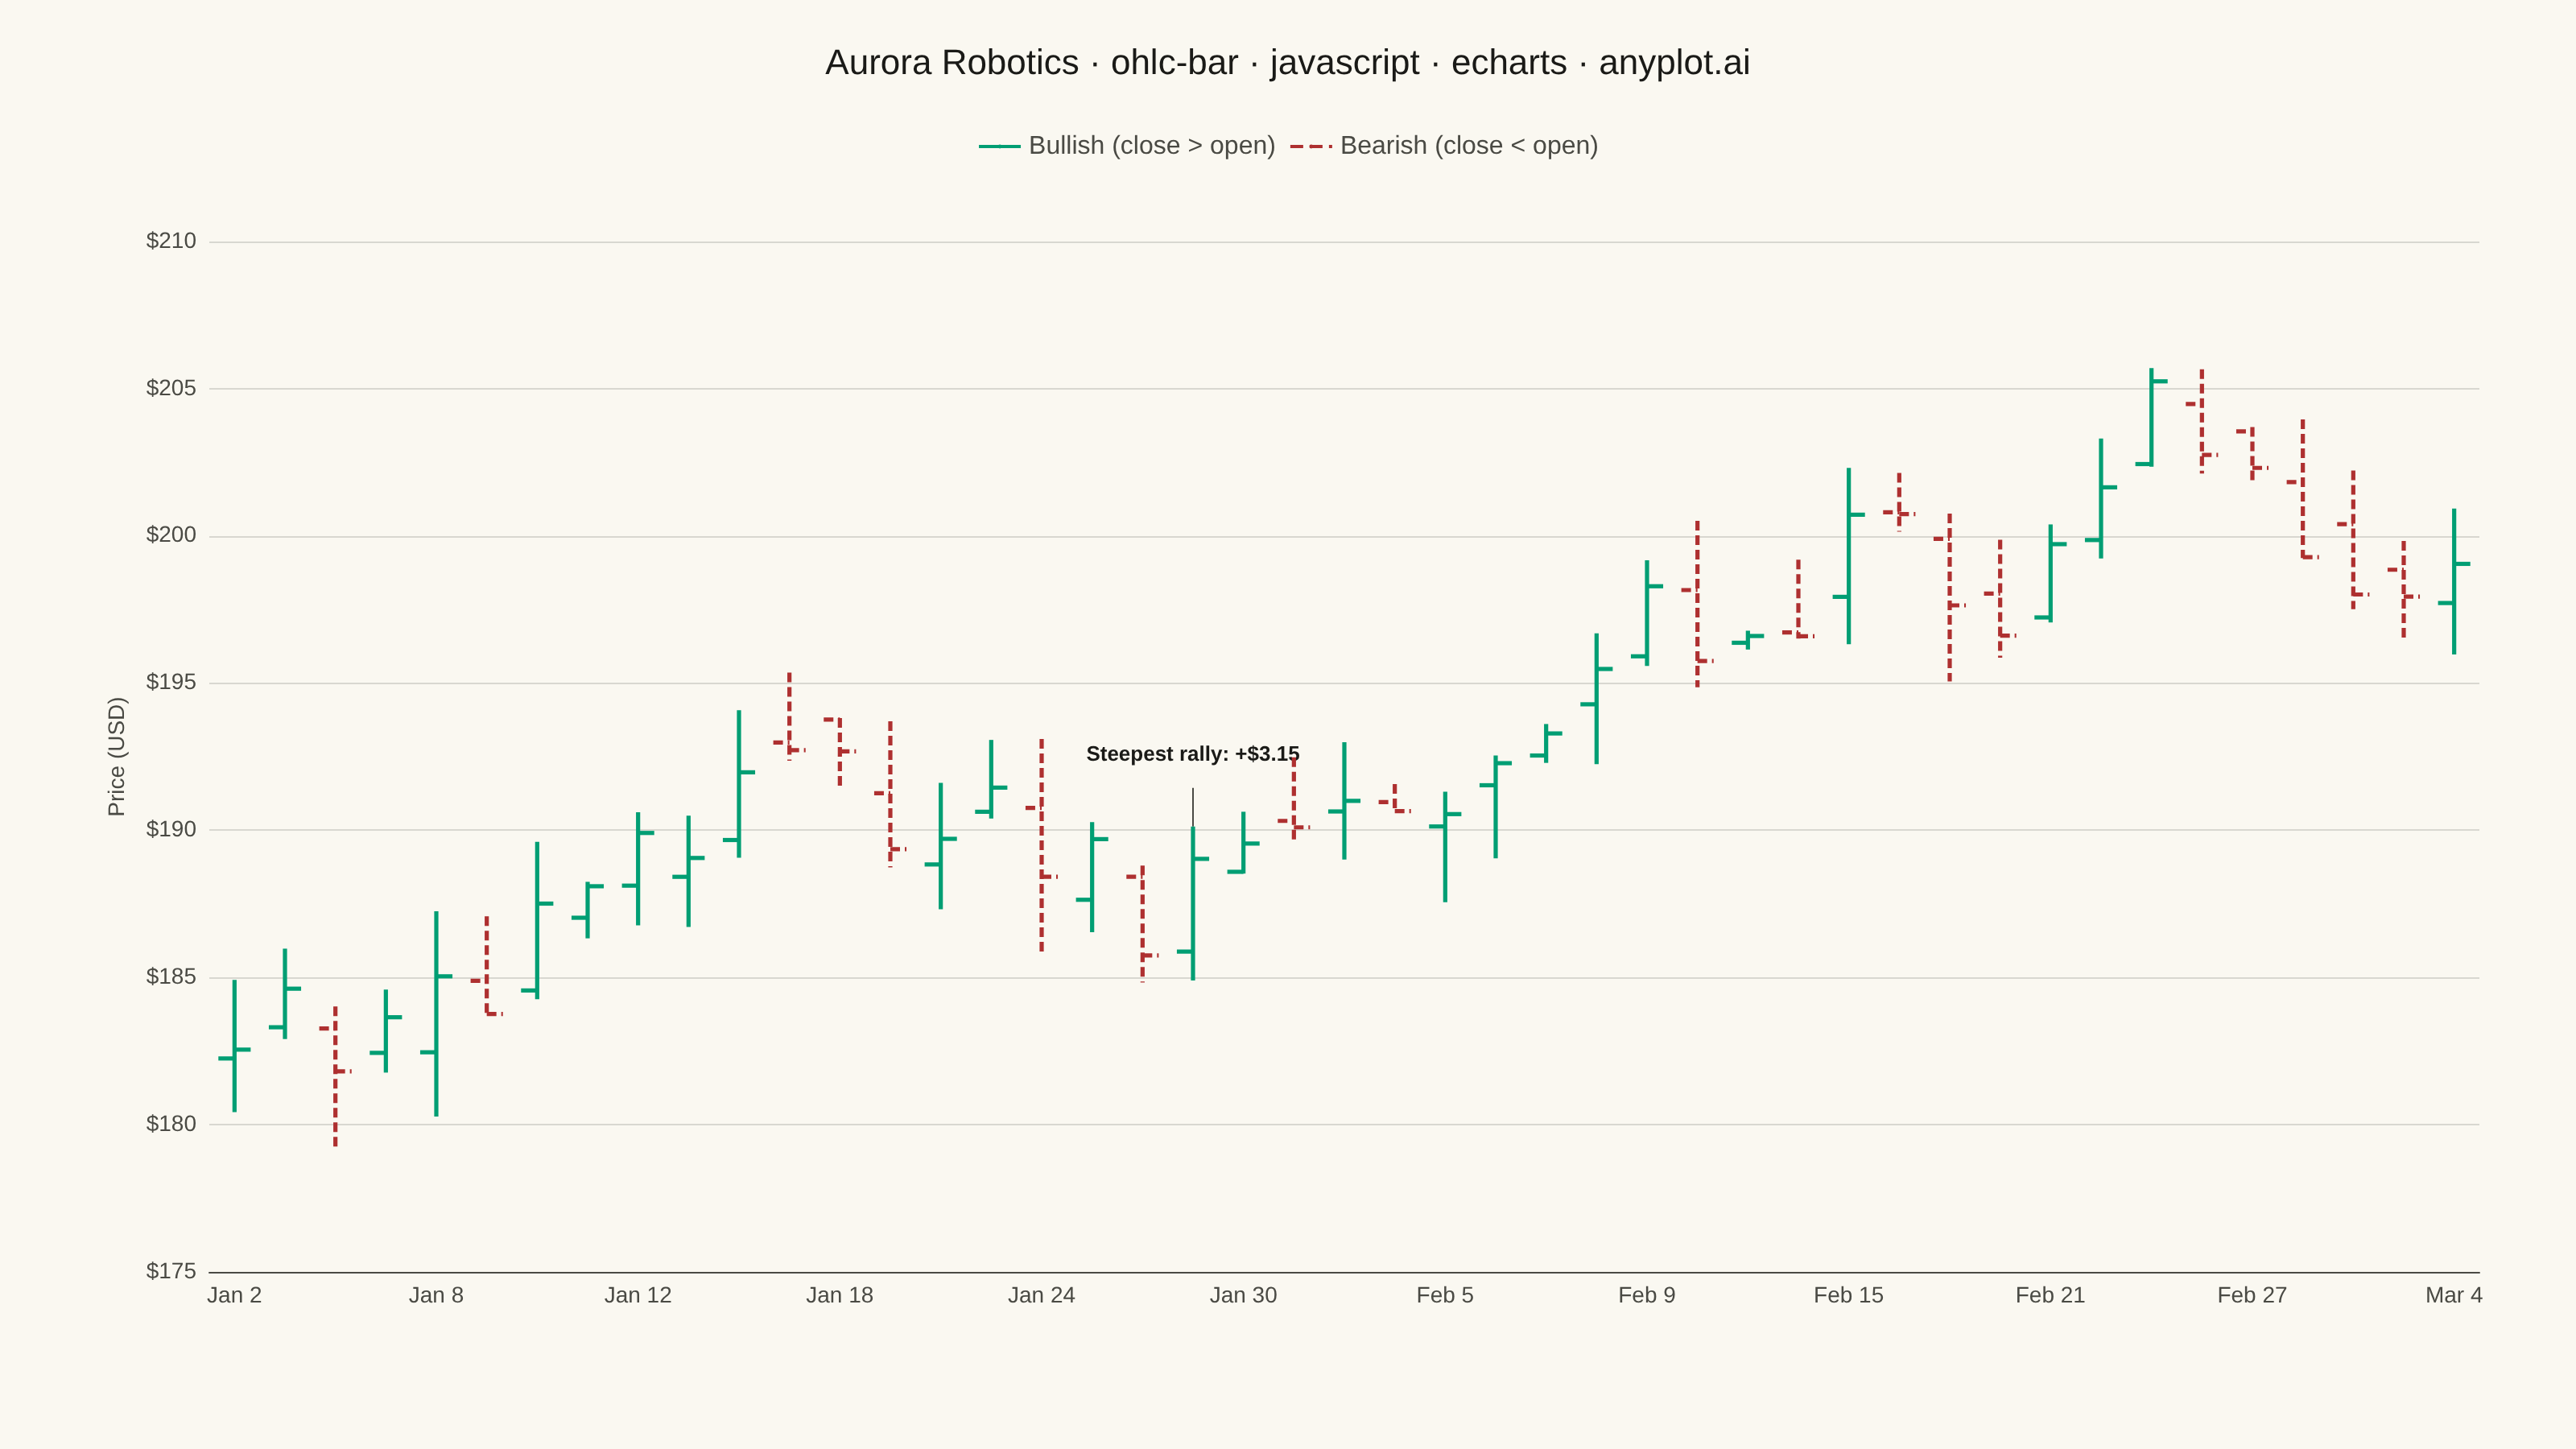
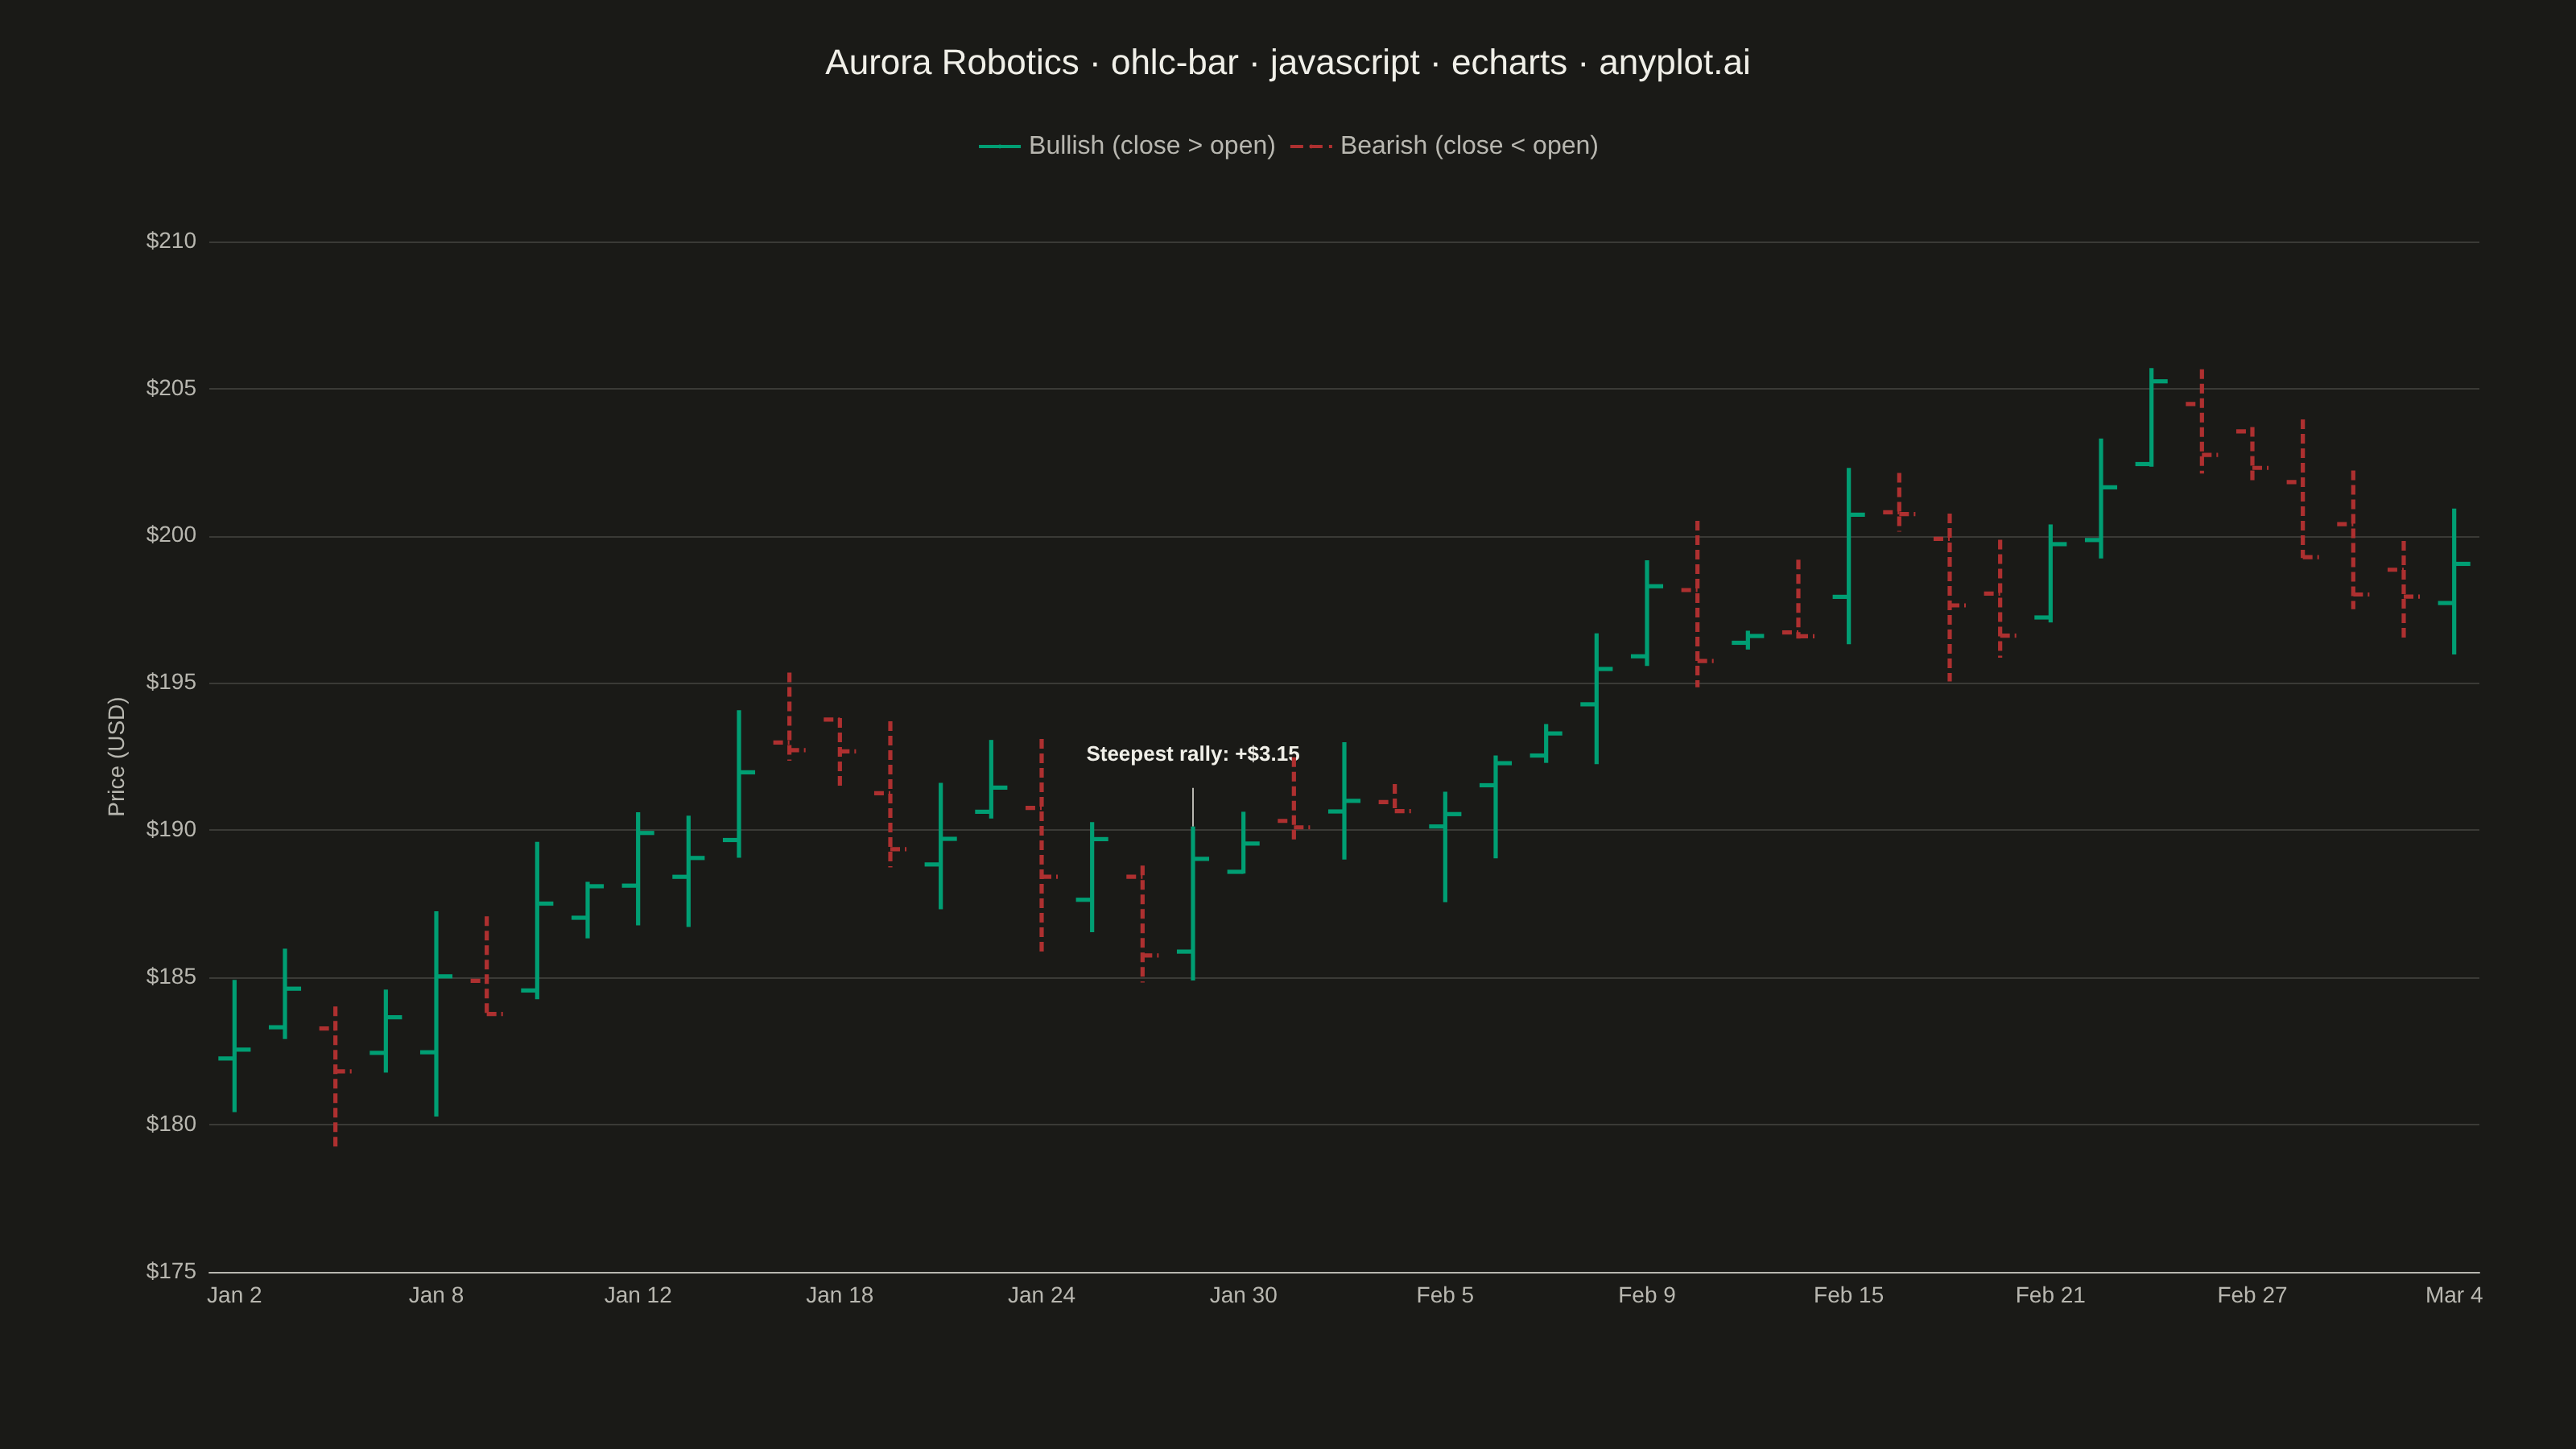
An OHLC (Open-High-Low-Close) bar chart displays financial price data using vertical bars with horizontal tick marks. Each bar shows the price range from high to low as a thin vertical line, with a left tick indicating the opening price and a right tick indicating the closing price. Unlike candlestick charts that use colored bodies, OHLC bars provide a cleaner, less cluttered view favored by technical analysts who prefer to focus on price levels rather than visual patterns.
// anyplot.ai
// ohlc-bar: OHLC Bar Chart
// Library: echarts 6.1.0 | JavaScript 22.23.2
// Quality: 93/100 | Created: 2026-09-02

const t = window.ANYPLOT_TOKENS;
const UP_COLOR = t.palette[0]; // #009E73 brand green — profit/up semantic
const DOWN_COLOR = t.palette[4]; // #AE3030 matte red — loss/down semantic

// --- Data: 45 trading days of a fictional stock's OHLC prices --------------
const MONTHS = ["Jan", "Feb", "Mar", "Apr", "May", "Jun"];
const NUM_DAYS = 45;

function seededRandom(seed) {
  let s = seed;
  return function () {
    s = (s * 1103515245 + 12345) & 0x7fffffff;
    return s / 0x7fffffff;
  };
}
const rand = seededRandom(42);

const dateLabels = [];
const cursor = new Date(2024, 0, 2); // Tue Jan 2 2024
while (dateLabels.length < NUM_DAYS) {
  const weekday = cursor.getDay();
  if (weekday !== 0 && weekday !== 6) {
    dateLabels.push(`${MONTHS[cursor.getMonth()]} ${cursor.getDate()}`);
  }
  cursor.setDate(cursor.getDate() + 1);
}

const ohlcRows = [];
let lastClose = 182;
for (let i = 0; i < NUM_DAYS; i++) {
  const open = lastClose + (rand() - 0.5) * 3;
  const drift = (rand() - 0.47) * 6; // slight upward drift over the period
  const close = open + drift;
  const high = Math.max(open, close) + rand() * 2.6;
  const low = Math.min(open, close) - rand() * 2.6;
  ohlcRows.push([i, +open.toFixed(2), +high.toFixed(2), +low.toFixed(2), +close.toFixed(2)]);
  lastClose = close;
}

// --- Find the steepest single-day move for the storytelling callout --------
let extremeIndex = 0;
let extremeMove = ohlcRows[0][4] - ohlcRows[0][1];
for (const [xIndex, open, , , close] of ohlcRows) {
  const move = close - open;
  if (Math.abs(move) > Math.abs(extremeMove)) {
    extremeMove = move;
    extremeIndex = xIndex;
  }
}

// --- Custom render: I-beam OHLC bars ----------------------------------------
// Bearish bars use a dashed stroke in addition to red, so the up/down signal
// survives for red-green color-vision-deficient viewers, not just via hue.
function renderOhlcBar(params, api) {
  const xIndex = api.value(0);
  const openPoint = api.coord([xIndex, api.value(1)]);
  const highPoint = api.coord([xIndex, api.value(2)]);
  const lowPoint = api.coord([xIndex, api.value(3)]);
  const closePoint = api.coord([xIndex, api.value(4)]);
  const tickLength = api.size([1, 0])[0] * 0.32;
  const isUp = api.value(4) >= api.value(1);
  const lineStyle = isUp
    ? { stroke: UP_COLOR, lineWidth: 2.6 }
    : { stroke: DOWN_COLOR, lineWidth: 2.6, lineDash: [6, 3] };

  return {
    type: "group",
    children: [
      {
        type: "line",
        shape: { x1: highPoint[0], y1: highPoint[1], x2: lowPoint[0], y2: lowPoint[1] },
        style: lineStyle,
      },
      {
        type: "line",
        shape: { x1: openPoint[0] - tickLength, y1: openPoint[1], x2: openPoint[0], y2: openPoint[1] },
        style: lineStyle,
      },
      {
        type: "line",
        shape: { x1: closePoint[0], y1: closePoint[1], x2: closePoint[0] + tickLength, y2: closePoint[1] },
        style: lineStyle,
      },
    ],
  };
}

// --- Init + option -----------------------------------------------------------
const chart = echarts.init(document.getElementById("container"));

chart.setOption({
  animation: false,
  backgroundColor: "transparent",
  title: {
    text: "Aurora Robotics · ohlc-bar · javascript · echarts · anyplot.ai",
    left: "center",
    top: 24,
    textStyle: { color: t.ink, fontSize: 22, fontWeight: 500 },
  },
  legend: {
    data: ["Bullish (close > open)", "Bearish (close < open)"],
    top: 78,
    textStyle: { color: t.inkSoft, fontSize: 16 },
    itemWidth: 26,
    itemHeight: 3,
  },
  grid: { left: 130, right: 60, top: 150, bottom: 110 },
  xAxis: {
    type: "category",
    data: dateLabels,
    boundaryGap: true,
    axisLabel: { color: t.inkSoft, fontSize: 14, interval: 3 },
    axisLine: { lineStyle: { color: t.inkSoft } },
    axisTick: { show: false },
    splitLine: { show: false },
  },
  yAxis: {
    type: "value",
    scale: true,
    name: "Price (USD)",
    nameLocation: "middle",
    nameGap: 44,
    nameRotate: 90,
    nameTextStyle: { color: t.inkSoft, fontSize: 14 },
    axisLabel: { color: t.inkSoft, fontSize: 14, formatter: (v) => `$${v}` },
    axisLine: { show: false },
    splitLine: { lineStyle: { color: t.grid } },
  },
  series: [
    {
      name: "Bullish (close > open)",
      type: "line",
      data: [],
      symbol: "none",
      itemStyle: { color: UP_COLOR },
      lineStyle: { color: UP_COLOR, width: 2.6 },
    },
    {
      name: "Bearish (close < open)",
      type: "line",
      data: [],
      symbol: "none",
      itemStyle: { color: DOWN_COLOR },
      lineStyle: { color: DOWN_COLOR, width: 2.6, type: "dashed" },
    },
    {
      name: "OHLC",
      type: "custom",
      renderItem: renderOhlcBar,
      encode: { x: 0, y: [1, 2, 3, 4] },
      data: ohlcRows,
    },
  ],
});

// --- Storytelling callout: annotate the steepest single-day move -----------
const extremeRow = ohlcRows[extremeIndex];
const anchorPrice = extremeMove >= 0 ? extremeRow[2] : extremeRow[3]; // high : low
const anchorPixel = chart.convertToPixel({ xAxisIndex: 0, yAxisIndex: 0 }, [
  dateLabels[extremeIndex],
  anchorPrice,
]);
const calloutLabel =
  extremeMove >= 0
    ? `Steepest rally: +$${extremeMove.toFixed(2)}`
    : `Steepest drawdown: -$${Math.abs(extremeMove).toFixed(2)}`;
const labelOffset = extremeMove >= 0 ? -38 : 38;
const labelY = anchorPixel[1] + labelOffset;

chart.setOption({
  graphic: {
    elements: [
      {
        type: "group",
        children: [
          {
            type: "line",
            shape: {
              x1: anchorPixel[0],
              y1: anchorPixel[1],
              x2: anchorPixel[0],
              y2: labelY + (extremeMove >= 0 ? 14 : -14),
            },
            style: { stroke: t.inkSoft, lineWidth: 1 },
          },
          {
            type: "text",
            x: anchorPixel[0],
            y: labelY,
            style: {
              text: calloutLabel,
              fill: t.ink,
              font: "600 13px sans-serif",
              textAlign: "center",
              textVerticalAlign: extremeMove >= 0 ? "bottom" : "top",
            },
          },
        ],
      },
    ],
  },
});
Runnable source as JSON, for any HTTP client: https://api.anyplot.ai/specs/ohlc-bar/echarts/code. Any spec id and library id listed in llms-full.txt fit the same URL shape; every URL below is complete and callable.
{
  "spec_id": "ohlc-bar",
  "language": "javascript",
  "library": "echarts",
  "page": "https://anyplot.ai/ohlc-bar/javascript/echarts",
  "hub": "https://anyplot.ai/ohlc-bar",
  "code_json": "https://api.anyplot.ai/specs/ohlc-bar/echarts/code",
  "spec_json": "https://api.anyplot.ai/specs/ohlc-bar",
  "render_light_png": "https://storage.googleapis.com/anyplot-images/plots/ohlc-bar/javascript/echarts/plot-light.png",
  "render_dark_png": "https://storage.googleapis.com/anyplot-images/plots/ohlc-bar/javascript/echarts/plot-dark.png",
  "interactive_light_html": "https://storage.googleapis.com/anyplot-images/plots/ohlc-bar/javascript/echarts/plot-light.html",
  "interactive_dark_html": "https://storage.googleapis.com/anyplot-images/plots/ohlc-bar/javascript/echarts/plot-dark.html",
  "quality_score": 93.0,
  "license": "MIT",
  "guide": "https://anyplot.ai/llms.txt"
}
Part of OHLC Bar Chart on anyplot.ai.