The same plot in 14 other libraries — JavaScript: D3.js, Apache ECharts, Highcharts, MUI X Charts; Python: Altair, Bokeh, lets-plot, Matplotlib, Plotly, plotnine, Pygal, Seaborn; R: ggplot2; Julia: Makie.jl. Compare all 15 side by side: OHLC Bar Chart in Python, R, Julia and JavaScript.
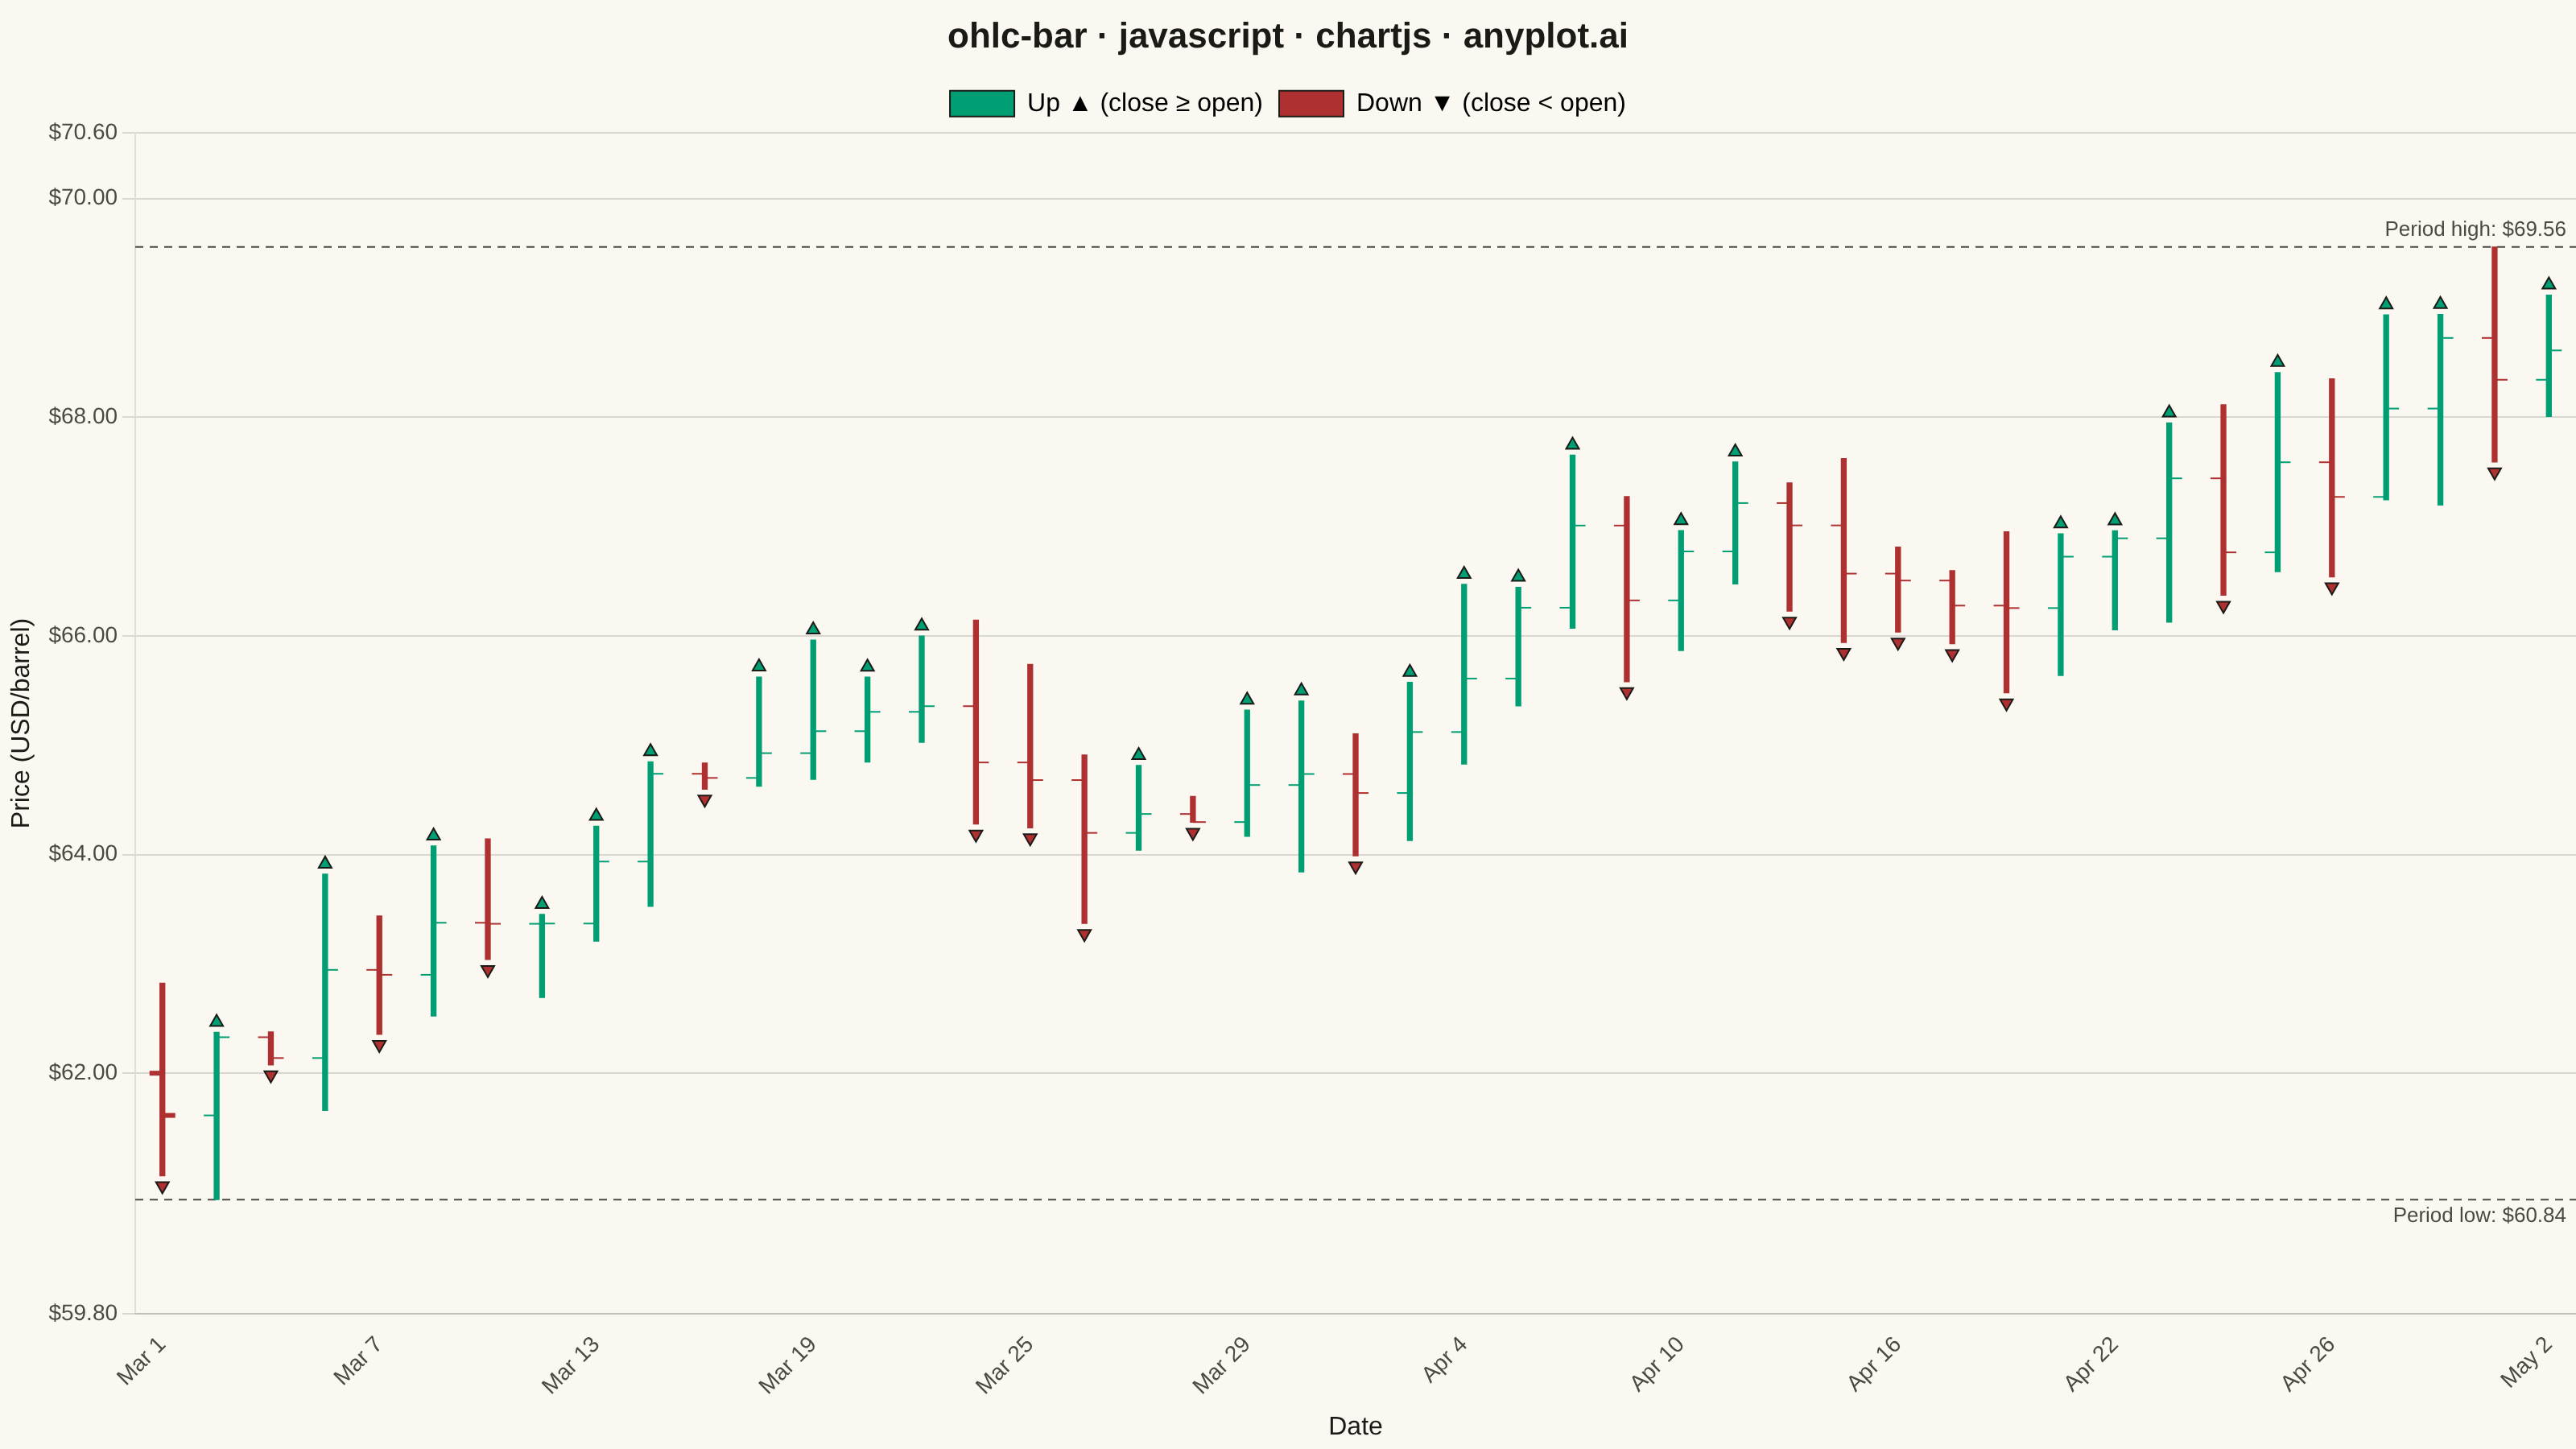
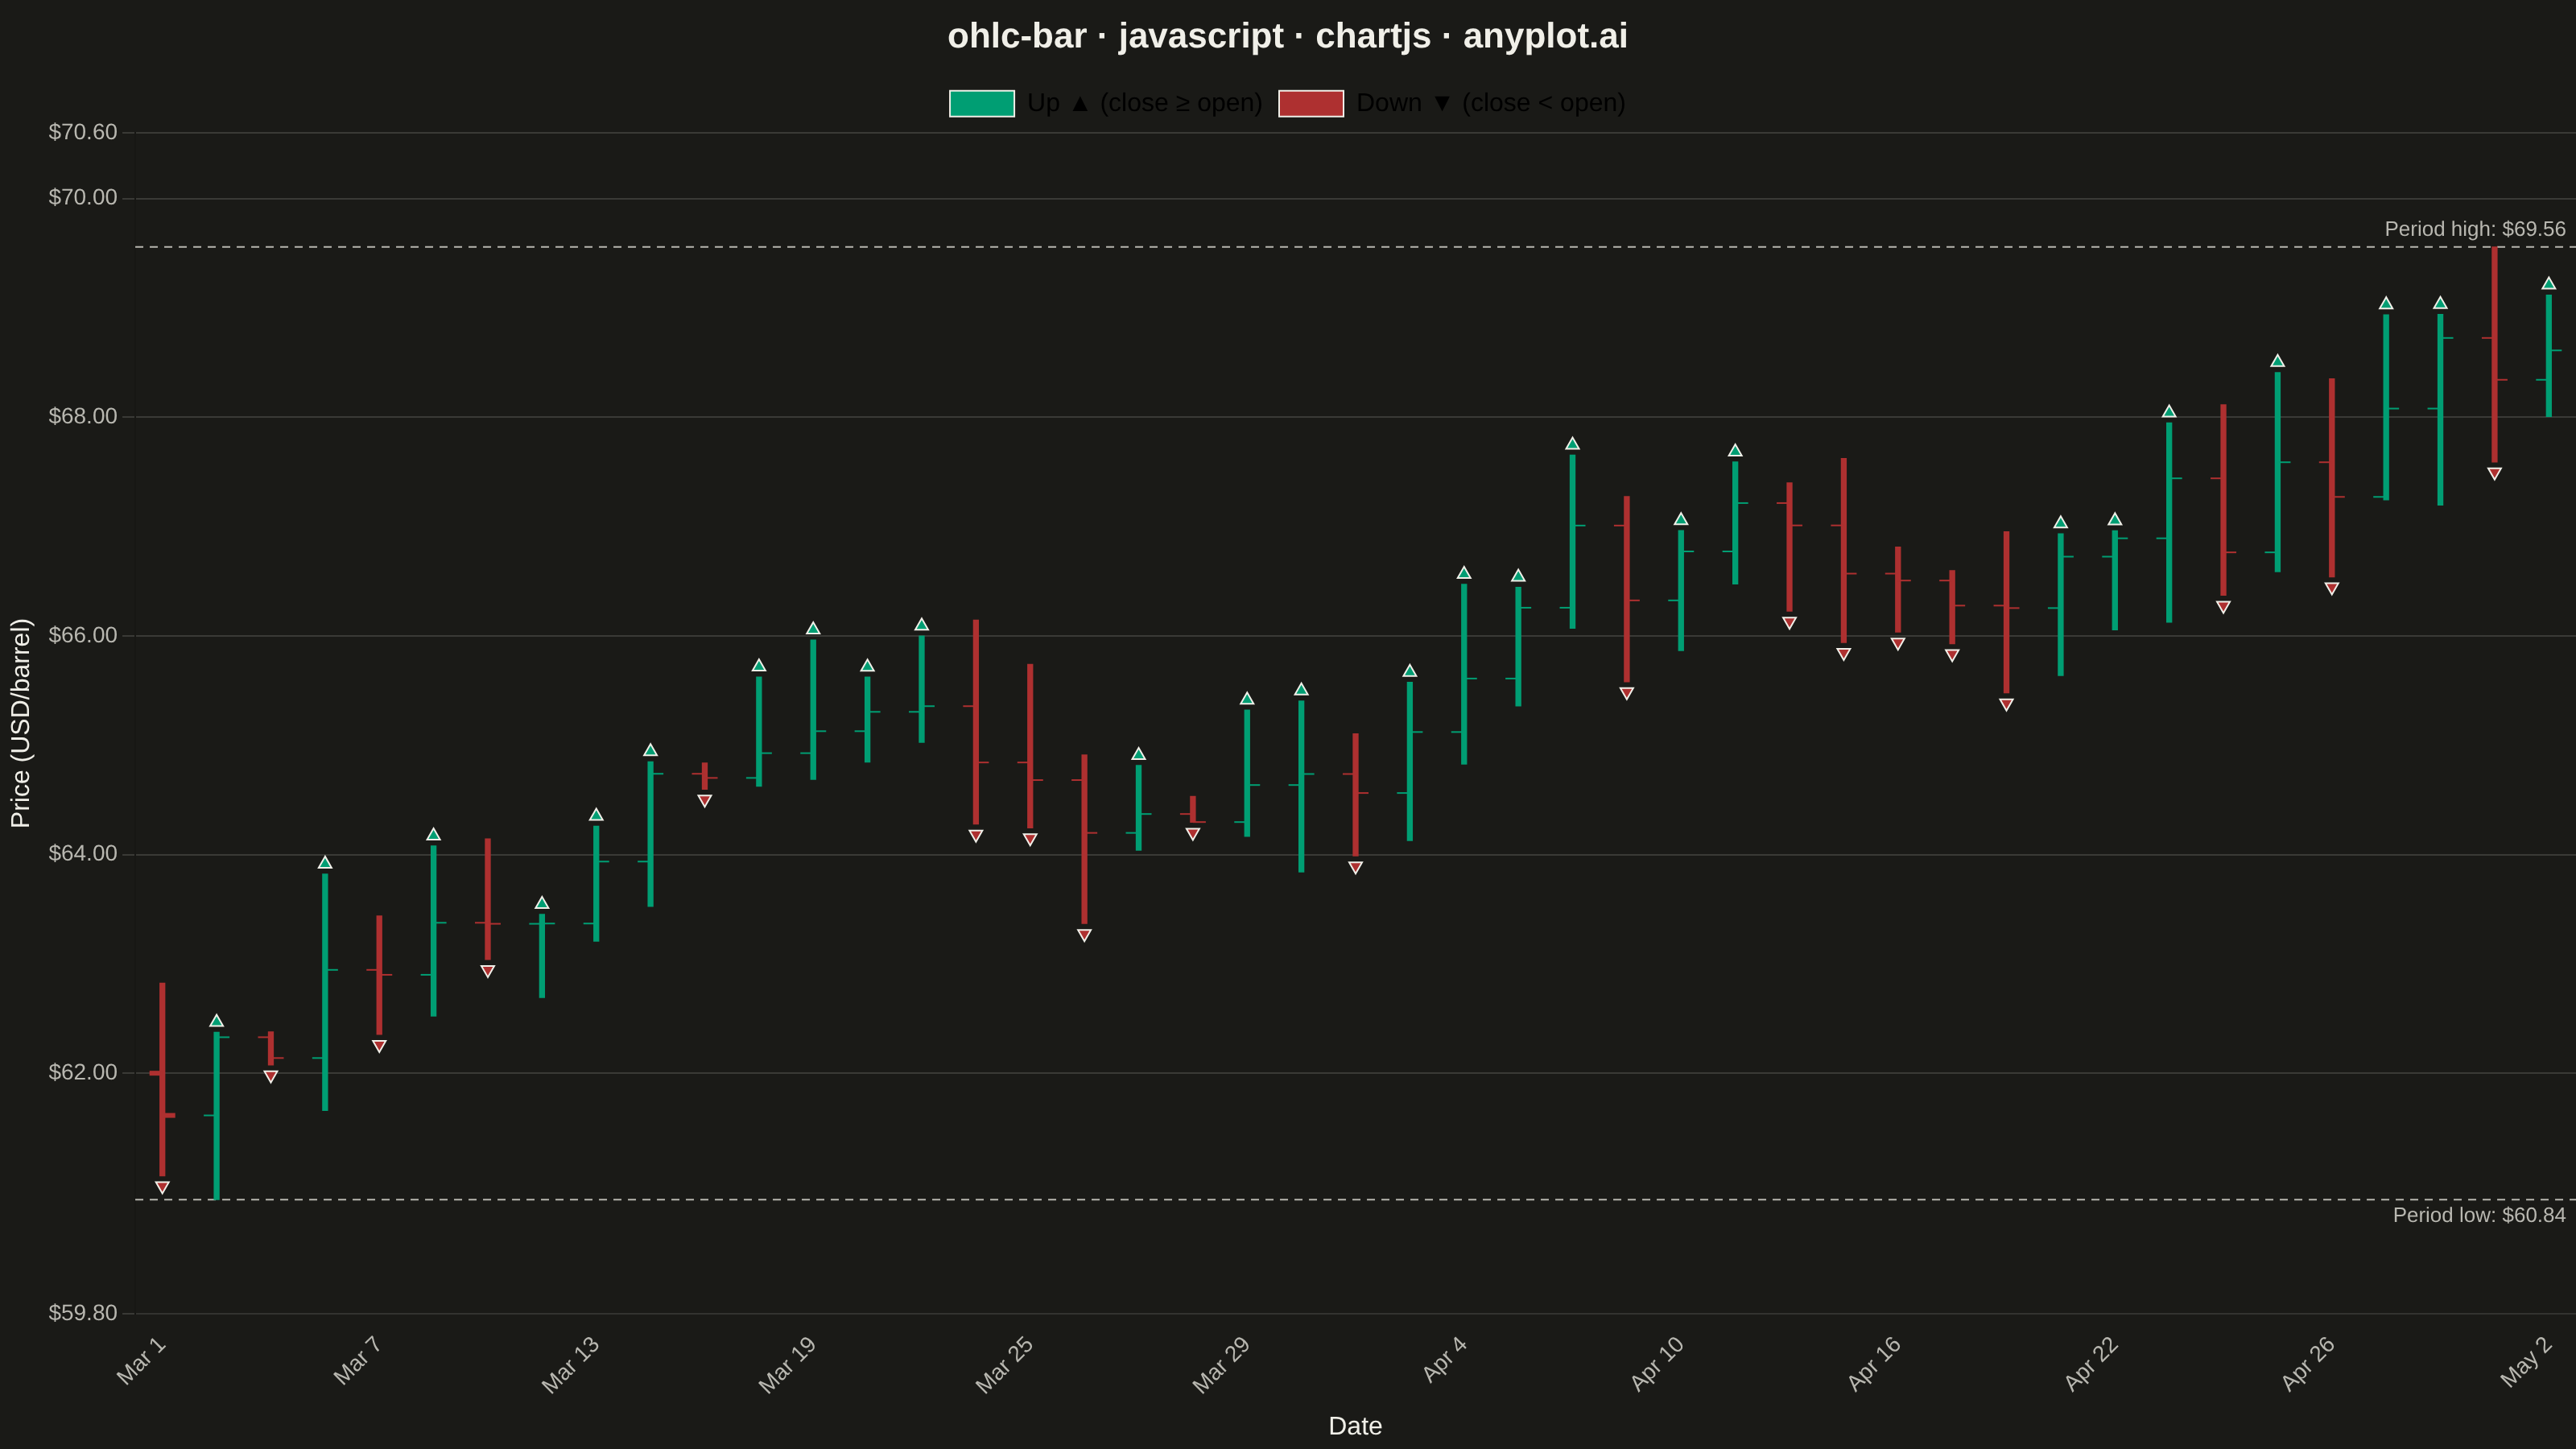
An OHLC (Open-High-Low-Close) bar chart displays financial price data using vertical bars with horizontal tick marks. Each bar shows the price range from high to low as a thin vertical line, with a left tick indicating the opening price and a right tick indicating the closing price. Unlike candlestick charts that use colored bodies, OHLC bars provide a cleaner, less cluttered view favored by technical analysts who prefer to focus on price levels rather than visual patterns.
// anyplot.ai
// ohlc-bar: OHLC Bar Chart
// Library: chartjs 4.4.7 | JavaScript 22.23.2
// Quality: 91/100 | Created: 2026-09-02

const t = window.ANYPLOT_TOKENS;

// --- Data (in-memory, deterministic) ----------------------------------------
// Tiny fixed-seed LCG — the browser has no seeded RNG.
function lcg(seed) {
  let state = seed;
  return () => {
    state = (state * 1664525 + 1013904223) % 4294967296;
    return state / 4294967296;
  };
}
const rand = lcg(7);

const sessionCount = 45;
const labels = [];
const opens = [];
const highs = [];
const lows = [];
const closes = [];
const barColors = [];

let price = 62; // crude oil futures, USD per barrel
const date = new Date(Date.UTC(2024, 2, 1));
for (let i = 0; i < sessionCount; i++) {
  while (date.getUTCDay() === 0 || date.getUTCDay() === 6) {
    date.setUTCDate(date.getUTCDate() + 1);
  }

  const open = price;
  const drift = (rand() - 0.48) * 1.6;
  const close = Math.max(open + drift, 1);
  const high = Math.max(open, close) + rand() * 0.9;
  const low = Math.min(open, close) - rand() * 0.9;
  const isUp = close >= open;

  labels.push(date.toLocaleDateString("en-US", { month: "short", day: "numeric" }));
  opens.push(open);
  highs.push(high);
  lows.push(low);
  closes.push(close);
  barColors.push(isUp ? t.palette[0] : t.palette[4]);

  price = close;
  date.setUTCDate(date.getUTCDate() + 1);
}

const priceMin = Math.min(...lows);
const priceMax = Math.max(...highs);
const pricePad = (priceMax - priceMin) * 0.12;

// --- Mount -------------------------------------------------------------------
const canvas = document.createElement("canvas");
document.getElementById("container").appendChild(canvas);

// --- Open/close tick + storytelling plugin -------------------------------------
// Draws the left (open) and right (close) horizontal ticks per bar, a small
// direction glyph (redundant to color, for CVD readers), and dashed period
// high/low reference lines — all directly on the canvas via core Chart.js
// plugin hooks. No external financial plugin.
const tickHalfWidth = 8;
const ohlcTicksPlugin = {
  id: "ohlcTicks",
  beforeDatasetsDraw(chart) {
    const { ctx, chartArea, scales } = chart;
    const highY = scales.y.getPixelForValue(priceMax);
    const lowY = scales.y.getPixelForValue(priceMin);

    ctx.save();
    ctx.lineWidth = 1;
    ctx.strokeStyle = t.inkSoft;
    ctx.setLineDash([5, 4]);
    ctx.beginPath();
    ctx.moveTo(chartArea.left, highY);
    ctx.lineTo(chartArea.right, highY);
    ctx.stroke();
    ctx.beginPath();
    ctx.moveTo(chartArea.left, lowY);
    ctx.lineTo(chartArea.right, lowY);
    ctx.stroke();
    ctx.setLineDash([]);

    ctx.fillStyle = t.inkSoft;
    ctx.font = "13px sans-serif";
    ctx.textAlign = "right";
    ctx.textBaseline = "bottom";
    ctx.fillText(`Period high: $${priceMax.toFixed(2)}`, chartArea.right - 6, highY - 4);
    ctx.textBaseline = "top";
    ctx.fillText(`Period low: $${priceMin.toFixed(2)}`, chartArea.right - 6, lowY + 4);
    ctx.restore();
  },
  afterDatasetsDraw(chart) {
    const { ctx, scales } = chart;
    ctx.save();
    ctx.lineWidth = 3;
    for (let i = 0; i < sessionCount; i++) {
      const x = scales.x.getPixelForValue(i);
      const openY = scales.y.getPixelForValue(opens[i]);
      const closeY = scales.y.getPixelForValue(closes[i]);
      const highY = scales.y.getPixelForValue(highs[i]);
      const lowY = scales.y.getPixelForValue(lows[i]);
      const isUp = closes[i] >= opens[i];
      ctx.strokeStyle = barColors[i];

      ctx.beginPath();
      ctx.moveTo(x - tickHalfWidth, openY);
      ctx.lineTo(x, openY);
      ctx.stroke();

      ctx.beginPath();
      ctx.moveTo(x, closeY);
      ctx.lineTo(x + tickHalfWidth, closeY);
      ctx.stroke();

      // Direction glyph — redundant (non-color) cue for CVD readers: a small
      // triangle above the high (up days) or below the low (down days),
      // pointing in the direction of the move.
      const glyphHalfWidth = 4;
      const glyphHeight = 7;
      const baseY = isUp ? highY - 4 : lowY + 4;
      const apexY = isUp ? baseY - glyphHeight : baseY + glyphHeight;
      ctx.beginPath();
      ctx.moveTo(x, apexY);
      ctx.lineTo(x - glyphHalfWidth, baseY);
      ctx.lineTo(x + glyphHalfWidth, baseY);
      ctx.closePath();
      ctx.fillStyle = barColors[i];
      ctx.fill();
      ctx.lineWidth = 1;
      ctx.strokeStyle = t.ink;
      ctx.stroke();
    }
    ctx.restore();
  },
};

// --- Chart -------------------------------------------------------------------
// Core Chart.js has no dedicated OHLC type, so the high-low range is a thin
// floating bar (one core "bar" dataset, data=[low, high]) and the open/close
// ticks are drawn with the plugin above. Only core Chart.js bar-chart and
// plugin-hook features are used — no chartjs-chart-financial or other package.
new Chart(canvas, {
  type: "bar",
  data: {
    labels,
    datasets: [
      {
        label: "Range",
        data: lows.map((low, i) => [low, highs[i]]),
        backgroundColor: barColors,
        borderWidth: 0,
        barThickness: 3,
      },
    ],
  },
  plugins: [ohlcTicksPlugin],
  options: {
    responsive: true,
    maintainAspectRatio: false,
    animation: false,
    plugins: {
      title: {
        display: true,
        text: "ohlc-bar · javascript · chartjs · anyplot.ai",
        color: t.ink,
        font: { size: 22 },
      },
      legend: {
        labels: {
          color: t.ink,
          font: { size: 16 },
          generateLabels: () => [
            { text: "Up ▲ (close ≥ open)", fillStyle: t.palette[0], strokeStyle: t.ink, lineWidth: 1 },
            { text: "Down ▼ (close < open)", fillStyle: t.palette[4], strokeStyle: t.ink, lineWidth: 1 },
          ],
        },
        onClick: () => {},
      },
      tooltip: {
        mode: "index",
        intersect: false,
        callbacks: {
          label: (item) => {
            const i = item.dataIndex;
            return `O: $${opens[i].toFixed(2)}  H: $${highs[i].toFixed(2)}  L: $${lows[i].toFixed(2)}  C: $${closes[i].toFixed(2)}`;
          },
        },
      },
    },
    scales: {
      x: {
        ticks: {
          color: t.inkSoft,
          font: { size: 14 },
          maxRotation: 45,
          minRotation: 45,
          autoSkip: true,
          maxTicksLimit: 14,
        },
        grid: { display: false },
        title: { display: true, text: "Date", color: t.ink, font: { size: 16 } },
      },
      y: {
        min: priceMin - pricePad,
        max: priceMax + pricePad,
        ticks: {
          color: t.inkSoft,
          font: { size: 14 },
          callback: (value) => "$" + value.toFixed(2),
        },
        grid: { color: t.grid },
        title: { display: true, text: "Price (USD/barrel)", color: t.ink, font: { size: 16 } },
      },
    },
  },
});
Runnable source as JSON, for any HTTP client: https://api.anyplot.ai/specs/ohlc-bar/chartjs/code. Any spec id and library id listed in llms-full.txt fit the same URL shape; every URL below is complete and callable.
{
  "spec_id": "ohlc-bar",
  "language": "javascript",
  "library": "chartjs",
  "page": "https://anyplot.ai/ohlc-bar/javascript/chartjs",
  "hub": "https://anyplot.ai/ohlc-bar",
  "code_json": "https://api.anyplot.ai/specs/ohlc-bar/chartjs/code",
  "spec_json": "https://api.anyplot.ai/specs/ohlc-bar",
  "render_light_png": "https://storage.googleapis.com/anyplot-images/plots/ohlc-bar/javascript/chartjs/plot-light.png",
  "render_dark_png": "https://storage.googleapis.com/anyplot-images/plots/ohlc-bar/javascript/chartjs/plot-dark.png",
  "interactive_light_html": "https://storage.googleapis.com/anyplot-images/plots/ohlc-bar/javascript/chartjs/plot-light.html",
  "interactive_dark_html": "https://storage.googleapis.com/anyplot-images/plots/ohlc-bar/javascript/chartjs/plot-dark.html",
  "quality_score": 91.0,
  "license": "MIT",
  "guide": "https://anyplot.ai/llms.txt"
}
Part of OHLC Bar Chart on anyplot.ai.