The same plot in 14 other libraries — JavaScript: D3.js, Apache ECharts, Highcharts, MUI X Charts; Python: Altair, Bokeh, lets-plot, Matplotlib, Plotly, plotnine, Pygal, Seaborn; R: ggplot2; Julia: Makie.jl. Compare all 15 side by side: Basic Parallel Coordinates Plot in Python, R, Julia and JavaScript.
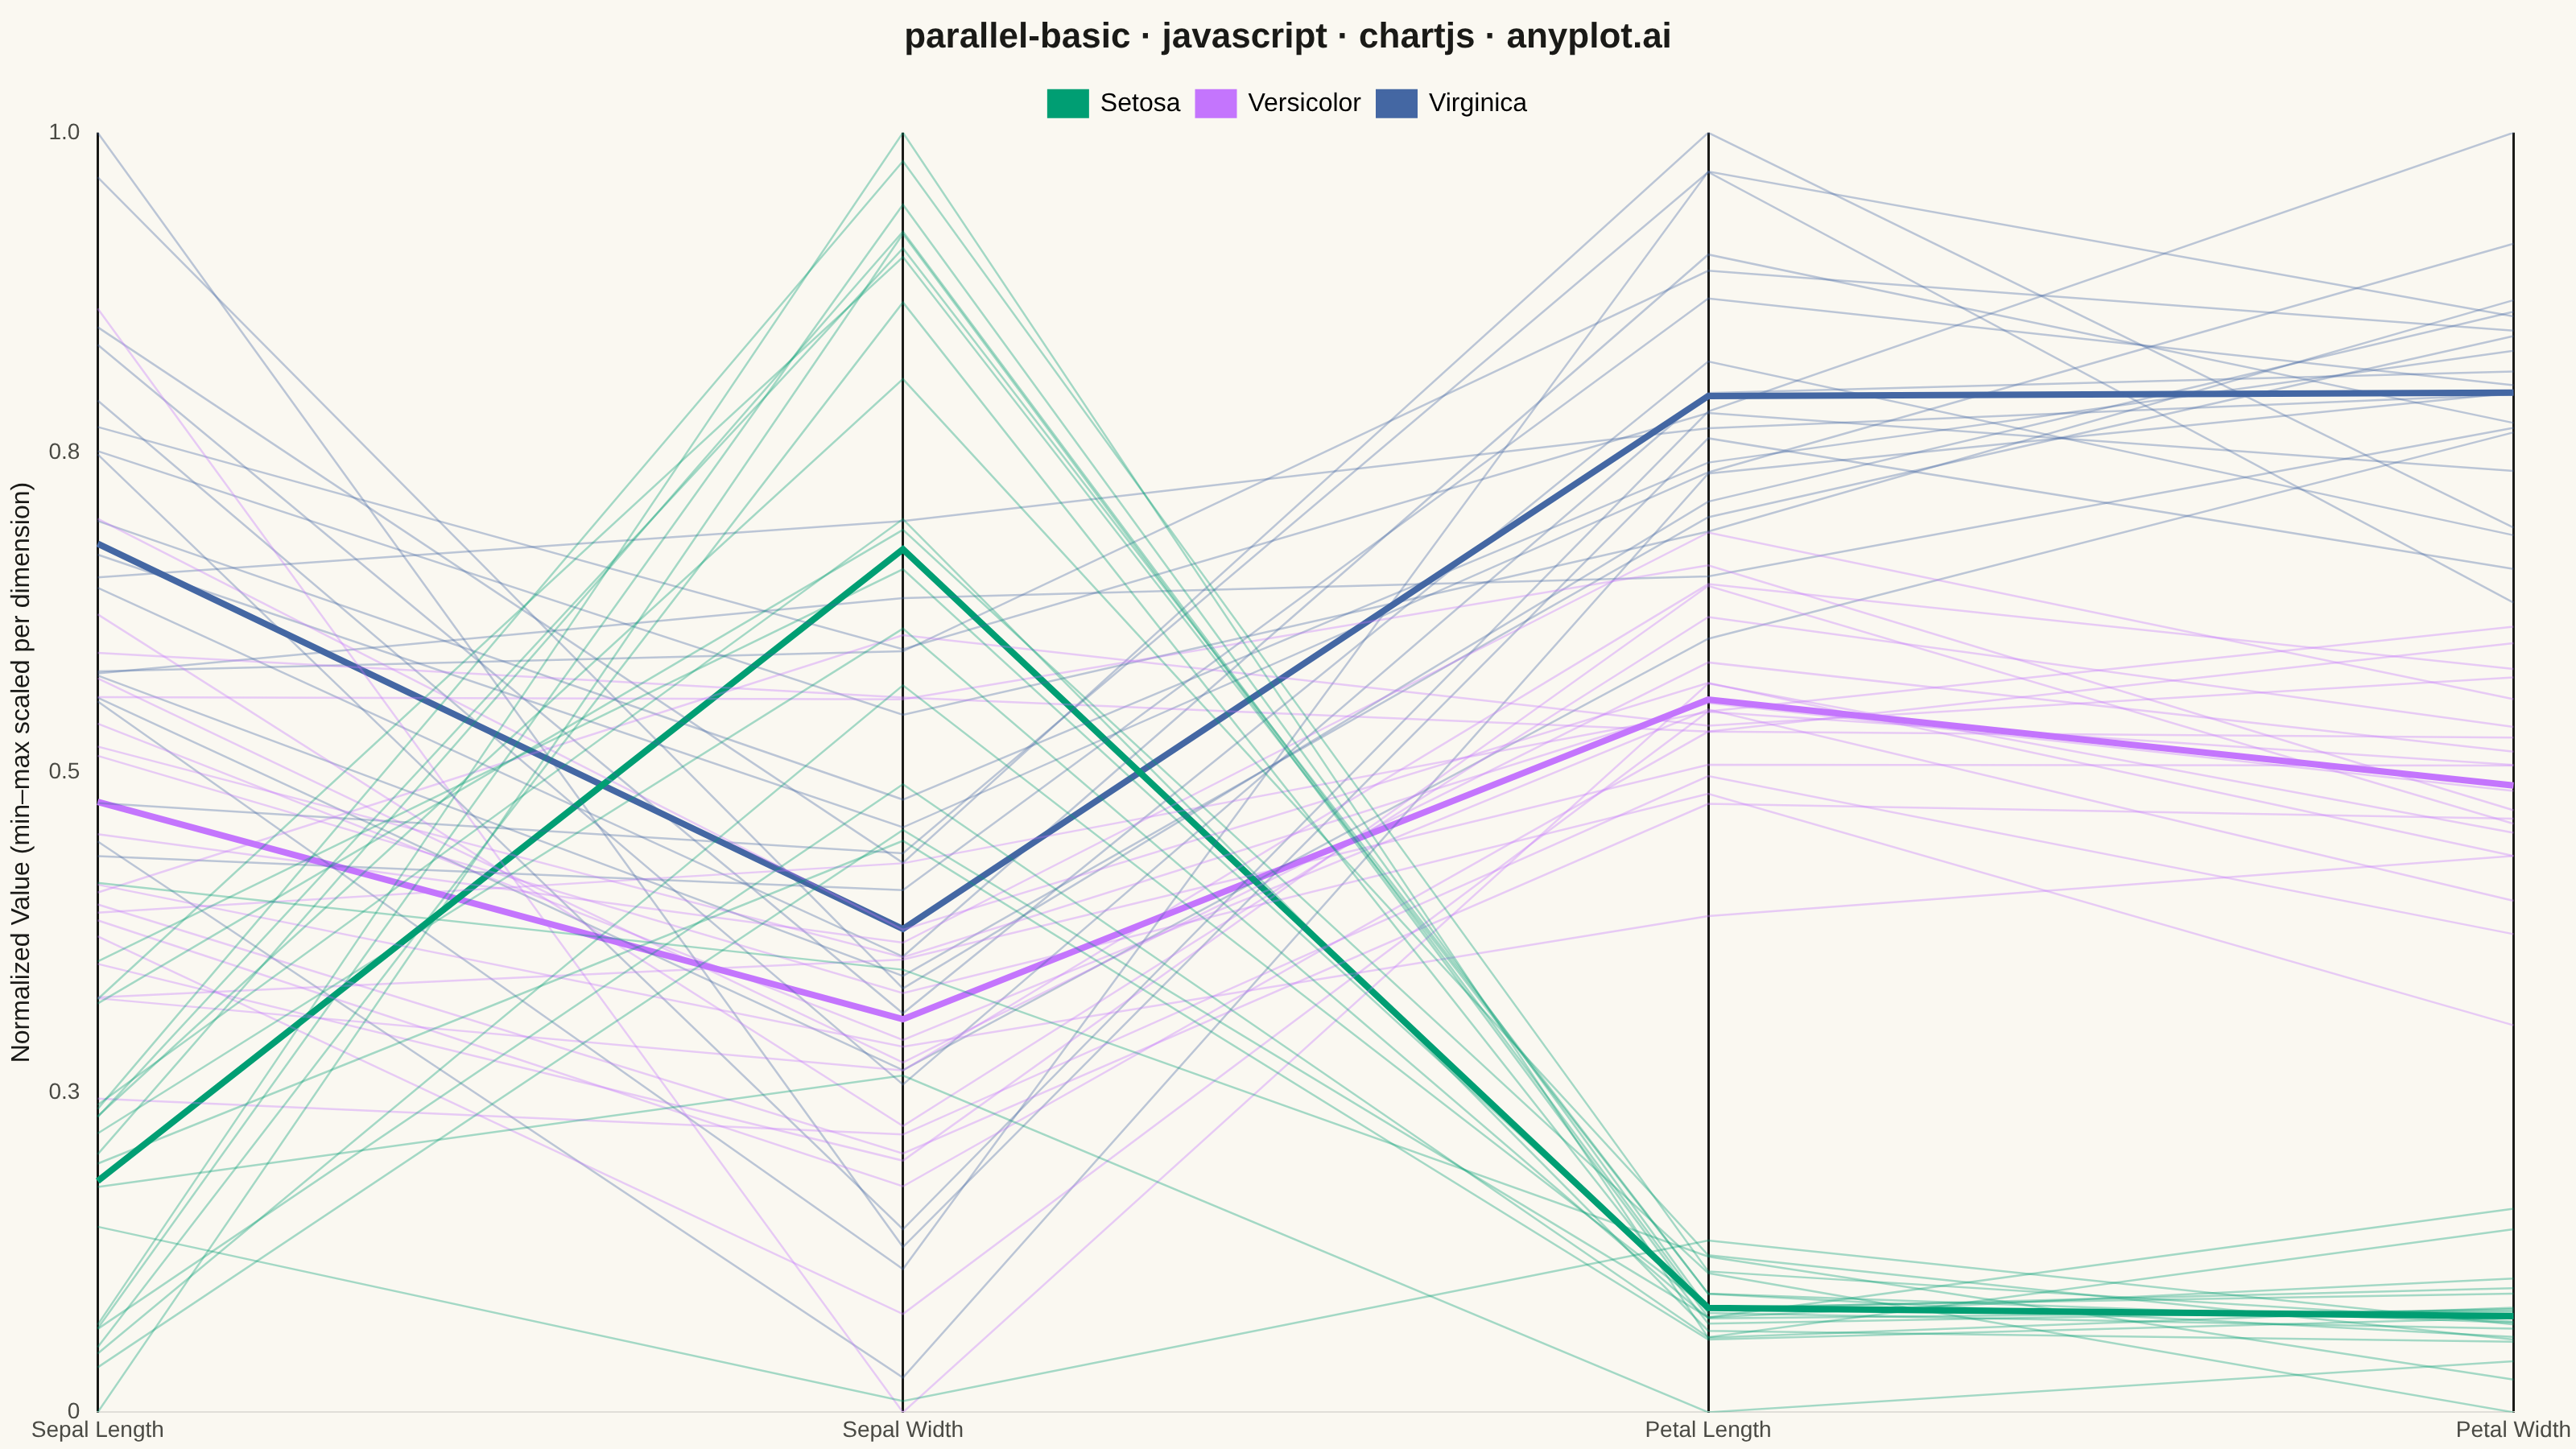
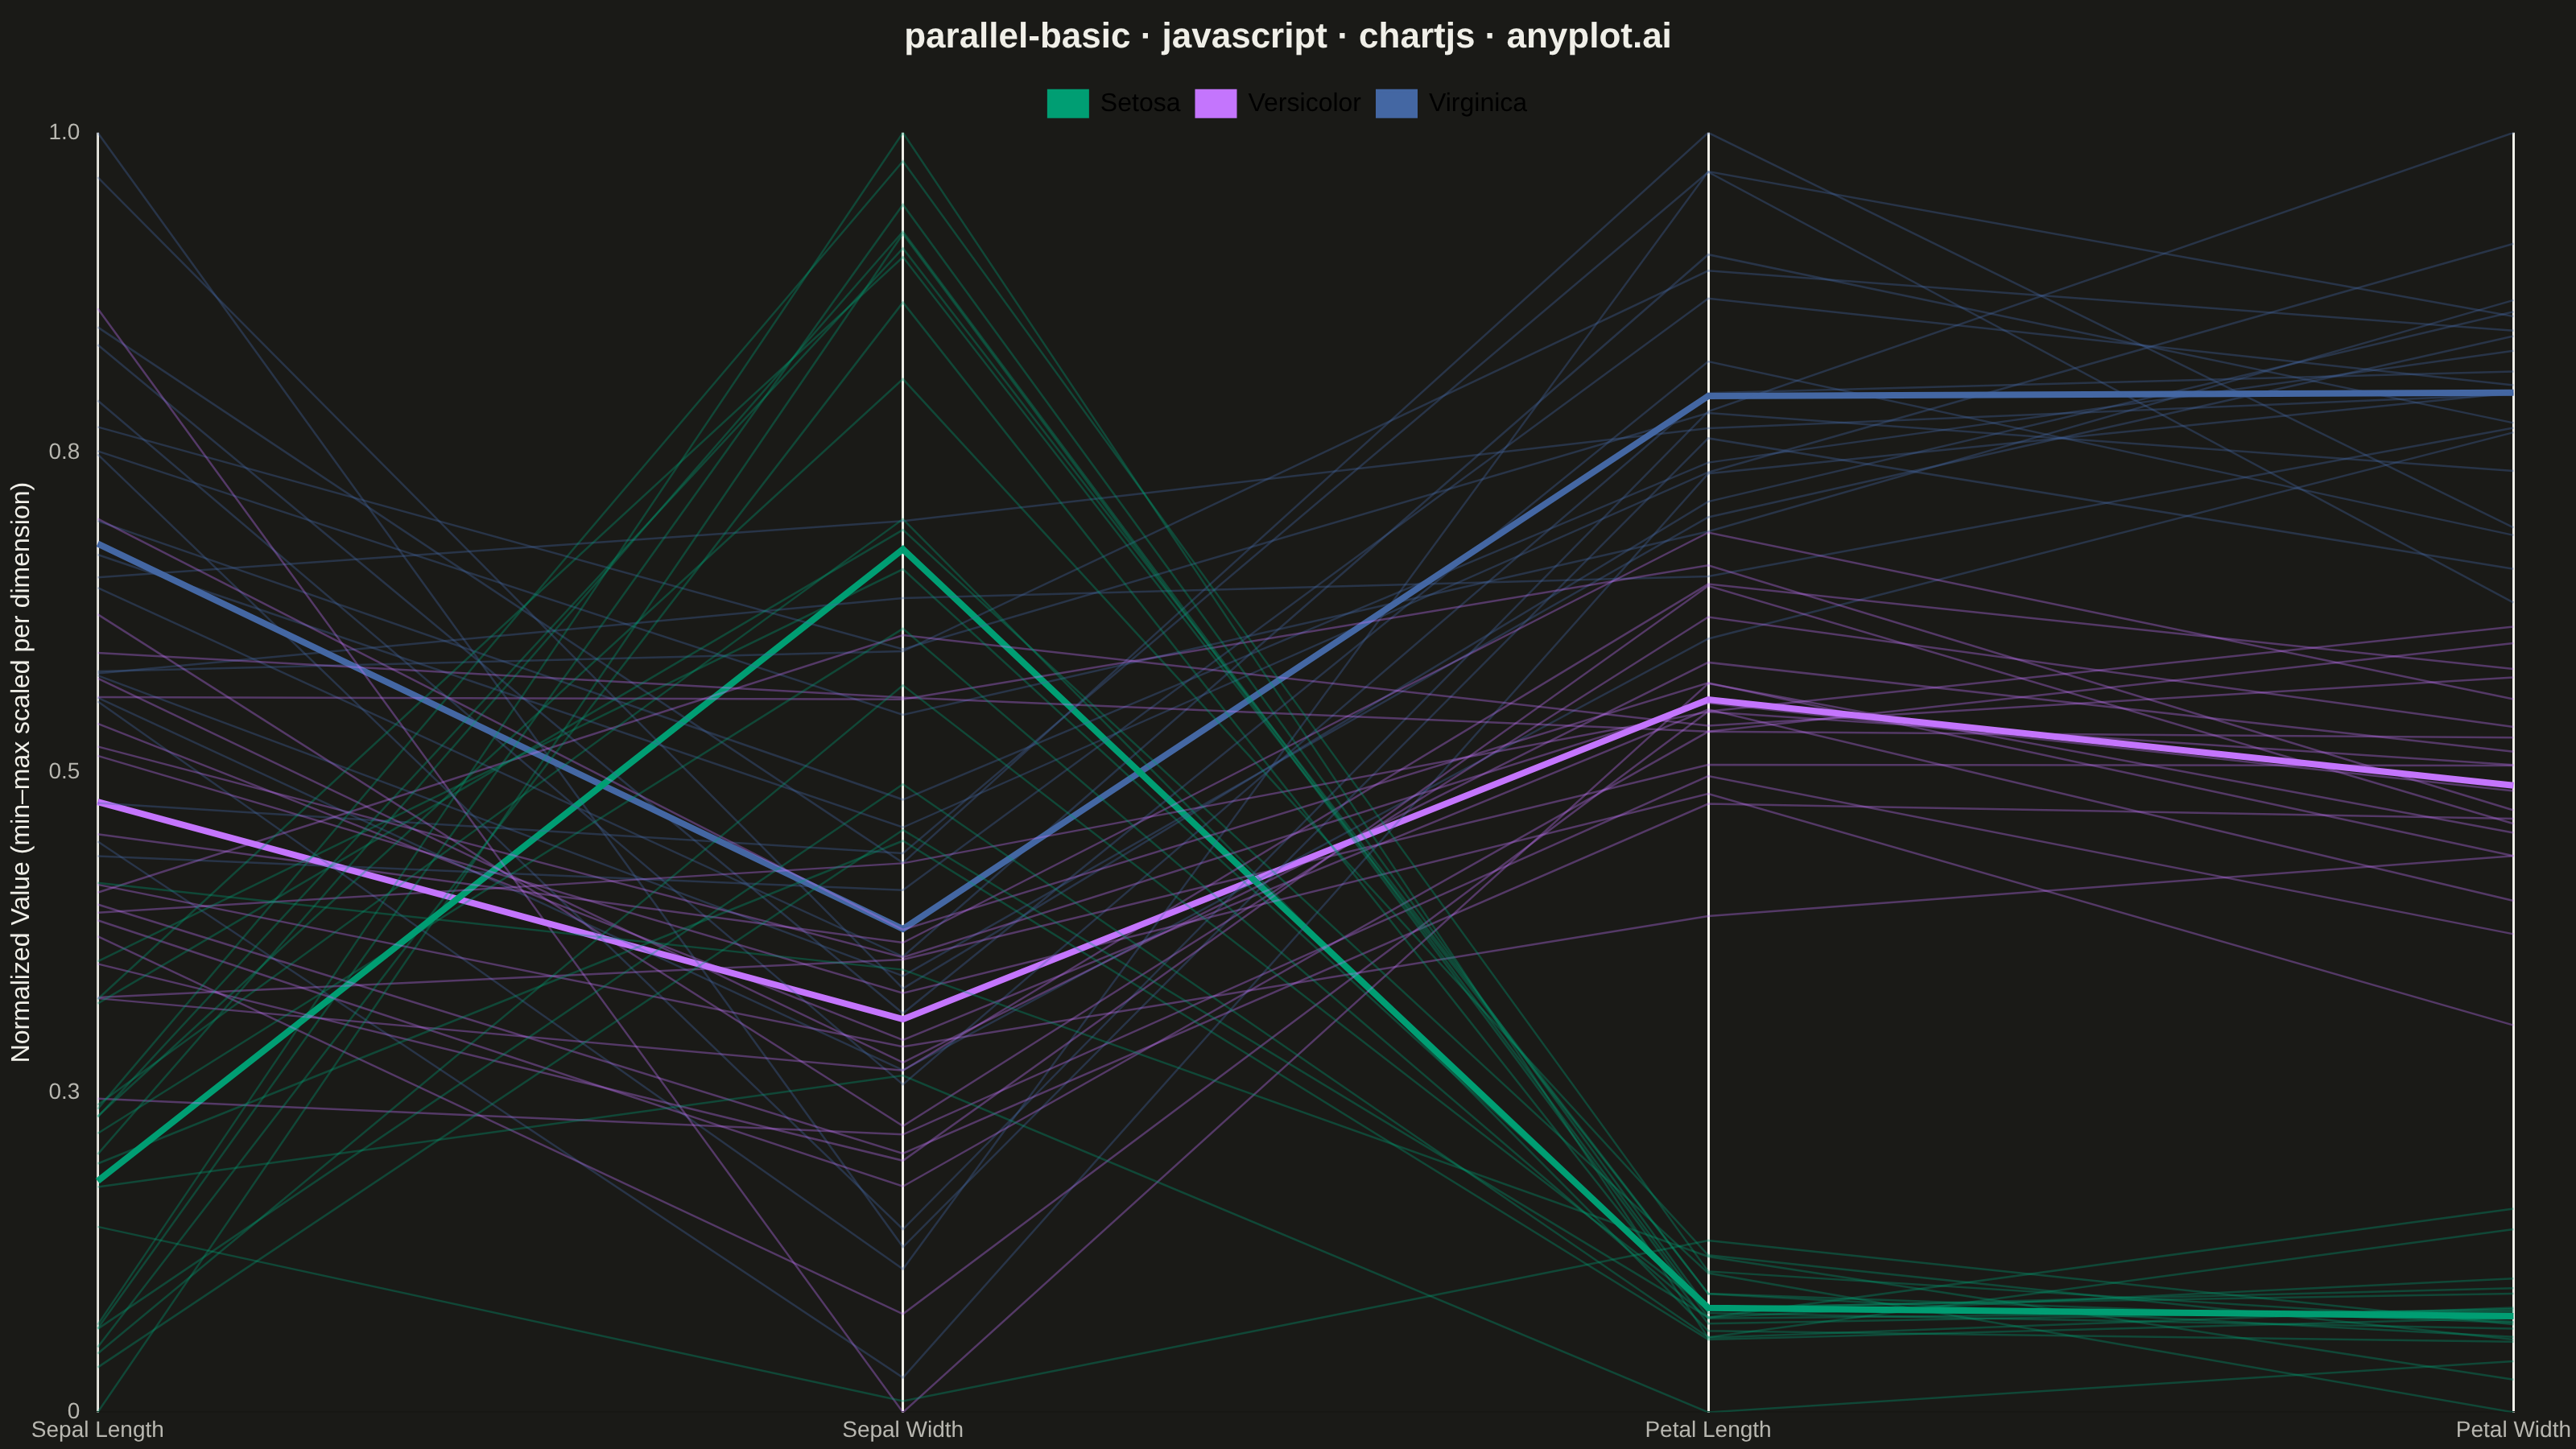
A parallel coordinates plot visualizes multivariate data by representing each variable as a vertical axis and each observation as a line connecting values across all axes. This technique is powerful for identifying patterns, clusters, and outliers in high-dimensional datasets where traditional 2D plots fall short. It enables simultaneous comparison of multiple variables for each data point.
// anyplot.ai
// parallel-basic: Basic Parallel Coordinates Plot
// Library: chartjs 4.4.7 | JavaScript 22.23.1
// Quality: 90/100 | Created: 2026-07-24

const t = window.ANYPLOT_TOKENS;

// --- Data (in-memory, deterministic, iris-inspired) ------------------------
// Tiny fixed-seed LCG + Box-Muller so the sample is reproducible without
// Math.random (the browser has no seeded RNG).
let lcgSeed = 42;
function lcgRand() {
  lcgSeed = (lcgSeed * 1103515245 + 12345) & 0x7fffffff;
  return lcgSeed / 0x7fffffff;
}
function randNormal() {
  const u1 = Math.max(lcgRand(), 1e-9);
  const u2 = lcgRand();
  return Math.sqrt(-2 * Math.log(u1)) * Math.cos(2 * Math.PI * u2);
}

const dimensions = ["Sepal Length", "Sepal Width", "Petal Length", "Petal Width"];

// Approximate per-species mean/sd for each dimension (cm), iris-inspired.
const speciesStats = [
  { name: "Setosa", stats: [[5.0, 0.35], [3.42, 0.38], [1.46, 0.17], [0.24, 0.11]] },
  { name: "Versicolor", stats: [[5.94, 0.52], [2.77, 0.31], [4.26, 0.47], [1.33, 0.2]] },
  { name: "Virginica", stats: [[6.59, 0.64], [2.97, 0.32], [5.55, 0.55], [2.03, 0.27]] },
];
const OBS_PER_SPECIES = 20;

const observations = [];
speciesStats.forEach((species, speciesIndex) => {
  for (let i = 0; i < OBS_PER_SPECIES; i++) {
    const raw = species.stats.map(([mean, sd]) => mean + sd * randNormal());
    observations.push({ speciesIndex, raw });
  }
});

// Min-max normalize each dimension independently so all axes share one 0-1
// scale and can be compared side by side, per the spec's normalization note.
const mins = dimensions.map((_, d) => Math.min(...observations.map((o) => o.raw[d])));
const maxs = dimensions.map((_, d) => Math.max(...observations.map((o) => o.raw[d])));
observations.forEach((o) => {
  o.normalized = o.raw.map((v, d) => (v - mins[d]) / (maxs[d] - mins[d]));
});

function hexToRgba(hex, alpha) {
  const r = parseInt(hex.slice(1, 3), 16);
  const g = parseInt(hex.slice(3, 5), 16);
  const b = parseInt(hex.slice(5, 7), 16);
  return `rgba(${r}, ${g}, ${b}, ${alpha})`;
}

const speciesColors = speciesStats.map((_, i) => t.palette[i % t.palette.length]);

// Per-species mean profile (one point per dimension), drawn as a bolder line
// on top of the faint individual traces so each species has a clear focal
// line to anchor the eye, especially where Versicolor/Virginica overlap.
const meanProfiles = speciesStats.map((_, speciesIndex) => {
  const speciesObs = observations.filter((o) => o.speciesIndex === speciesIndex);
  return dimensions.map(
    (_, d) => speciesObs.reduce((sum, o) => sum + o.normalized[d], 0) / speciesObs.length
  );
});

// --- Mount -------------------------------------------------------------
const canvas = document.createElement("canvas");
document.getElementById("container").appendChild(canvas);

// --- Chart ---------------------------------------------------------------
// One line dataset per observation (Chart.js has no native parallel-coords
// type); category x-axis ticks stand in for the per-dimension axes, and a
// shared normalized y-axis keeps every dimension comparable. A bold mean
// line per species is appended last so it draws on top of the faint
// individual traces (Chart.js draws line datasets in array order).
const individualDatasets = observations.map((o) => ({
  data: o.normalized,
  borderColor: hexToRgba(speciesColors[o.speciesIndex], 0.35),
  borderWidth: 1.25,
  pointRadius: 0,
  pointHoverRadius: 0,
  tension: 0,
  fill: false,
}));
const meanDatasets = meanProfiles.map((profile, speciesIndex) => ({
  data: profile,
  borderColor: speciesColors[speciesIndex],
  borderWidth: 4,
  pointRadius: 0,
  pointHoverRadius: 0,
  tension: 0,
  fill: false,
}));

new Chart(canvas, {
  type: "line",
  data: {
    labels: dimensions,
    datasets: [...individualDatasets, ...meanDatasets],
  },
  options: {
    responsive: true,
    maintainAspectRatio: false,
    animation: false,
    plugins: {
      title: {
        display: true,
        text: "parallel-basic · javascript · chartjs · anyplot.ai",
        color: t.ink,
        font: { size: 22 },
      },
      legend: {
        labels: {
          color: t.ink,
          font: { size: 16 },
          boxWidth: 24,
          generateLabels: () =>
            speciesStats.map((species, i) => ({
              text: species.name,
              fillStyle: speciesColors[i],
              strokeStyle: speciesColors[i],
              lineWidth: 2,
              datasetIndex: individualDatasets.length + i,
            })),
        },
        onClick: () => {},
      },
      tooltip: { enabled: false },
    },
    scales: {
      x: {
        type: "category",
        ticks: { color: t.inkSoft, font: { size: 14 } },
        grid: { color: t.ink, lineWidth: 1.5, tickLength: 0 },
      },
      y: {
        min: 0,
        max: 1,
        ticks: { color: t.inkSoft, font: { size: 14 }, stepSize: 0.25 },
        grid: { display: false },
        title: {
          display: true,
          text: "Normalized Value (min–max scaled per dimension)",
          color: t.ink,
          font: { size: 16 },
        },
      },
    },
  },
});
Runnable source as JSON, for any HTTP client: https://api.anyplot.ai/specs/parallel-basic/chartjs/code. Any spec id and library id listed in llms-full.txt fit the same URL shape; every URL below is complete and callable.
{
  "spec_id": "parallel-basic",
  "language": "javascript",
  "library": "chartjs",
  "page": "https://anyplot.ai/parallel-basic/javascript/chartjs",
  "hub": "https://anyplot.ai/parallel-basic",
  "code_json": "https://api.anyplot.ai/specs/parallel-basic/chartjs/code",
  "spec_json": "https://api.anyplot.ai/specs/parallel-basic",
  "render_light_png": "https://storage.googleapis.com/anyplot-images/plots/parallel-basic/javascript/chartjs/plot-light.png",
  "render_dark_png": "https://storage.googleapis.com/anyplot-images/plots/parallel-basic/javascript/chartjs/plot-dark.png",
  "interactive_light_html": "https://storage.googleapis.com/anyplot-images/plots/parallel-basic/javascript/chartjs/plot-light.html",
  "interactive_dark_html": "https://storage.googleapis.com/anyplot-images/plots/parallel-basic/javascript/chartjs/plot-dark.html",
  "quality_score": 90.0,
  "license": "MIT",
  "guide": "https://anyplot.ai/llms.txt"
}
Part of Basic Parallel Coordinates Plot on anyplot.ai.