The same plot in 14 other libraries — JavaScript: Chart.js, D3.js, Apache ECharts, Highcharts; Python: Altair, Bokeh, lets-plot, Matplotlib, Plotly, plotnine, Pygal, Seaborn; R: ggplot2; Julia: Makie.jl. Compare all 15 side by side: Basic Parallel Coordinates Plot in Python, R, Julia and JavaScript.
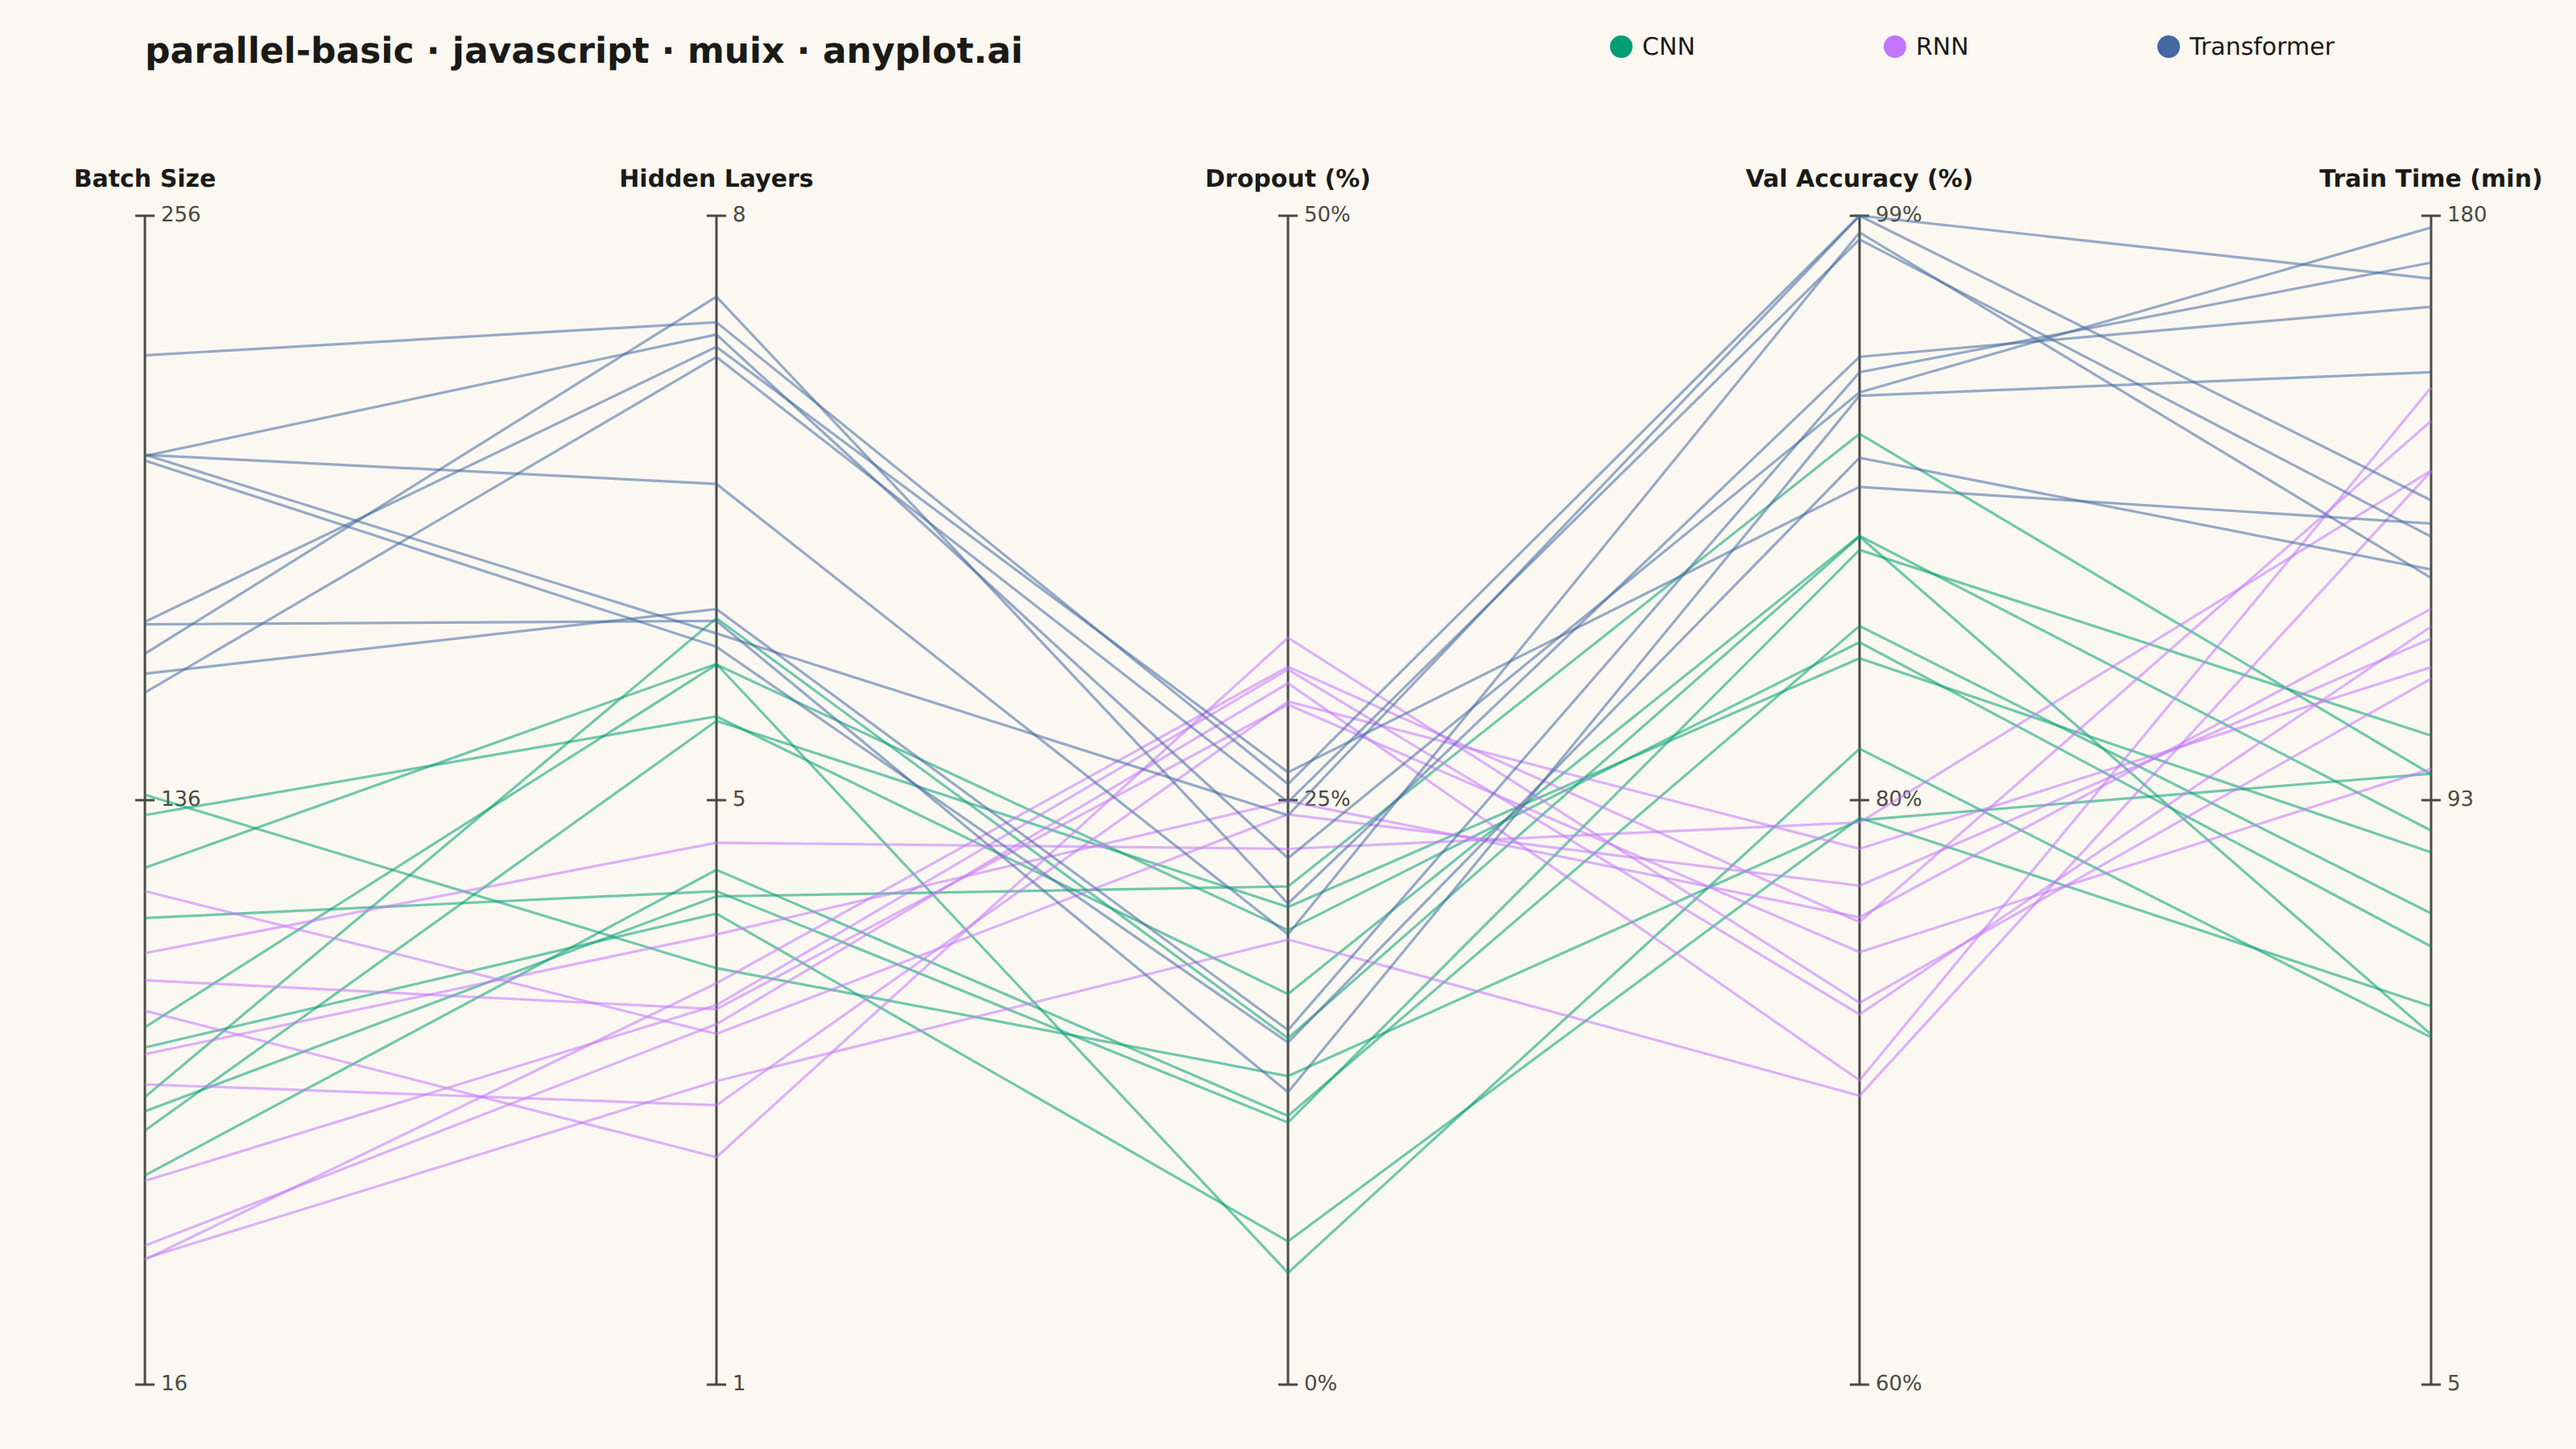
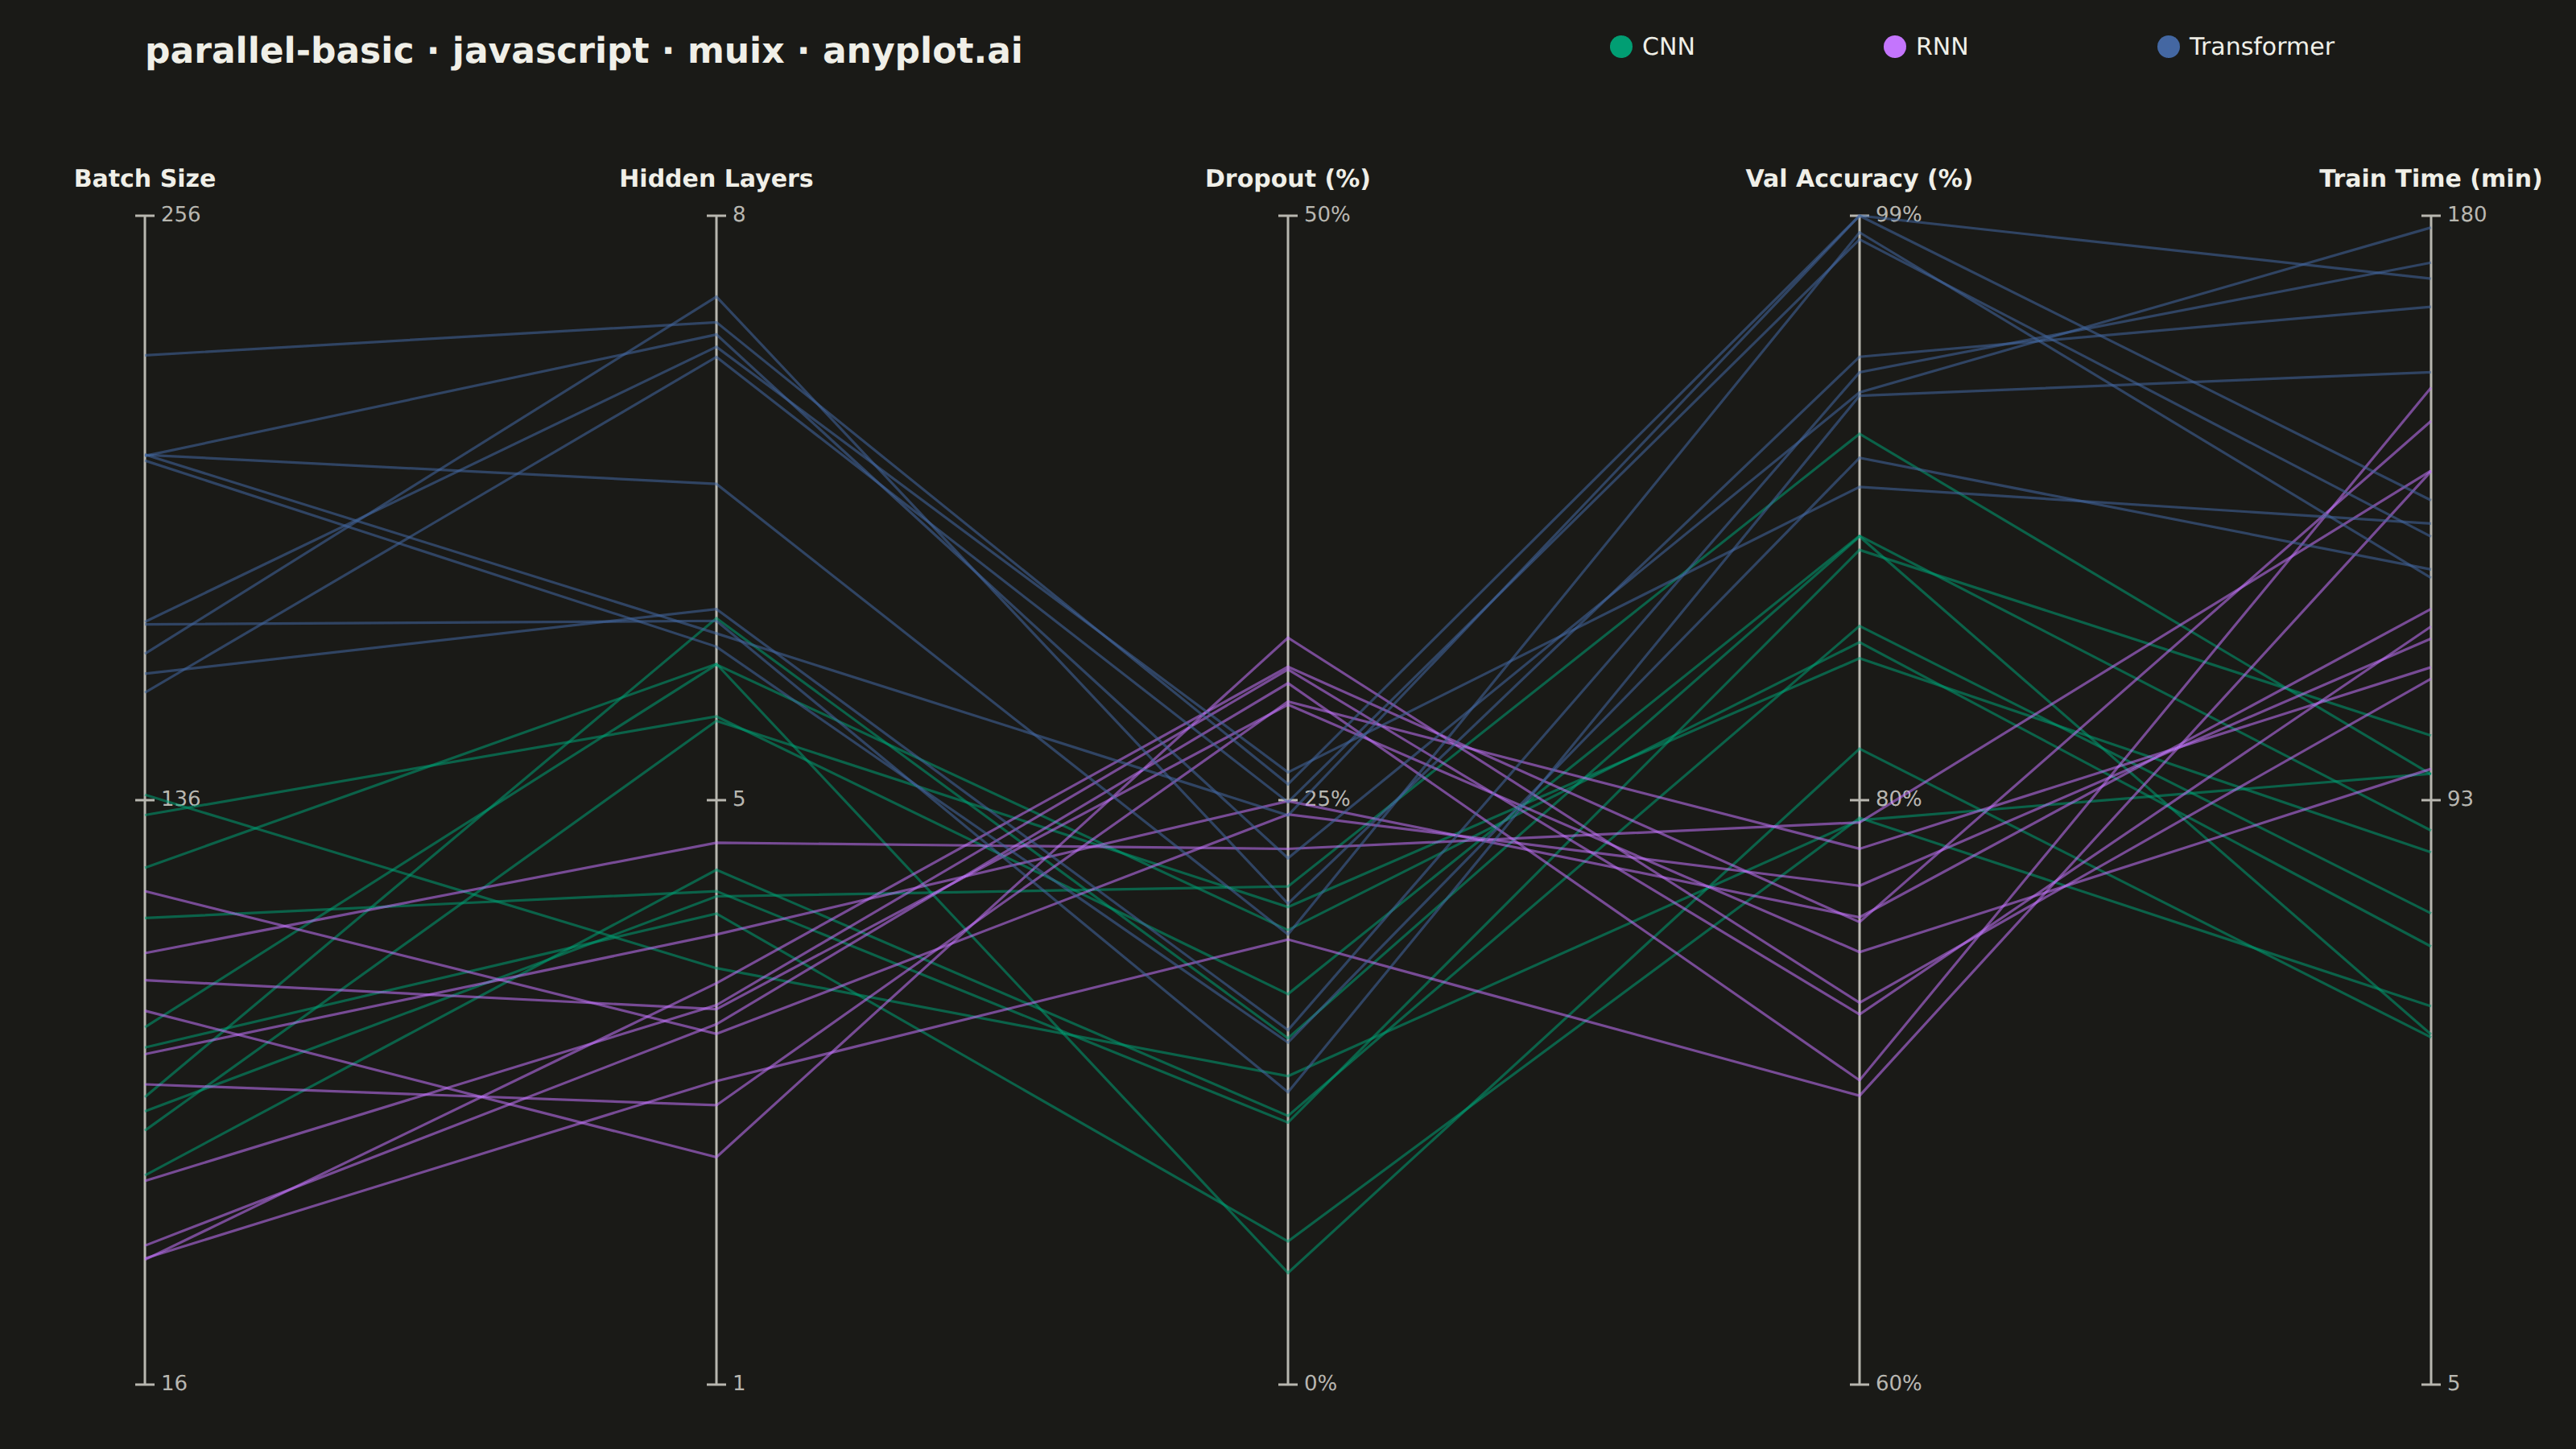
A parallel coordinates plot visualizes multivariate data by representing each variable as a vertical axis and each observation as a line connecting values across all axes. This technique is powerful for identifying patterns, clusters, and outliers in high-dimensional datasets where traditional 2D plots fall short. It enables simultaneous comparison of multiple variables for each data point.
// anyplot.ai
// parallel-basic: Basic Parallel Coordinates Plot
// Library: muix 7.29.1 | JavaScript 22.23.1
// Quality: 92/100 | Created: 2026-07-24
import { ChartContainer } from "@mui/x-charts/ChartContainer";
import { useXScale, useDrawingArea } from "@mui/x-charts/hooks";

const t = window.ANYPLOT_TOKENS;
const FONT = "Inter, system-ui, -apple-system, sans-serif";

// --- Data: 30 model-training runs across 3 architectures, compared on 5 -----
// hyperparameter/performance dimensions. Each dimension keeps its own native
// scale (batch size, layer count, dropout %, accuracy %, minutes) — that is
// the whole point of a parallel-coordinates plot: it lets very differently
// scaled variables sit side by side without forcing a shared axis.
function makeLcg(seed) {
  let state = seed >>> 0;
  return () => {
    state = (state * 1664525 + 1013904223) >>> 0;
    return state / 4294967296;
  };
}
const rand = makeLcg(20260724);

const DIMENSIONS = [
  { key: "batch", label: "Batch Size", min: 16, max: 256, format: (v) => `${Math.round(v)}` },
  { key: "layers", label: "Hidden Layers", min: 1, max: 8, format: (v) => `${Math.round(v)}` },
  { key: "dropout", label: "Dropout (%)", min: 0, max: 50, format: (v) => `${v.toFixed(0)}%` },
  { key: "accuracy", label: "Val Accuracy (%)", min: 60, max: 99, format: (v) => `${v.toFixed(0)}%` },
  { key: "time", label: "Train Time (min)", min: 5, max: 180, format: (v) => `${Math.round(v)}` },
];

// Fractional (0–1) centers per dimension, per architecture — the source of
// the clustering pattern the plot is meant to reveal.
const ARCHITECTURES = [
  { name: "CNN", color: t.palette[0], count: 10, centers: [0.35, 0.5, 0.25, 0.65, 0.4] },
  { name: "RNN", color: t.palette[1], count: 10, centers: [0.25, 0.35, 0.55, 0.35, 0.7] },
  { name: "Transformer", color: t.palette[2], count: 10, centers: [0.75, 0.8, 0.35, 0.85, 0.85] },
];

function withAlpha(hex, alpha) {
  const r = parseInt(hex.slice(1, 3), 16);
  const g = parseInt(hex.slice(3, 5), 16);
  const b = parseInt(hex.slice(5, 7), 16);
  return `rgba(${r}, ${g}, ${b}, ${alpha})`;
}

const RUNS = [];
ARCHITECTURES.forEach((arch) => {
  for (let i = 0; i < arch.count; i += 1) {
    const values = DIMENSIONS.map((dim, d) => {
      const jitter = (rand() - 0.5) * 0.36;
      const fraction = Math.min(1, Math.max(0, arch.centers[d] + jitter));
      return dim.min + fraction * (dim.max - dim.min);
    });
    RUNS.push({ architecture: arch.name, color: arch.color, values });
  }
});

// --- Custom marks — drawn on the MUI X coordinate system --------------------
// @mui/x-charts has no native parallel-coordinates chart, so the axes and
// connecting lines are drawn directly with useXScale/useDrawingArea, the same
// low-level building blocks ChartsAxis/ChartsGrid use internally. The x-axis
// (dimension index → pixel) comes from a genuine x-charts linear scale; the
// y position per dimension is computed by hand since each axis has its own
// independent value domain, which no single x-charts y-axis can express.

function ParallelAxes() {
  const xScale = useXScale();
  const { top, height } = useDrawingArea();
  return (
    <g fontFamily={FONT}>
      {DIMENSIONS.map((dim, i) => {
        const x = xScale(i);
        return (
          <g key={dim.key}>
            <line x1={x} y1={top} x2={x} y2={top + height} stroke={t.inkSoft} strokeWidth={1.5} />
            {[0, 0.5, 1].map((f) => {
              const y = top + height * (1 - f);
              const value = dim.min + f * (dim.max - dim.min);
              return (
                <g key={f}>
                  <line x1={x - 6} y1={y} x2={x + 6} y2={y} stroke={t.inkSoft} strokeWidth={1.5} />
                  <text x={x + 10} y={y} fontSize={13} fill={t.inkSoft} dominantBaseline="middle">
                    {dim.format(value)}
                  </text>
                </g>
              );
            })}
            <text x={x} y={top - 18} fontSize={15} fontWeight={600} fill={t.ink} textAnchor="middle">
              {dim.label}
            </text>
          </g>
        );
      })}
    </g>
  );
}

function ParallelLines() {
  const xScale = useXScale();
  const { top, height } = useDrawingArea();
  const yFor = (dimIndex, value) => {
    const dim = DIMENSIONS[dimIndex];
    const fraction = (value - dim.min) / (dim.max - dim.min);
    return top + height * (1 - fraction);
  };
  return (
    <g fill="none" strokeWidth={1.6}>
      {RUNS.map((run, i) => {
        const points = run.values.map((v, d) => `${xScale(d)},${yFor(d, v)}`).join(" ");
        return <polyline key={i} points={points} stroke={withAlpha(run.color, 0.55)} />;
      })}
    </g>
  );
}

function Legend() {
  return (
    <g fontFamily={FONT}>
      {ARCHITECTURES.map((arch, i) => (
        <g key={arch.name} transform={`translate(${i * 170}, 0)`}>
          <circle cx={7} cy={7} r={7} fill={arch.color} />
          <text x={20} y={12} fontSize={15} fill={t.ink}>
            {arch.name}
          </text>
        </g>
      ))}
    </g>
  );
}

const TITLE_H = 64;

export default function Chart() {
  const W = window.ANYPLOT_SIZE.width;
  const H = window.ANYPLOT_SIZE.height;
  const N = DIMENSIONS.length;

  return (
    <div
      style={{
        width: W,
        height: H,
        background: t.pageBg,
        fontFamily: FONT,
        display: "flex",
        flexDirection: "column",
      }}
    >
      <div
        style={{
          height: TITLE_H,
          display: "flex",
          alignItems: "center",
          justifyContent: "space-between",
          padding: "0 90px",
        }}
      >
        <span style={{ fontSize: 22, fontWeight: 600, color: t.ink }}>
          parallel-basic · javascript · muix · anyplot.ai
        </span>
        <svg width={ARCHITECTURES.length * 170} height={20}>
          <Legend />
        </svg>
      </div>
      <ChartContainer
        width={W}
        height={H - TITLE_H}
        skipAnimation
        series={[]}
        margin={{ top: 70, right: 90, bottom: 40, left: 90 }}
        xAxis={[{ scaleType: "linear", min: 0, max: N - 1 }]}
        yAxis={[{ scaleType: "linear", min: 0, max: 1 }]}
      >
        <ParallelAxes />
        <ParallelLines />
      </ChartContainer>
    </div>
  );
}
Runnable source as JSON, for any HTTP client: https://api.anyplot.ai/specs/parallel-basic/muix/code. Any spec id and library id listed in llms-full.txt fit the same URL shape; every URL below is complete and callable.
{
  "spec_id": "parallel-basic",
  "language": "javascript",
  "library": "muix",
  "page": "https://anyplot.ai/parallel-basic/javascript/muix",
  "hub": "https://anyplot.ai/parallel-basic",
  "code_json": "https://api.anyplot.ai/specs/parallel-basic/muix/code",
  "spec_json": "https://api.anyplot.ai/specs/parallel-basic",
  "render_light_png": "https://storage.googleapis.com/anyplot-images/plots/parallel-basic/javascript/muix/plot-light.png",
  "render_dark_png": "https://storage.googleapis.com/anyplot-images/plots/parallel-basic/javascript/muix/plot-dark.png",
  "interactive_light_html": "https://storage.googleapis.com/anyplot-images/plots/parallel-basic/javascript/muix/plot-light.html",
  "interactive_dark_html": "https://storage.googleapis.com/anyplot-images/plots/parallel-basic/javascript/muix/plot-dark.html",
  "quality_score": 92.0,
  "license": "MIT",
  "guide": "https://anyplot.ai/llms.txt"
}
Part of Basic Parallel Coordinates Plot on anyplot.ai.