The same plot in 14 other libraries — JavaScript: Chart.js, D3.js, Apache ECharts, MUI X Charts; Python: Altair, Bokeh, lets-plot, Matplotlib, Plotly, plotnine, Pygal, Seaborn; R: ggplot2; Julia: Makie.jl. Compare all 15 side by side: Basic Parallel Coordinates Plot in Python, R, Julia and JavaScript.
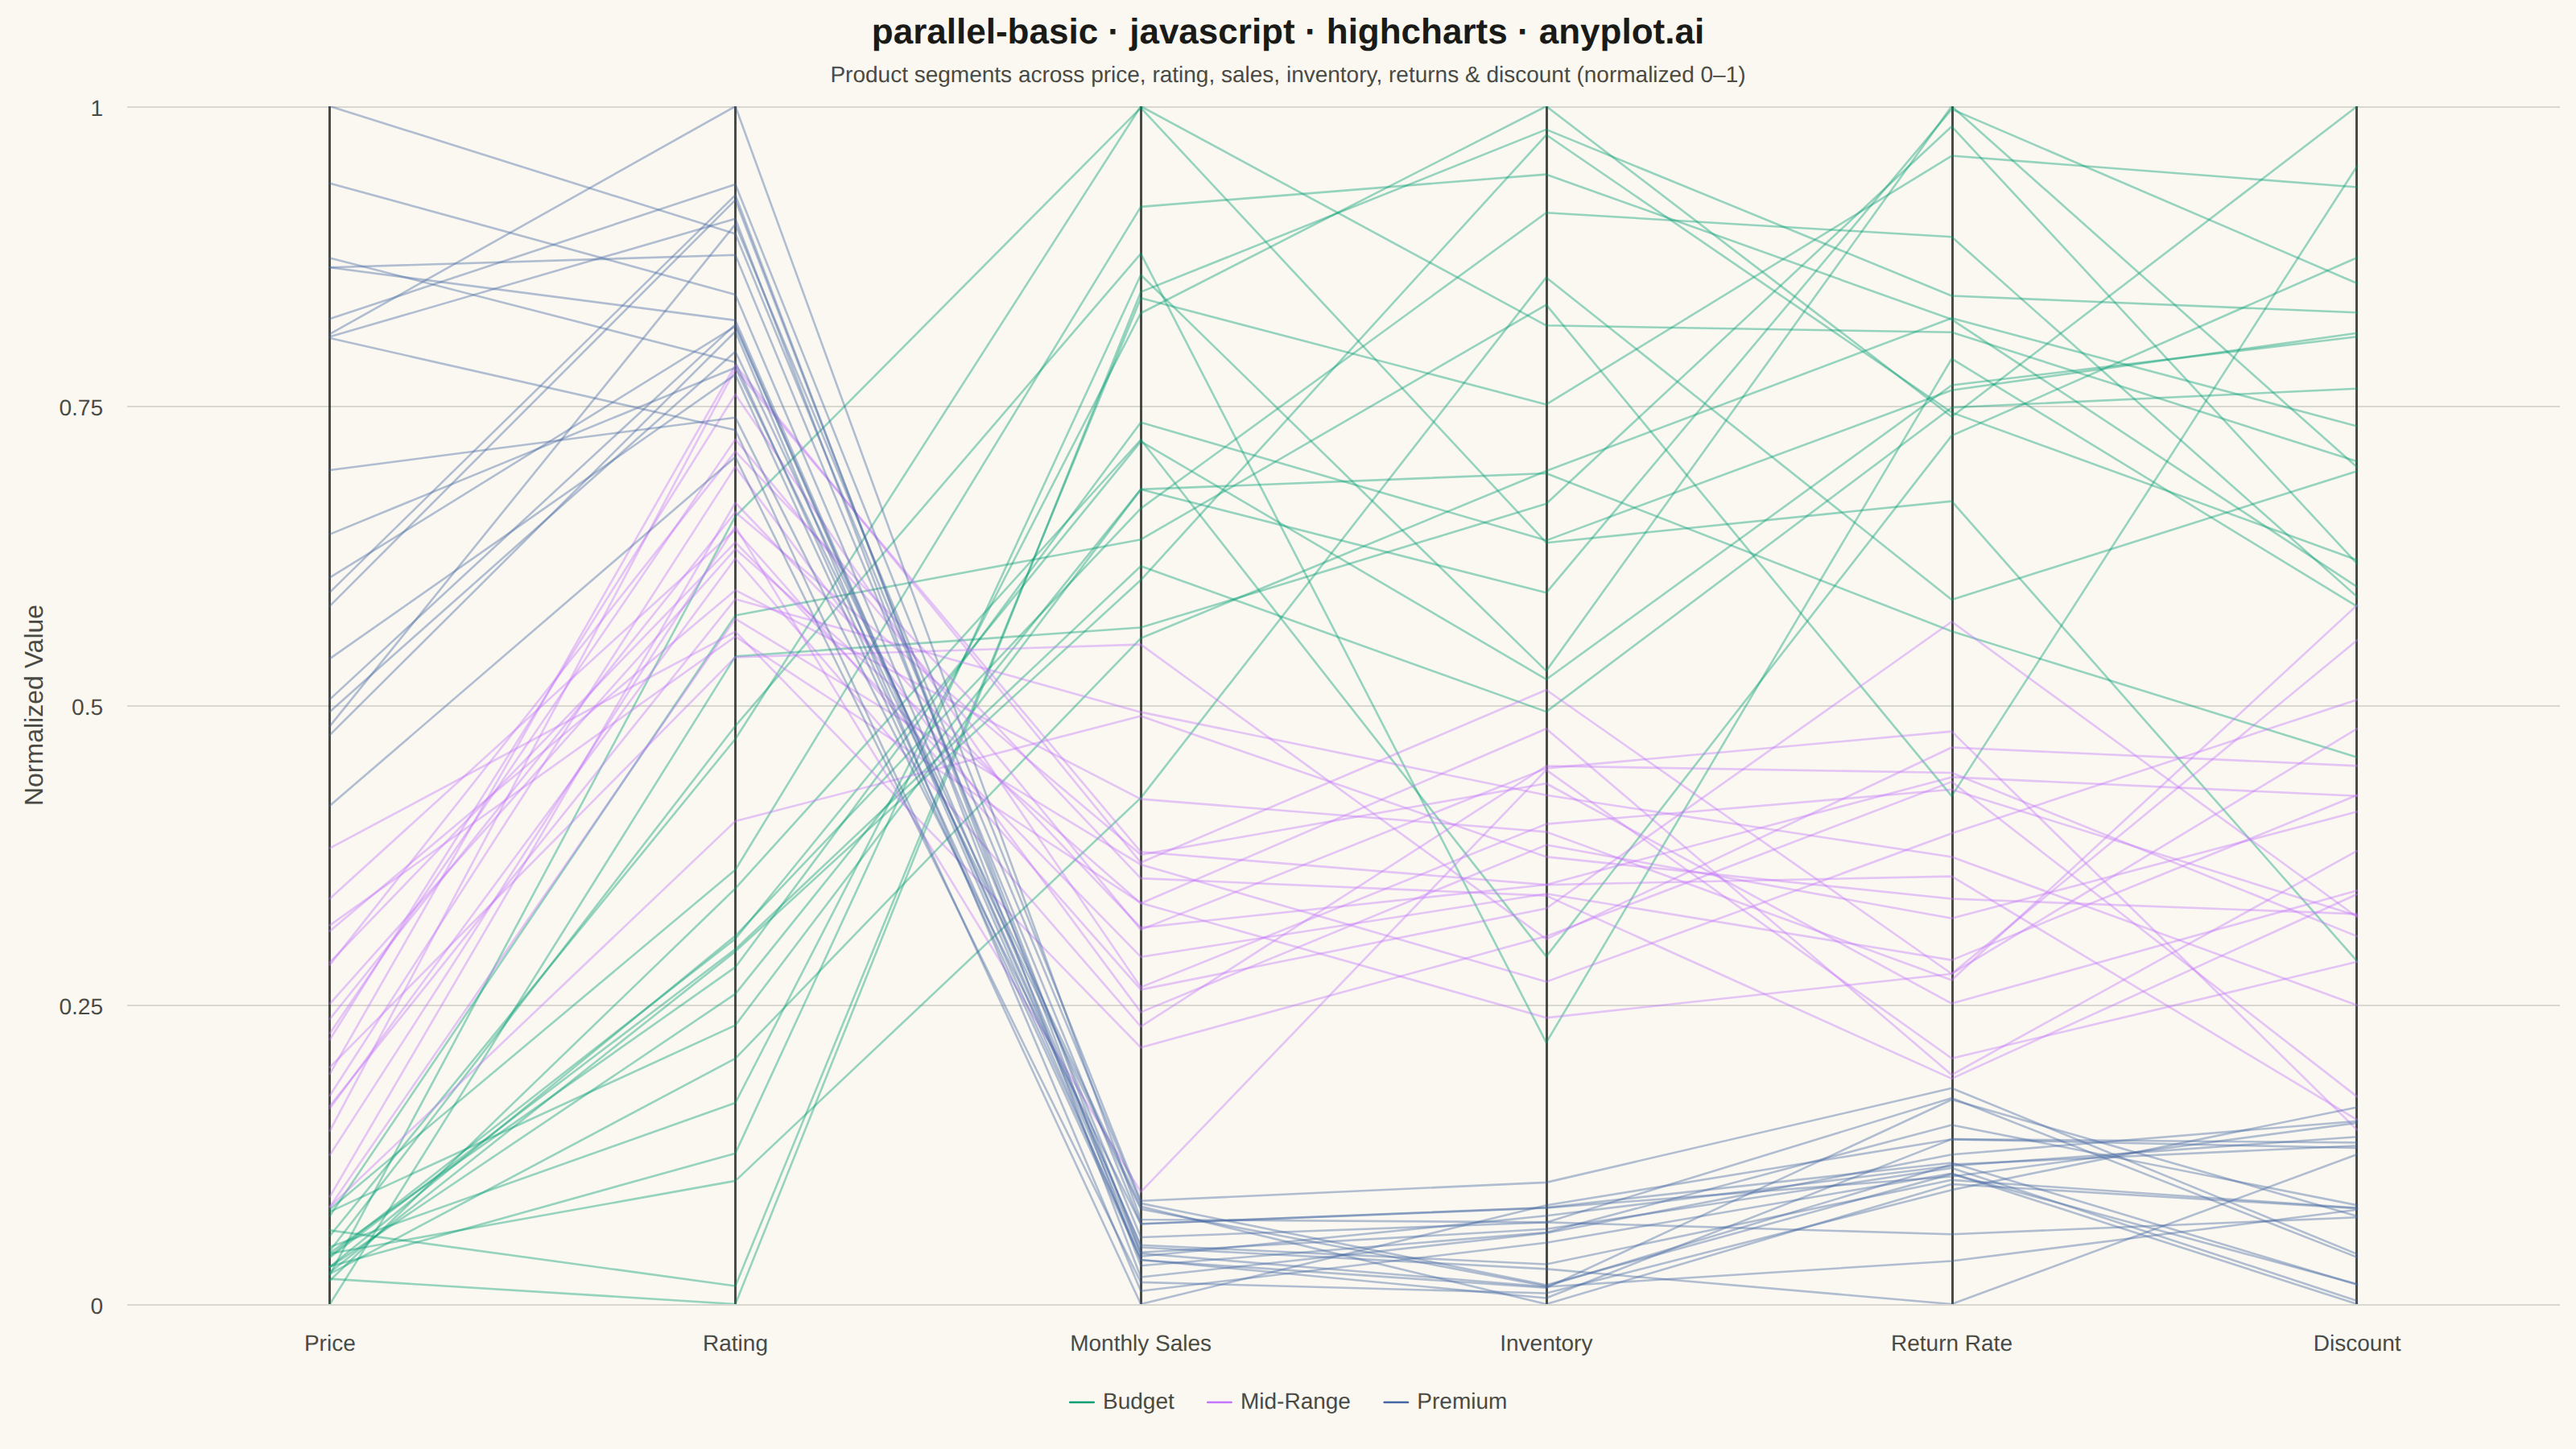
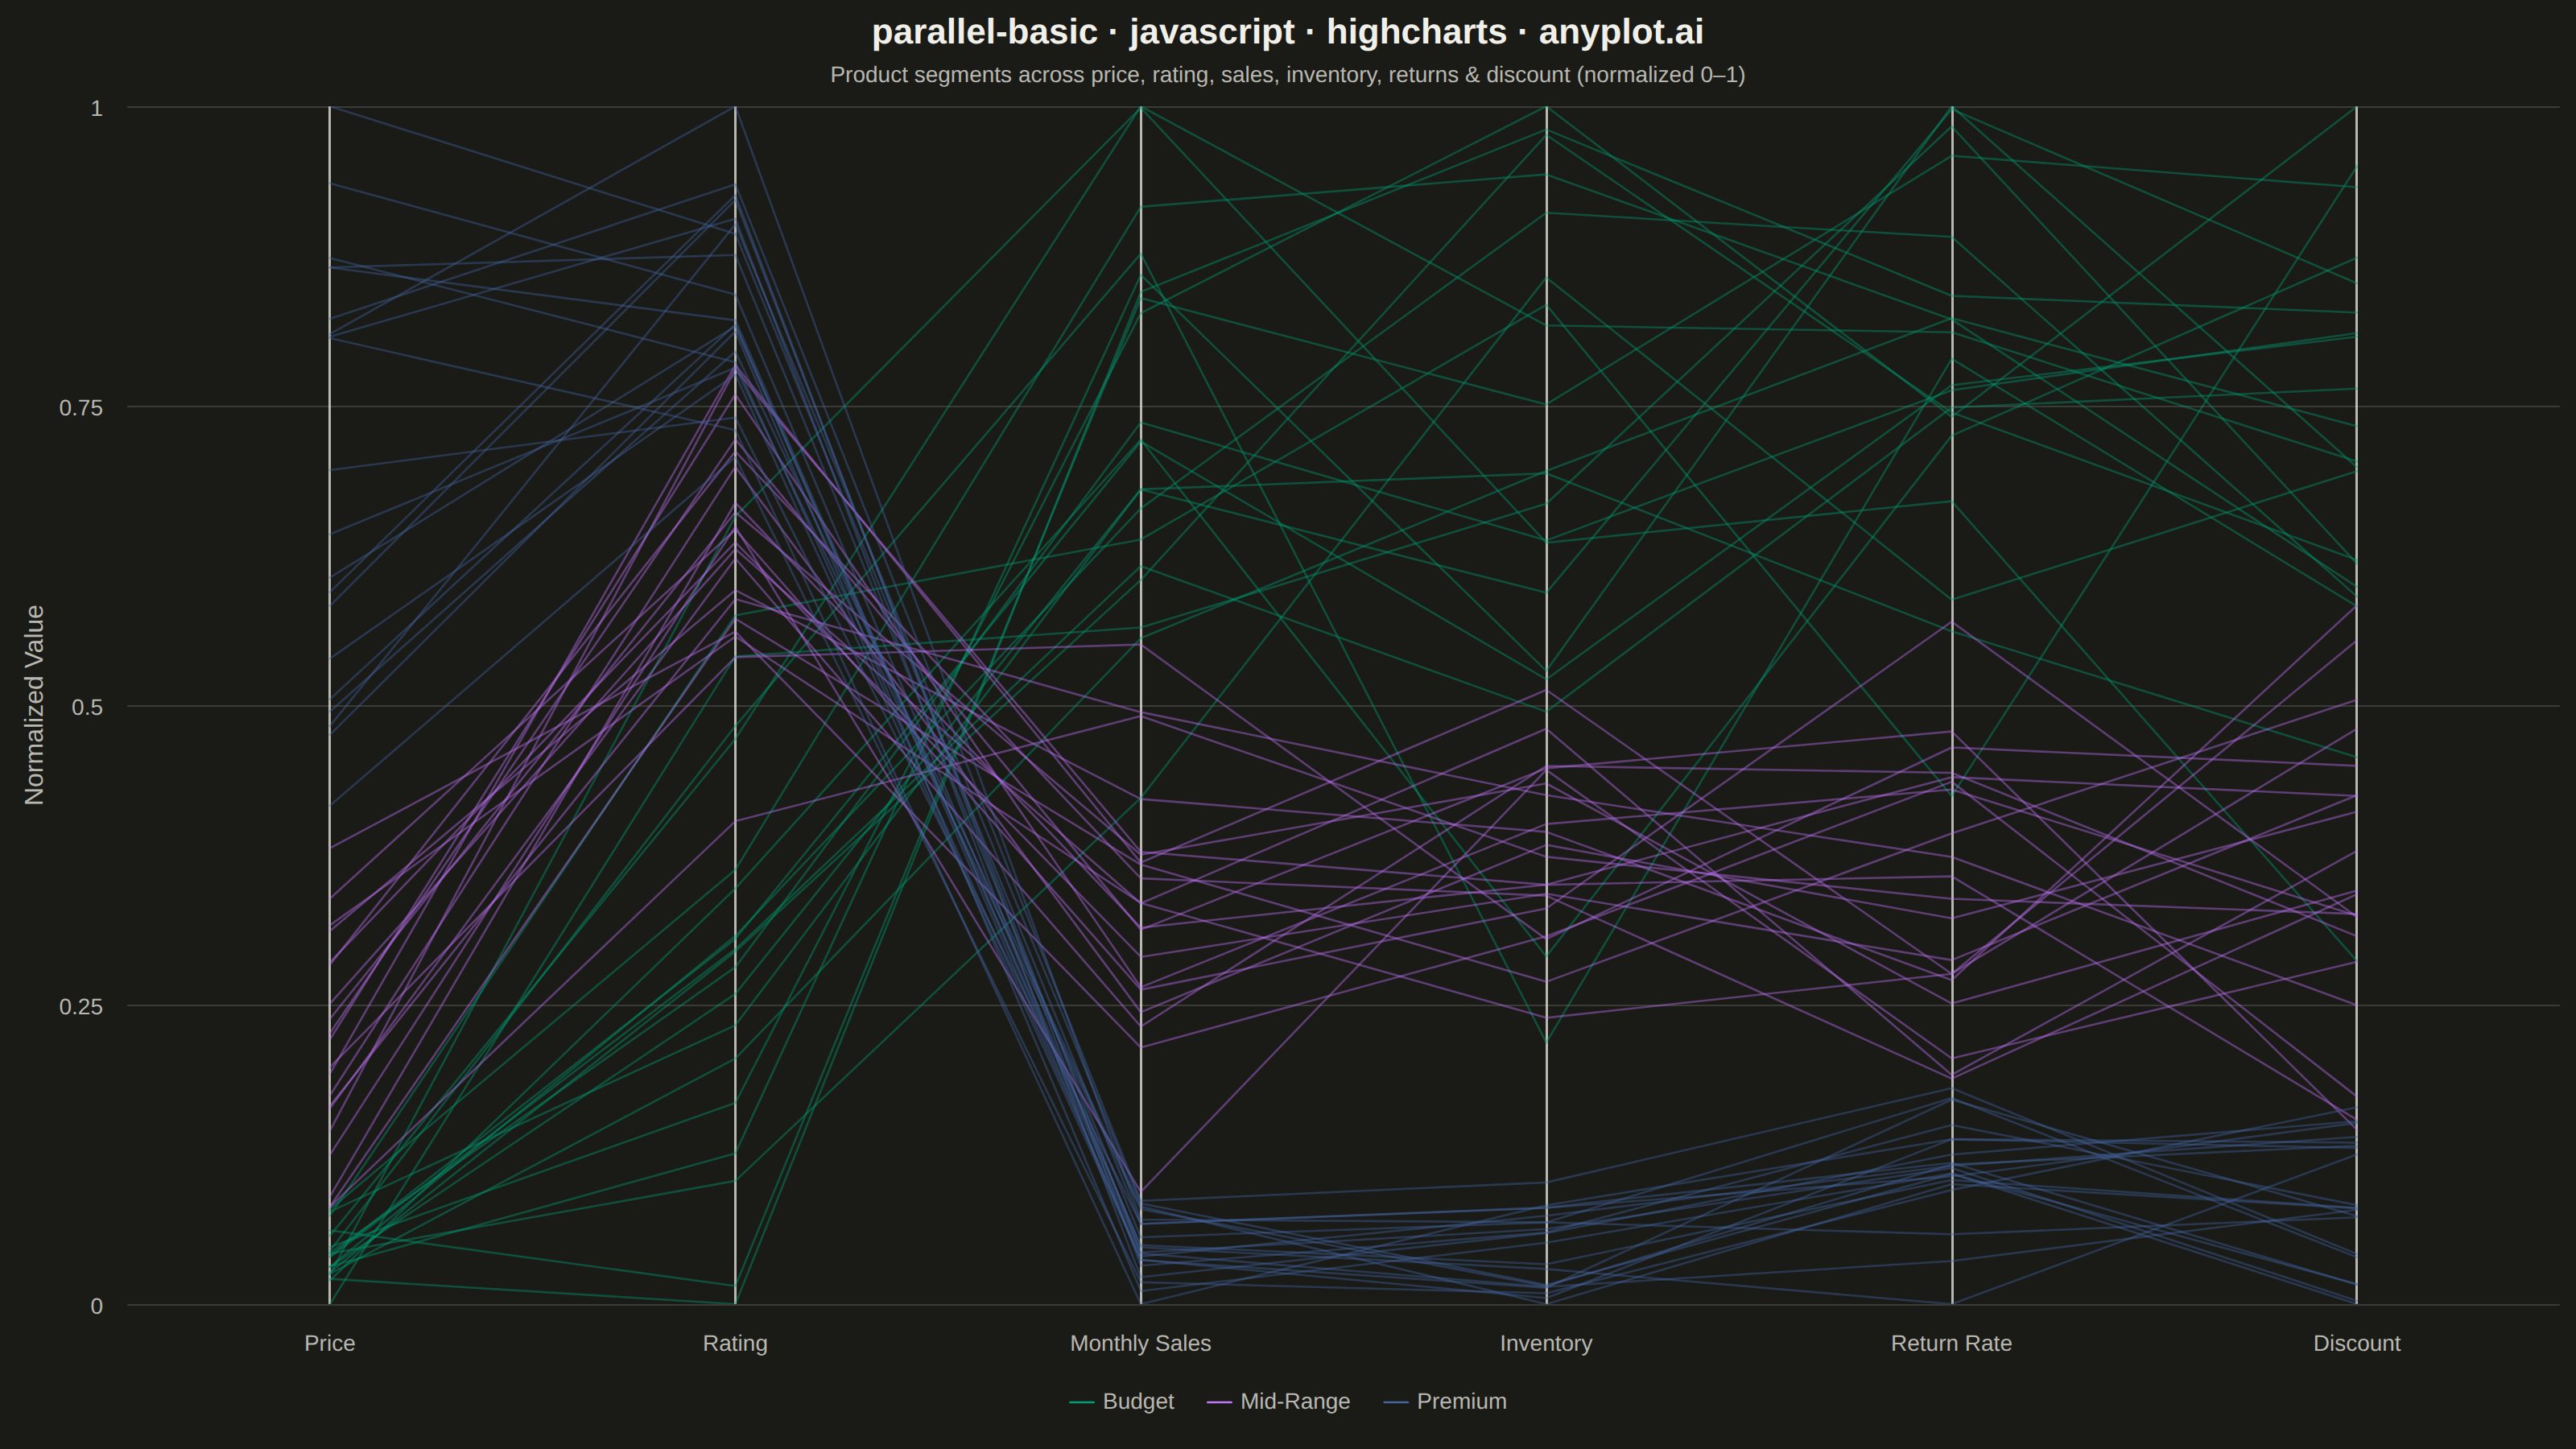
A parallel coordinates plot visualizes multivariate data by representing each variable as a vertical axis and each observation as a line connecting values across all axes. This technique is powerful for identifying patterns, clusters, and outliers in high-dimensional datasets where traditional 2D plots fall short. It enables simultaneous comparison of multiple variables for each data point.
// anyplot.ai
// parallel-basic: Basic Parallel Coordinates Plot
// Library: highcharts 12.6.0 | JavaScript 22.23.1
// Quality: 89/100 | Created: 2026-07-24

const t = window.ANYPLOT_TOKENS;

// --- Data (in-memory, deterministic) ----------------------------------------
// Tiny fixed-seed LCG — the browser has no seeded Math.random().
let seed = 42;
function rand() {
  seed = (seed * 1664525 + 1013904223) % 4294967296;
  return seed / 4294967296;
}
function gaussian(mean, std) {
  const u1 = rand() || 1e-9;
  const u2 = rand();
  const z = Math.sqrt(-2 * Math.log(u1)) * Math.cos(2 * Math.PI * u2);
  return mean + z * std;
}

const dimensions = ["Price", "Rating", "Monthly Sales", "Inventory", "Return Rate", "Discount"];
const formatters = [
  (v) => `$${v.toFixed(0)}`,
  (v) => `${v.toFixed(1)}★`,
  (v) => `${Math.round(v)} units/mo`,
  (v) => `${Math.round(v)} units`,
  (v) => `${v.toFixed(1)}%`,
  (v) => `${v.toFixed(1)}%`,
];

// Product segments — cheaper items sell in higher volume and carry deeper
// stock, while premium items command higher price/rating but move slower.
// Budget items also see more returns and heavier discounting than Premium.
const segments = [
  {
    name: "Budget",
    means: [25, 3.3, 850, 1200, 8, 18],
    stds: [8, 0.4, 200, 300, 2, 5],
  },
  {
    name: "Mid-Range",
    means: [75, 4.0, 420, 600, 4, 9],
    stds: [20, 0.3, 120, 150, 1.2, 3],
  },
  {
    name: "Premium",
    means: [220, 4.6, 95, 150, 1.5, 3],
    stds: [60, 0.25, 35, 50, 0.6, 1.5],
  },
];
const clampMin = [5, 1, 10, 10, 0, 0];
const clampMax = [Infinity, 5, Infinity, Infinity, 100, 100];

const samplesPerSegment = 20;
const products = [];
segments.forEach((seg, segIndex) => {
  for (let i = 0; i < samplesPerSegment; i++) {
    products.push({
      segment: seg.name,
      segIndex,
      values: seg.means.map((m, d) =>
        Math.min(clampMax[d], Math.max(clampMin[d], gaussian(m, seg.stds[d])))
      ),
    });
  }
});

// Min-max normalize each dimension to [0, 1] so all axes share one scale.
const mins = dimensions.map((_, d) => Math.min(...products.map((p) => p.values[d])));
const maxs = dimensions.map((_, d) => Math.max(...products.map((p) => p.values[d])));

// --- Interaction: hover a line (or its legend swatch) to spotlight every
// line in that segment and fade the rest — a lightweight way to trace one
// group's path across all axes despite 60 overlapping observations.
const baseOpacity = 0.4;
const dimmedOpacity = 0.06;
const highlightOpacity = 0.95;

function highlightSegment(chart, name) {
  chart.series.forEach((s) => {
    if (s.graph) s.graph.attr({ opacity: s.name === name ? highlightOpacity : dimmedOpacity });
  });
}

function resetOpacities(chart) {
  chart.series.forEach((s) => {
    if (s.graph) s.graph.attr({ opacity: baseOpacity });
  });
}

function toggleSegmentVisibility(chart, name) {
  const segmentSeries = chart.series.filter((s) => s.name === name);
  const anyVisible = segmentSeries.some((s) => s.visible);
  segmentSeries.forEach((s) => s.setVisible(!anyVisible, false));
  chart.redraw();
}

const seenSegments = new Set();
const lineSeries = products.map((p) => {
  const firstOfSegment = !seenSegments.has(p.segIndex);
  seenSegments.add(p.segIndex);
  return {
    name: p.segment,
    color: t.palette[p.segIndex],
    lineWidth: 1.3,
    opacity: baseOpacity,
    marker: { enabled: false },
    showInLegend: firstOfSegment,
    data: p.values.map((v, d) => ({
      y: (v - mins[d]) / (maxs[d] - mins[d]),
      custom: { real: v },
    })),
    events: {
      mouseOver: function () {
        highlightSegment(this.chart, this.name);
      },
      mouseOut: function () {
        resetOpacities(this.chart);
      },
      legendItemClick: function () {
        toggleSegmentVisibility(this.chart, this.name);
        return false;
      },
    },
  };
});

// --- Chart -------------------------------------------------------------------
Highcharts.chart("container", {
  chart: {
    type: "line",
    backgroundColor: "transparent",
    animation: false,
    style: { fontFamily: "inherit" },
  },
  credits: { enabled: false },
  colors: t.palette,
  title: {
    text: "parallel-basic · javascript · highcharts · anyplot.ai",
    style: { color: t.ink, fontSize: "22px", fontWeight: "600" },
  },
  subtitle: {
    text: "Product segments across price, rating, sales, inventory, returns & discount (normalized 0–1)",
    style: { color: t.inkSoft, fontSize: "14px" },
  },
  xAxis: {
    categories: dimensions,
    tickmarkPlacement: "on",
    lineWidth: 0,
    gridLineWidth: 1.5,
    gridLineColor: t.inkSoft,
    labels: { style: { color: t.inkSoft, fontSize: "14px" } },
  },
  yAxis: {
    min: 0,
    max: 1,
    tickInterval: 0.25,
    title: { text: "Normalized Value", style: { color: t.inkSoft, fontSize: "16px" } },
    labels: { style: { color: t.inkSoft, fontSize: "14px" } },
    gridLineColor: t.grid,
    gridLineWidth: 1,
  },
  legend: {
    itemStyle: { color: t.inkSoft, fontSize: "14px" },
    itemHoverStyle: { color: t.ink },
  },
  tooltip: {
    formatter: function () {
      const dim = dimensions[this.point.index];
      const format = formatters[this.point.index];
      return `<b>${this.series.name}</b><br>${dim}: ${format(this.point.custom.real)}`;
    },
  },
  plotOptions: {
    series: { animation: false, marker: { enabled: false } },
  },
  series: lineSeries,
});
Runnable source as JSON, for any HTTP client: https://api.anyplot.ai/specs/parallel-basic/highcharts/code. Any spec id and library id listed in llms-full.txt fit the same URL shape; every URL below is complete and callable.
{
  "spec_id": "parallel-basic",
  "language": "javascript",
  "library": "highcharts",
  "page": "https://anyplot.ai/parallel-basic/javascript/highcharts",
  "hub": "https://anyplot.ai/parallel-basic",
  "code_json": "https://api.anyplot.ai/specs/parallel-basic/highcharts/code",
  "spec_json": "https://api.anyplot.ai/specs/parallel-basic",
  "render_light_png": "https://storage.googleapis.com/anyplot-images/plots/parallel-basic/javascript/highcharts/plot-light.png",
  "render_dark_png": "https://storage.googleapis.com/anyplot-images/plots/parallel-basic/javascript/highcharts/plot-dark.png",
  "interactive_light_html": "https://storage.googleapis.com/anyplot-images/plots/parallel-basic/javascript/highcharts/plot-light.html",
  "interactive_dark_html": "https://storage.googleapis.com/anyplot-images/plots/parallel-basic/javascript/highcharts/plot-dark.html",
  "quality_score": 89.0,
  "license": "MIT",
  "guide": "https://anyplot.ai/llms.txt"
}
Part of Basic Parallel Coordinates Plot on anyplot.ai.