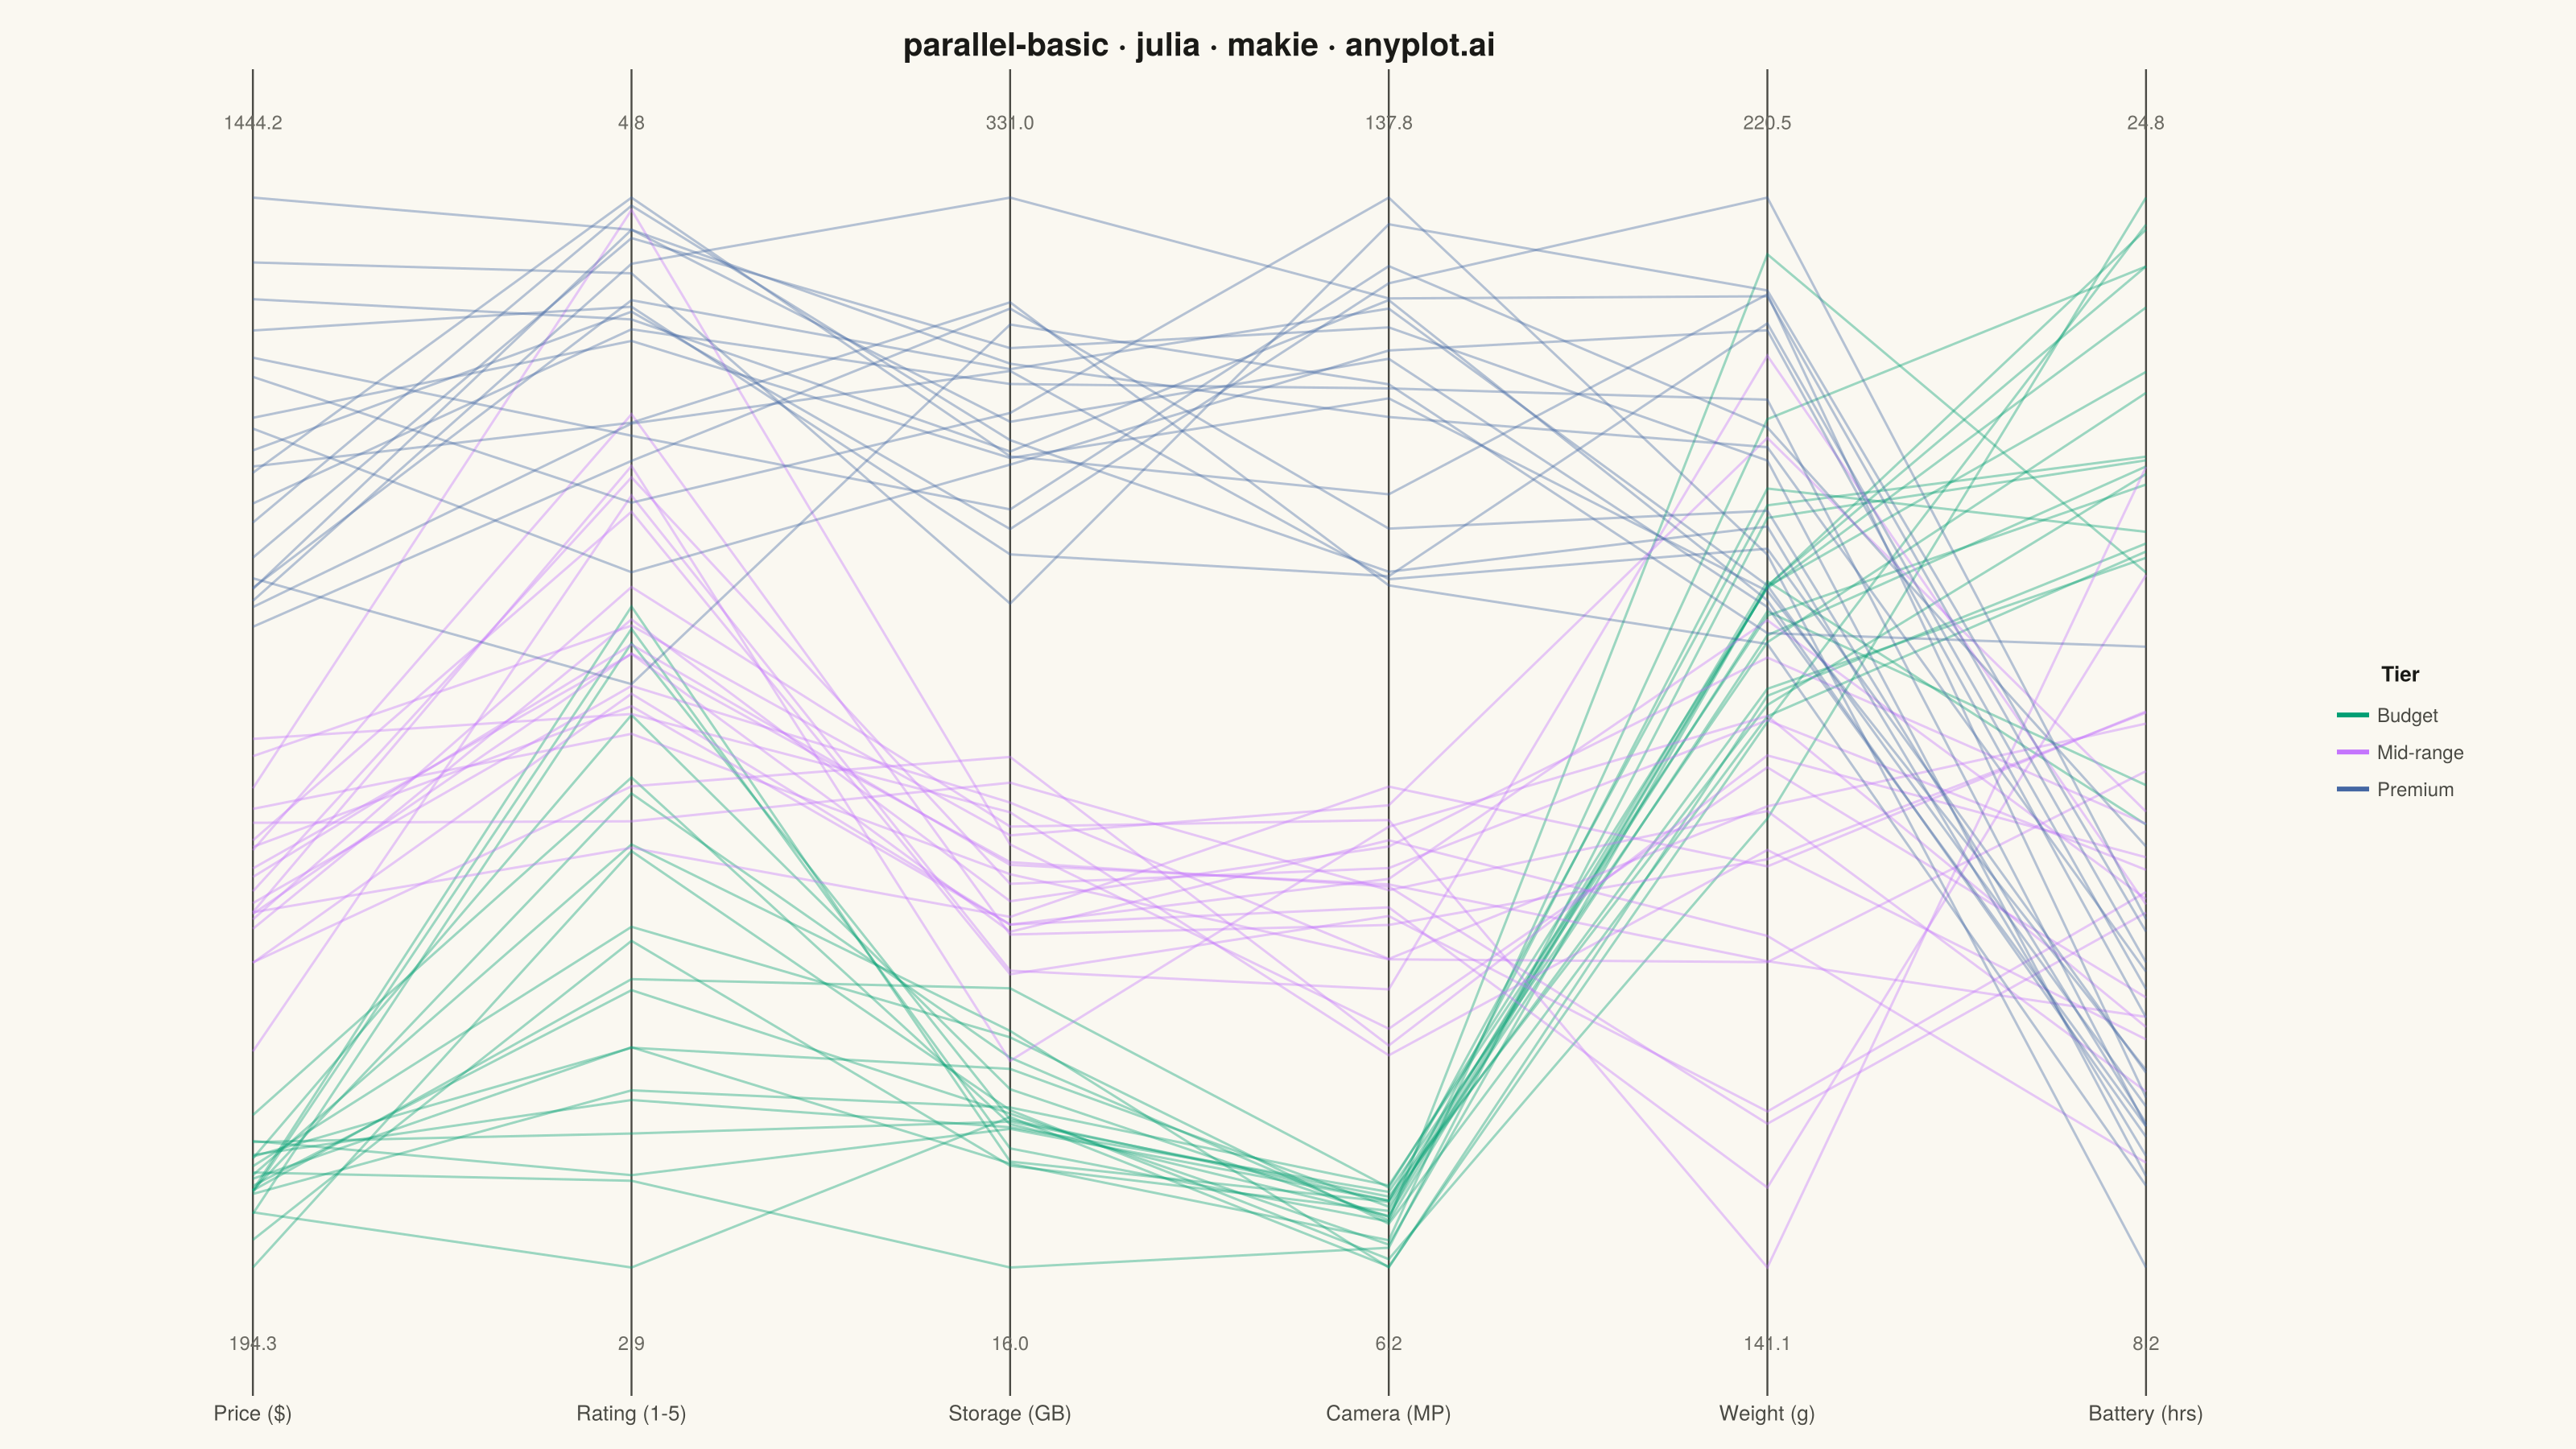
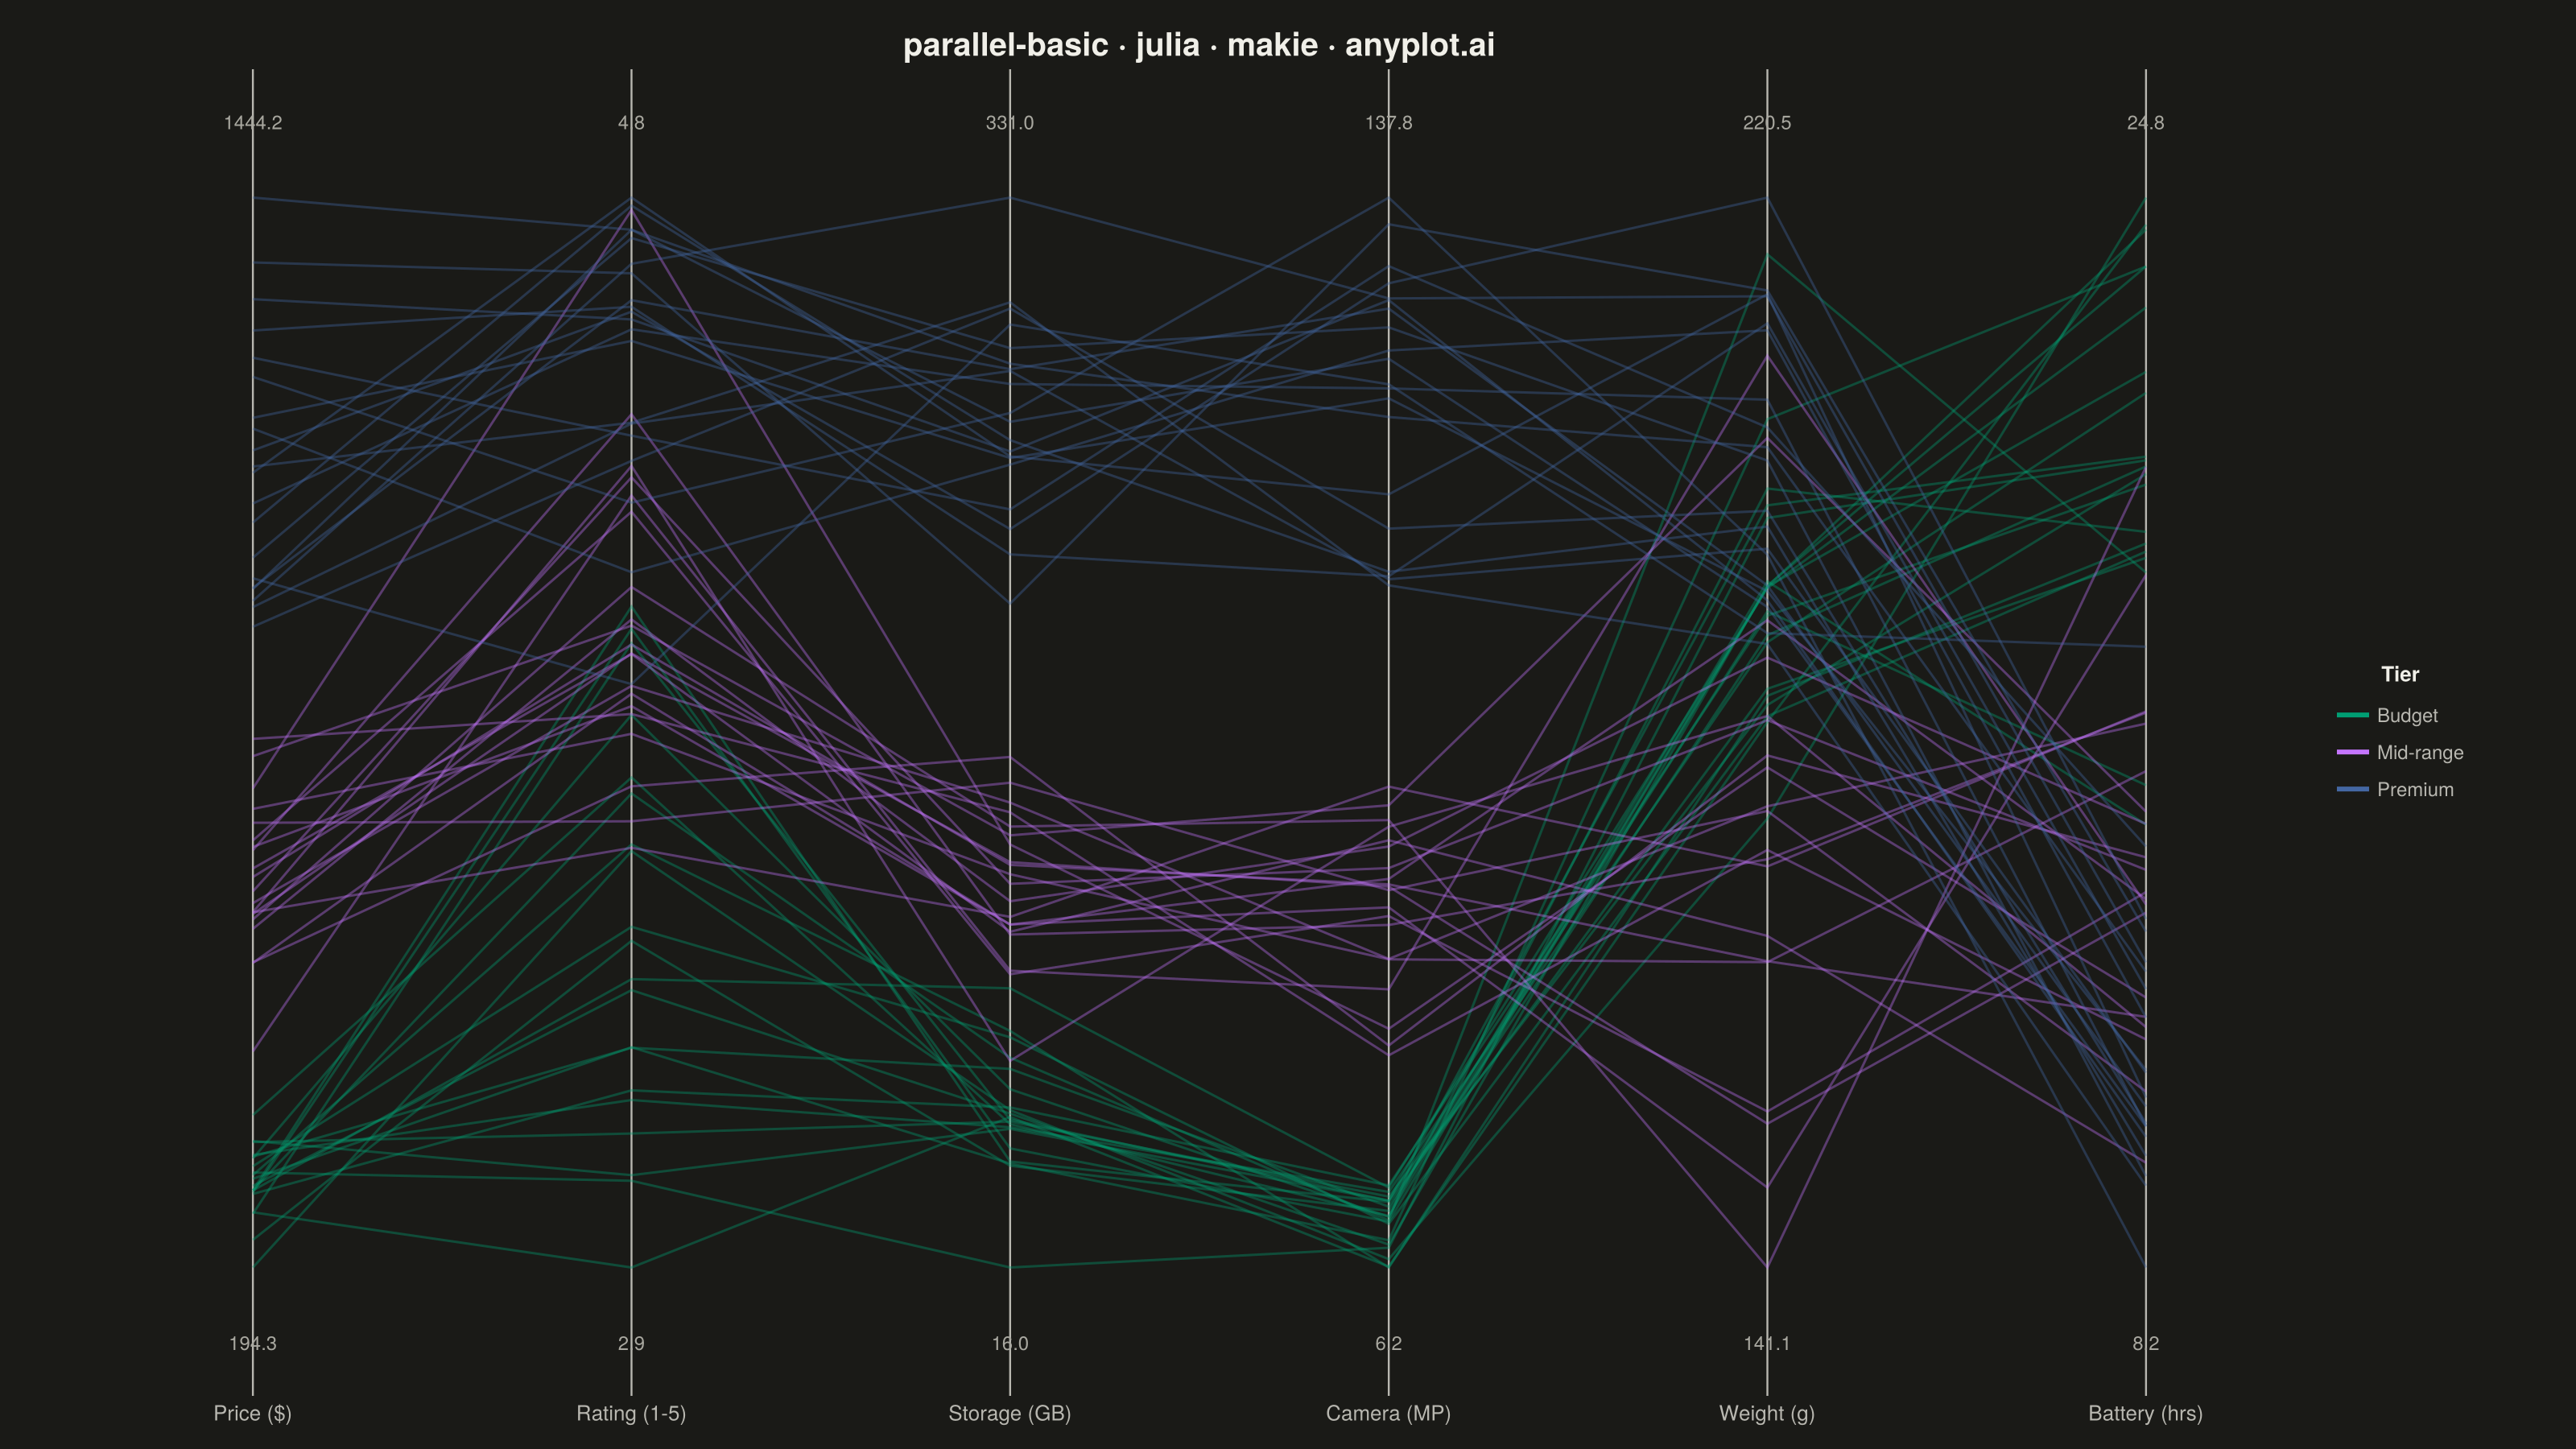
The same plot in 14 other libraries — Python: Altair, Bokeh, lets-plot, Matplotlib, Plotly, plotnine, Pygal, Seaborn; R: ggplot2; JavaScript: Chart.js, D3.js, Apache ECharts, Highcharts, MUI X Charts. Compare all 15 side by side: Basic Parallel Coordinates Plot in Python, R, Julia and JavaScript.
A parallel coordinates plot visualizes multivariate data by representing each variable as a vertical axis and each observation as a line connecting values across all axes. This technique is powerful for identifying patterns, clusters, and outliers in high-dimensional datasets where traditional 2D plots fall short. It enables simultaneous comparison of multiple variables for each data point.
# anyplot.ai
# parallel-basic: Basic Parallel Coordinates Plot
# Library: makie 0.21.9 | Julia 1.11.9
# Quality: 88/100 | Created: 2026-07-24

using CairoMakie
using Colors
using Random

Random.seed!(42)

# Theme tokens
const THEME     = get(ENV, "ANYPLOT_THEME", "light")
const PAGE_BG   = THEME == "light" ? colorant"#FAF8F1" : colorant"#1A1A17"
const INK       = THEME == "light" ? colorant"#1A1A17" : colorant"#F0EFE8"
const INK_SOFT  = THEME == "light" ? colorant"#4A4A44" : colorant"#B8B7B0"
const INK_MUTED = THEME == "light" ? colorant"#6B6A63" : colorant"#A8A79F"

const IMPRINT_PALETTE = [
    colorant"#009E73",  # 1 — brand green, ALWAYS first series (Imprint palette)
    colorant"#C475FD",  # 2 — lavender
    colorant"#4467A3",  # 3 — blue
    colorant"#BD8233",  # 4 — ochre
    colorant"#AE3030",  # 5 — matte red
    colorant"#2ABCCD",  # 6 — cyan
    colorant"#954477",  # 7 — rose
    colorant"#99B314",  # 8 — lime
]

# Data — smartphone specs across three price tiers, six comparison dimensions.
# Axis order groups the four dimensions that move together with price
# (Price, Rating, Storage, Camera) so adjacent axes stay low-crossing, and
# places the two dimensions that buck that trend (Weight, Battery) together
# at the end instead of interleaved among the correlated block.
dimension_names = ["Price (\$)", "Rating (1-5)", "Storage (GB)", "Camera (MP)", "Weight (g)", "Battery (hrs)"]
n_dims = length(dimension_names)
tiers = ["Budget", "Mid-range", "Premium"]
n_per_tier = 20

tier_params = [
    (300.0, 50.0, 3.5, 0.4, 20.0, 3.0, 190.0, 15.0, 64.0, 16.0, 12.0, 3.0),
    (600.0, 80.0, 4.0, 0.3, 15.0, 3.0, 175.0, 12.0, 128.0, 20.0, 48.0, 8.0),
    (1100.0, 120.0, 4.5, 0.25, 12.0, 2.5, 200.0, 10.0, 256.0, 32.0, 108.0, 15.0),
]

price = Float64[]
rating = Float64[]
battery = Float64[]
weight = Float64[]
storage = Float64[]
camera = Float64[]
tier = String[]

for (t, (p_mu, p_sd, r_mu, r_sd, b_mu, b_sd, w_mu, w_sd, s_mu, s_sd, c_mu, c_sd)) in zip(tiers, tier_params)
    append!(price, p_mu .+ p_sd .* randn(n_per_tier))
    append!(rating, clamp.(r_mu .+ r_sd .* randn(n_per_tier), 1.0, 5.0))
    append!(battery, clamp.(b_mu .+ b_sd .* randn(n_per_tier), 4.0, 40.0))
    append!(weight, clamp.(w_mu .+ w_sd .* randn(n_per_tier), 60.0, 400.0))
    append!(storage, clamp.(s_mu .+ s_sd .* randn(n_per_tier), 16.0, 512.0))
    append!(camera, clamp.(c_mu .+ c_sd .* randn(n_per_tier), 5.0, 200.0))
    append!(tier, fill(t, n_per_tier))
end

data = hcat(price, rating, storage, camera, weight, battery)
n_obs = size(data, 1)

# Min-max normalize each dimension to a shared [0, 1] vertical scale
data_min = vec(minimum(data; dims = 1))
data_max = vec(maximum(data; dims = 1))
data_norm = (data .- data_min') ./ (data_max' .- data_min')

tier_color = Dict(tiers[i] => IMPRINT_PALETTE[i] for i in eachindex(tiers))

# Plot
fig = Figure(
    size            = (1600, 900),
    fontsize        = 14,
    backgroundcolor = PAGE_BG,
)

ax = Axis(
    fig[1, 1];
    title               = "parallel-basic · julia · makie · anyplot.ai",
    titlesize           = 20,
    titlecolor          = INK,
    titlefont           = :bold,
    backgroundcolor     = PAGE_BG,
    xticks              = (1:n_dims, dimension_names),
    xticklabelsize      = 13,
    xticklabelcolor     = INK_SOFT,
    xticksvisible       = false,
    yticksvisible       = false,
    yticklabelsvisible  = false,
    ylabelvisible       = false,
    topspinevisible     = false,
    rightspinevisible   = false,
    leftspinevisible    = false,
    bottomspinevisible  = false,
    xgridvisible        = false,
    ygridvisible        = false,
)

ylims!(ax, -0.12, 1.12)
xlims!(ax, 0.6, n_dims + 0.4)

# One vertical reference axis per dimension
vlines!(ax, 1:n_dims; color = INK_SOFT, linewidth = 1.2)

# One connecting line per observation, colored by tier, drawn brand-first
for t in tiers
    idx = findall(==(t), tier)
    for i in idx
        lines!(ax, 1:n_dims, data_norm[i, :]; color = (tier_color[t], 0.38), linewidth = 1.5)
    end
end

# Original min/max labels at each axis end — the normalized scale alone hides units
for j in 1:n_dims
    text!(ax, j, 1.06; text = string(round(data_max[j]; digits = 1)),
          align = (:center, :bottom), fontsize = 12, color = INK_MUTED)
    text!(ax, j, -0.06; text = string(round(data_min[j]; digits = 1)),
          align = (:center, :top), fontsize = 12, color = INK_MUTED)
end

# Legend
Legend(
    fig[1, 2],
    [LineElement(color = tier_color[t], linewidth = 3) for t in tiers],
    tiers,
    "Tier";
    backgroundcolor = PAGE_BG,
    framevisible     = false,
    labelcolor       = INK_SOFT,
    labelsize        = 12,
    titlecolor       = INK,
    titlesize        = 13,
)

colsize!(fig.layout, 1, Relative(0.88))

# Save
save("plot-$(THEME).png", fig; px_per_unit = 2)
Runnable source as JSON, for any HTTP client: https://api.anyplot.ai/specs/parallel-basic/makie/code. Any spec id and library id listed in llms-full.txt fit the same URL shape; every URL below is complete and callable.
{
  "spec_id": "parallel-basic",
  "language": "julia",
  "library": "makie",
  "page": "https://anyplot.ai/parallel-basic/julia/makie",
  "hub": "https://anyplot.ai/parallel-basic",
  "code_json": "https://api.anyplot.ai/specs/parallel-basic/makie/code",
  "spec_json": "https://api.anyplot.ai/specs/parallel-basic",
  "render_light_png": "https://storage.googleapis.com/anyplot-images/plots/parallel-basic/julia/makie/plot-light.png",
  "render_dark_png": "https://storage.googleapis.com/anyplot-images/plots/parallel-basic/julia/makie/plot-dark.png",
  "quality_score": 88.0,
  "license": "MIT",
  "guide": "https://anyplot.ai/llms.txt"
}
Part of Basic Parallel Coordinates Plot on anyplot.ai.