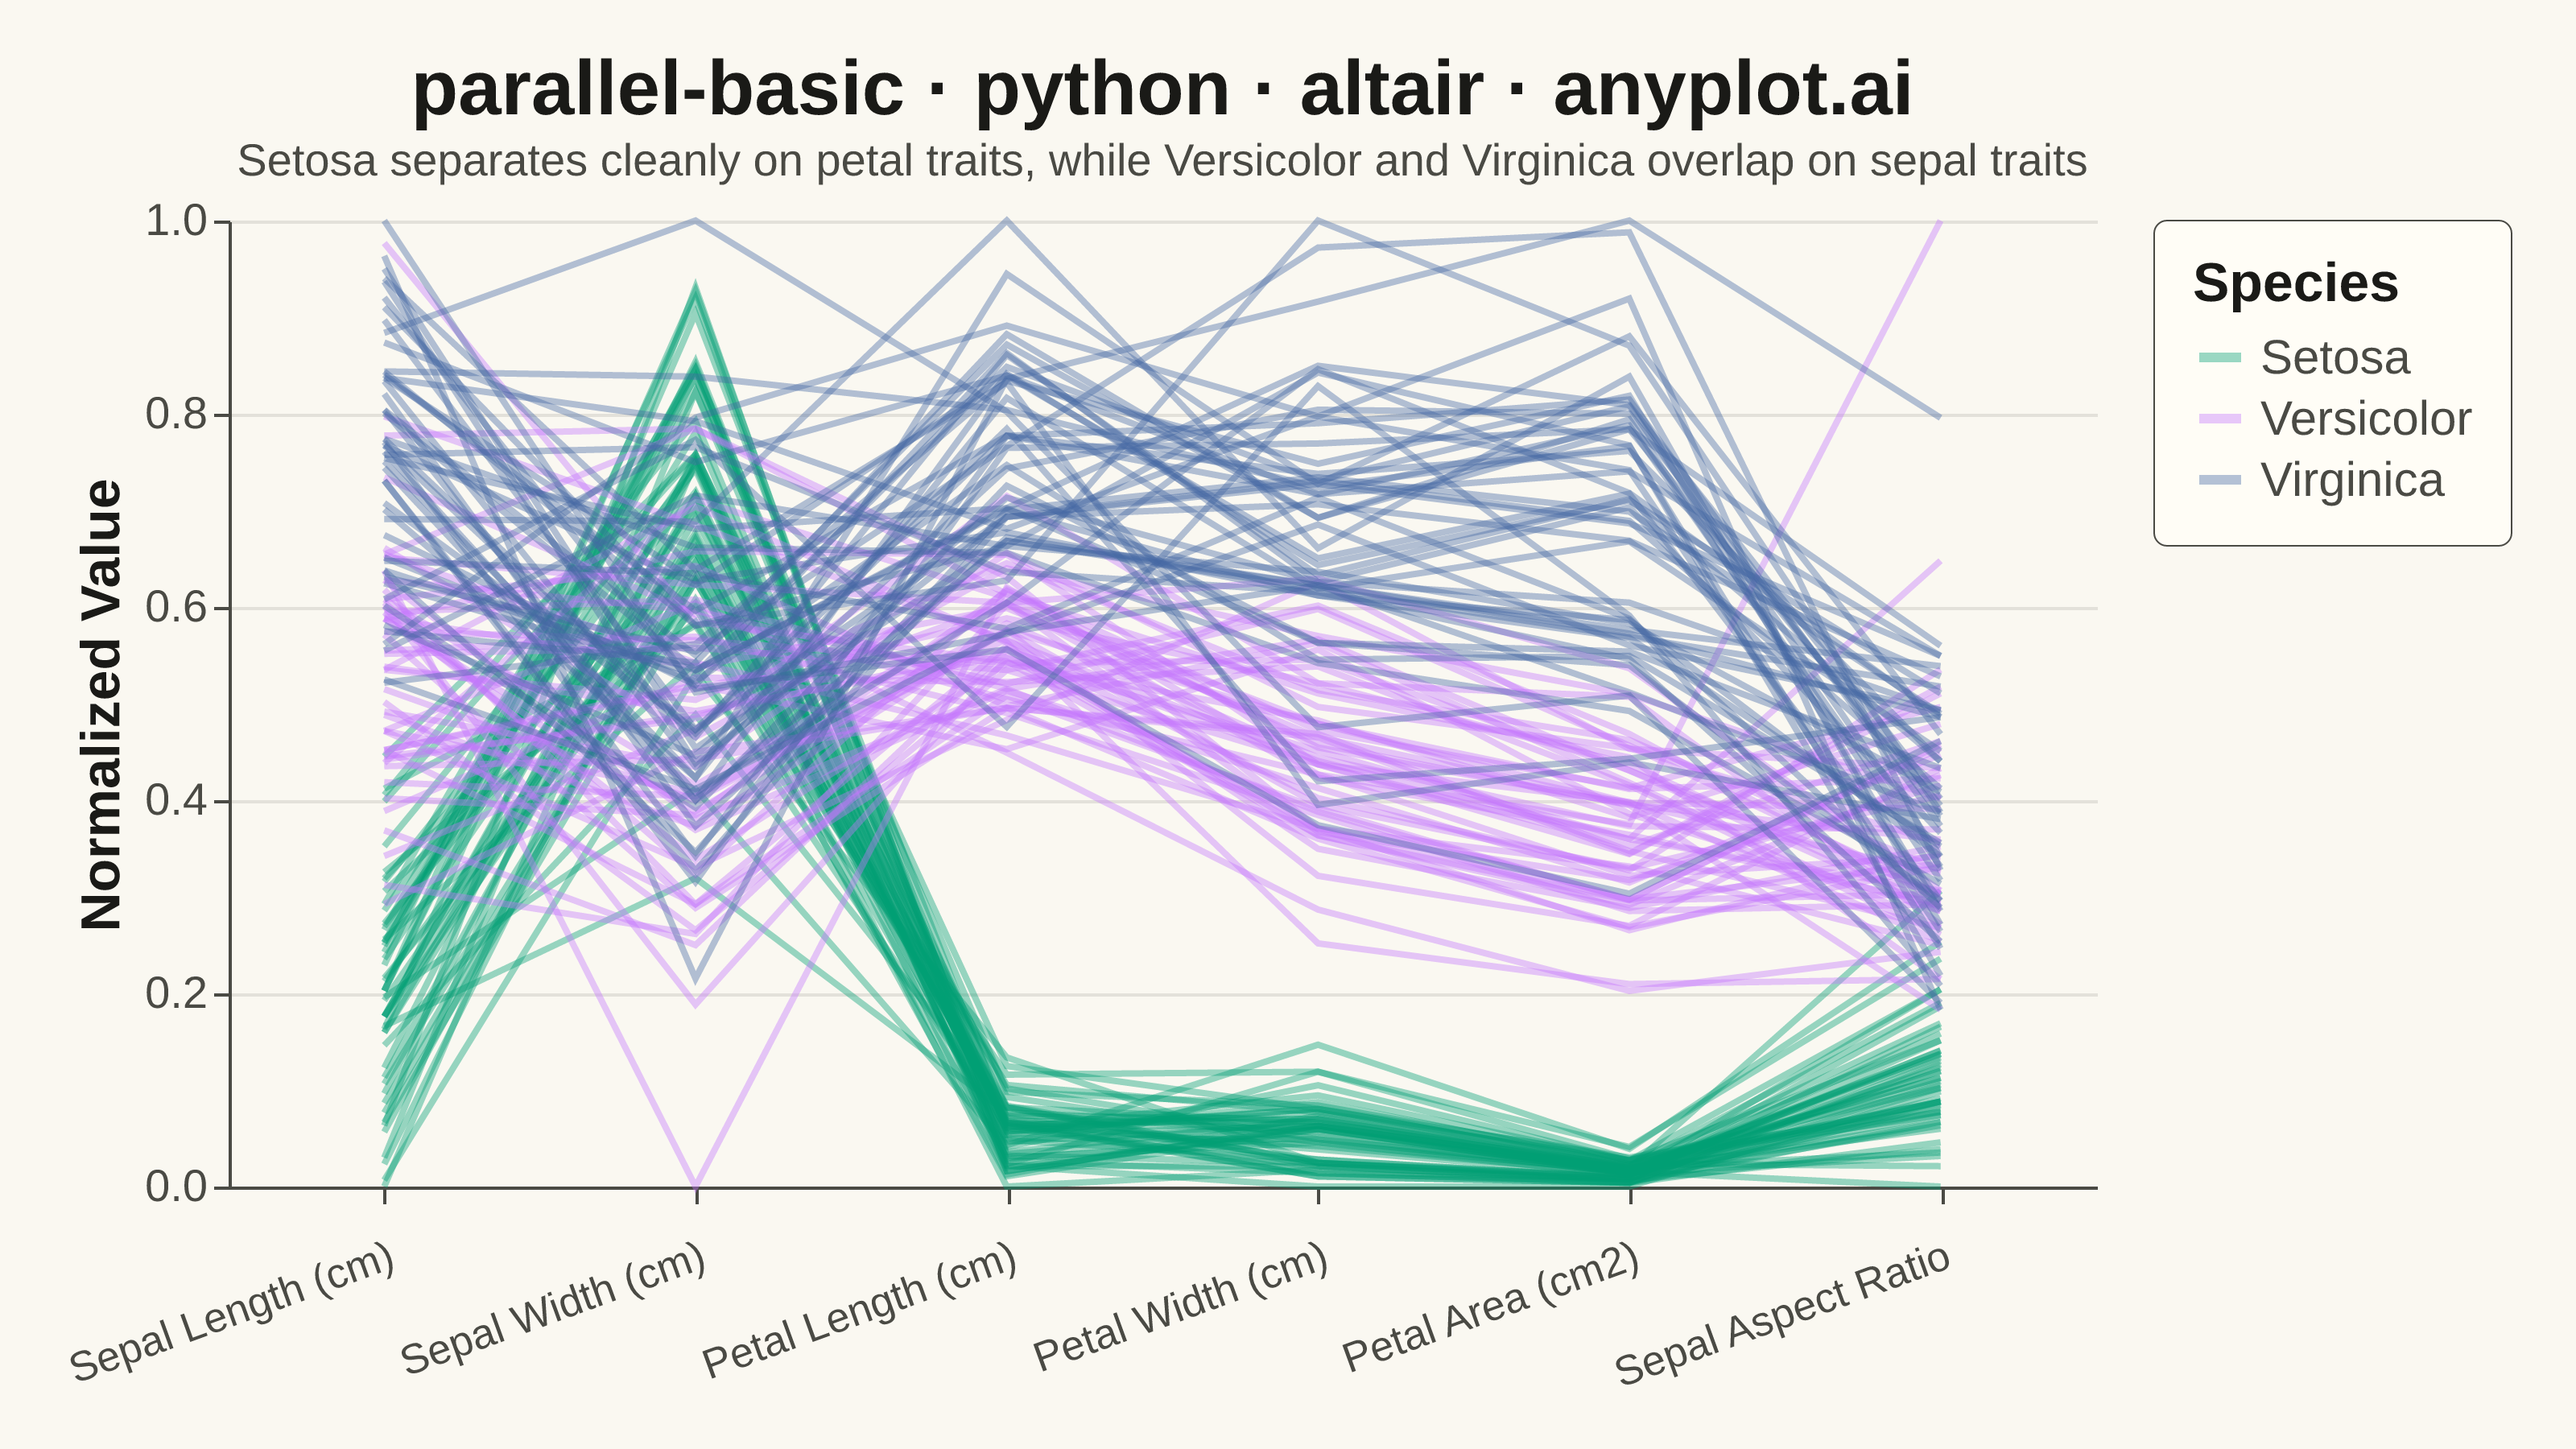
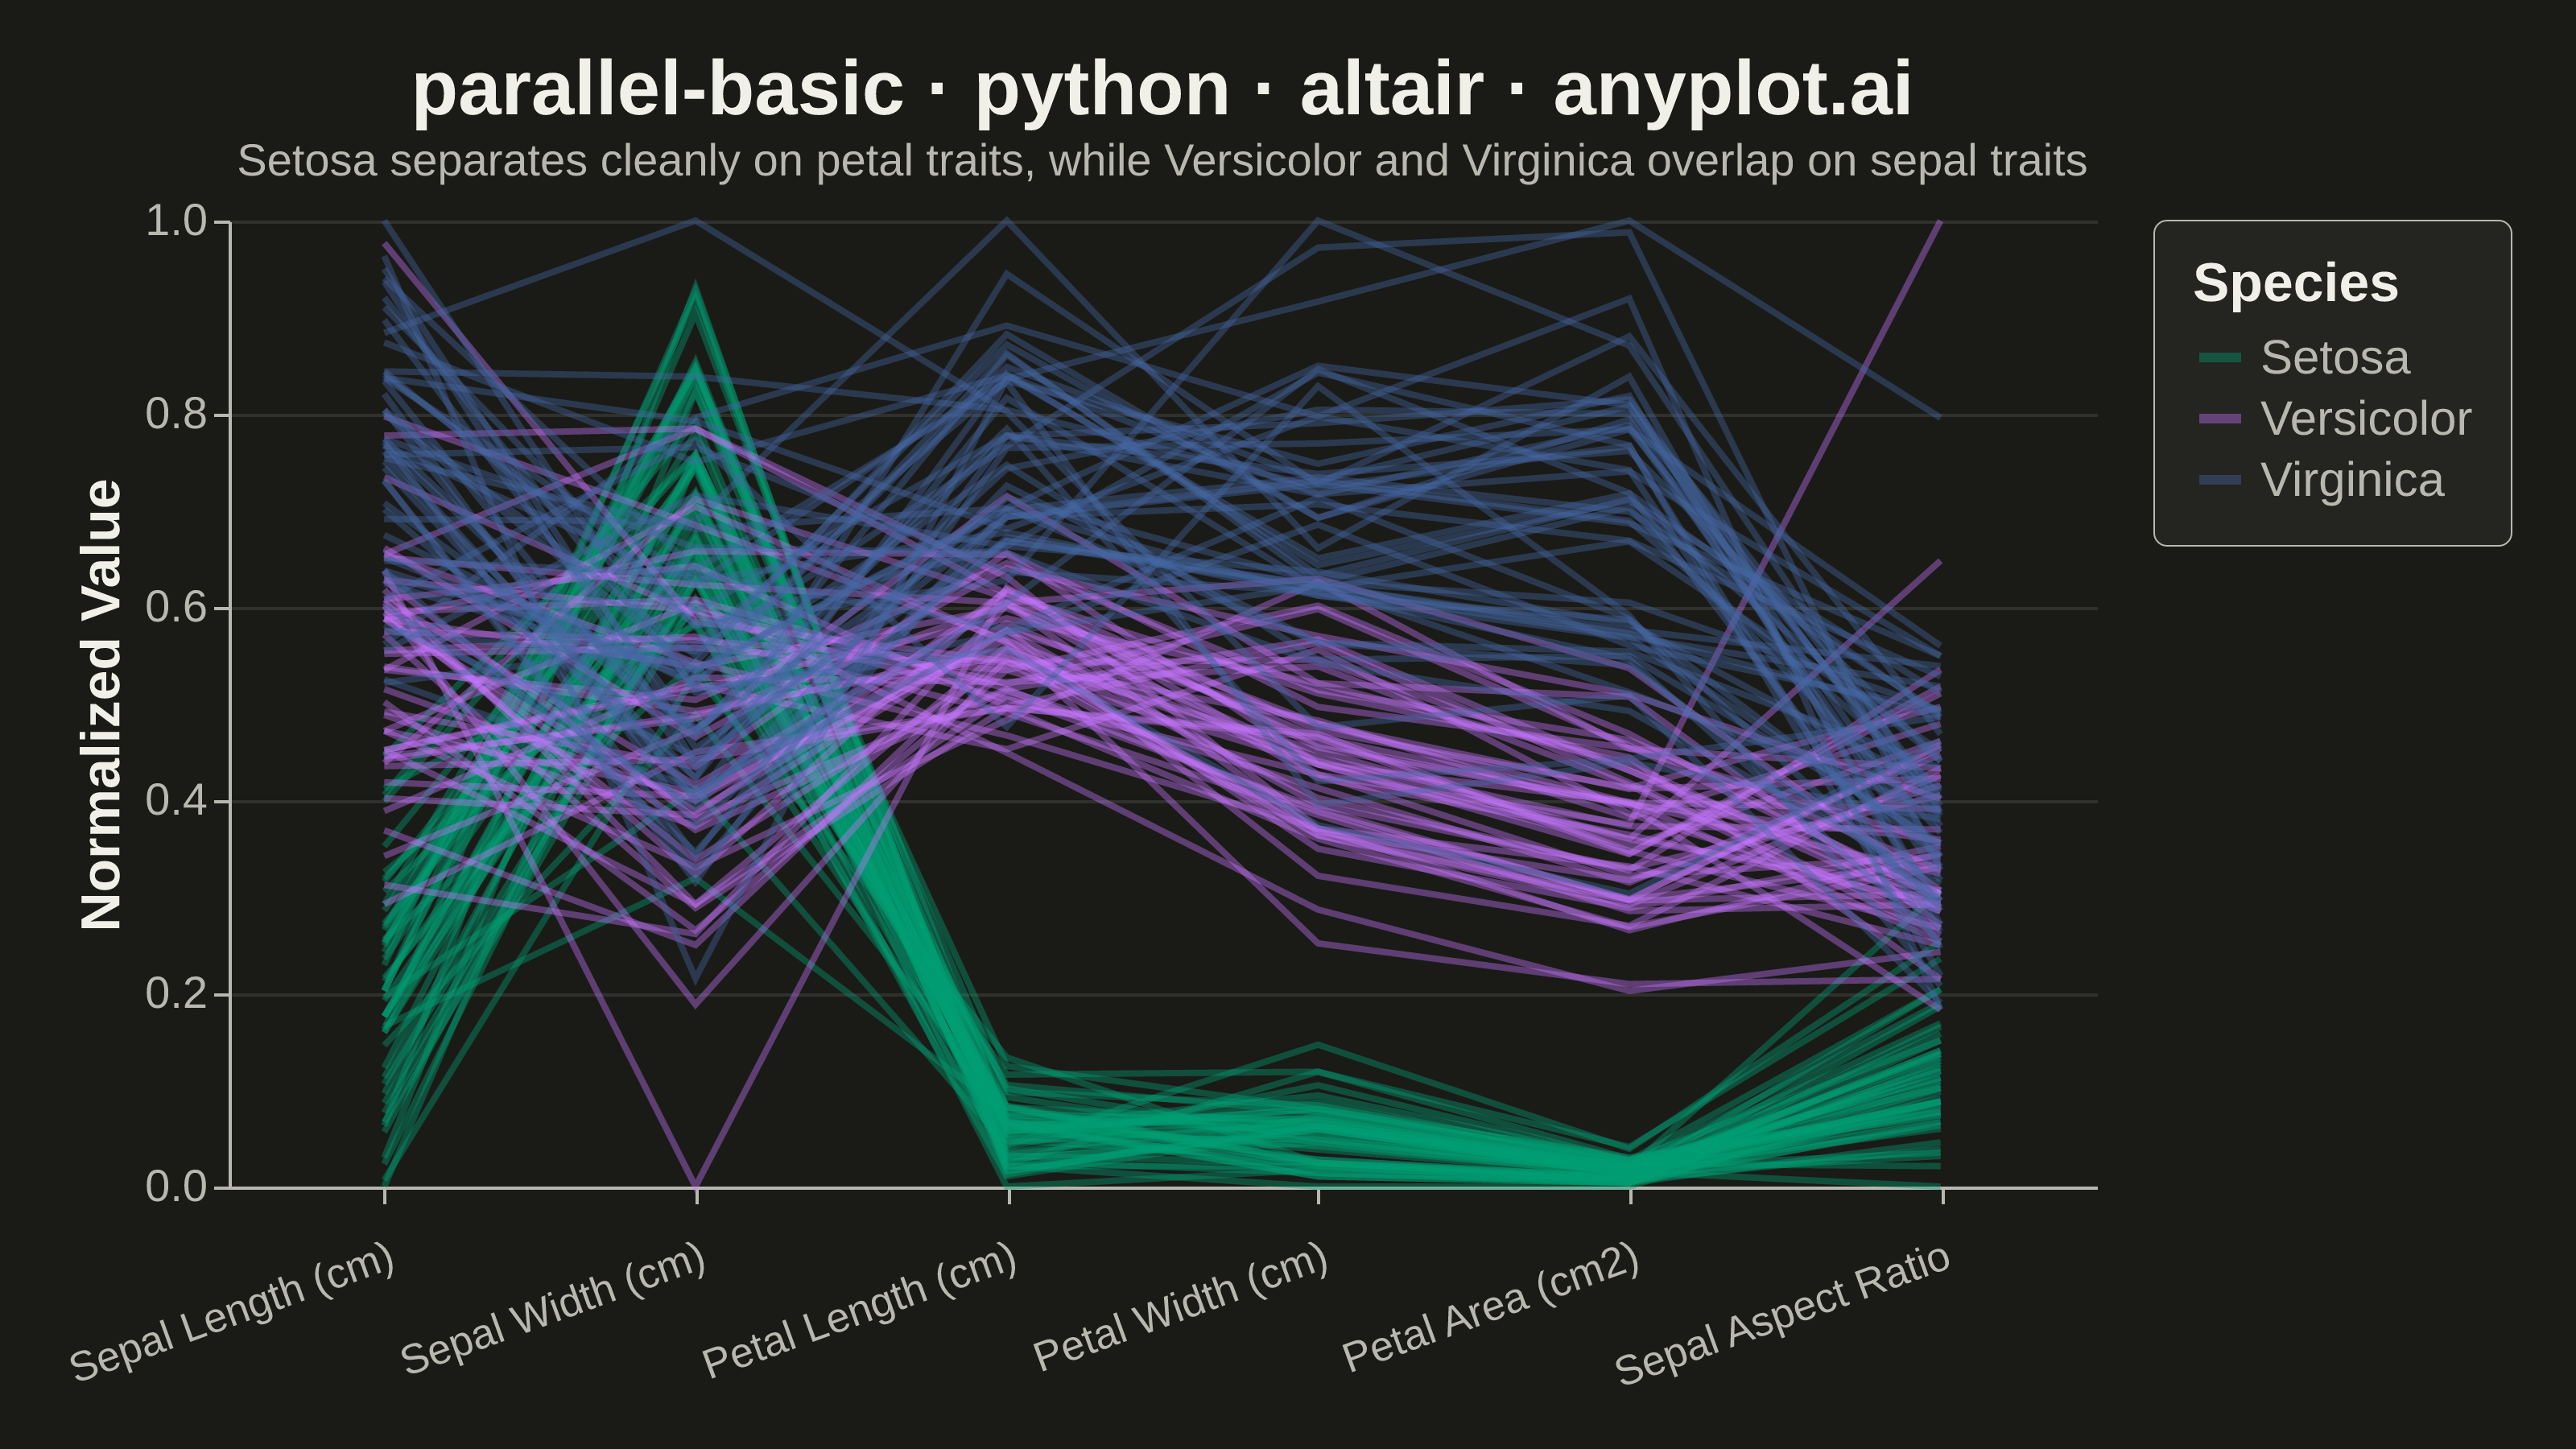
A parallel coordinates plot visualizes multivariate data by representing each variable as a vertical axis and each observation as a line connecting values across all axes. This technique is powerful for identifying patterns, clusters, and outliers in high-dimensional datasets where traditional 2D plots fall short. It enables simultaneous comparison of multiple variables for each data point.
""" anyplot.ai
parallel-basic: Basic Parallel Coordinates Plot
Library: altair 6.2.2 | Python 3.13.14
Quality: 90/100 | Updated: 2026-07-24
"""

import importlib
import os
import sys

from PIL import Image


# This file is named 'altair.py'. Remove the script directory (and '') from sys.path
# before loading the altair library to prevent this file from being imported as altair.
_script_dir = os.path.dirname(os.path.abspath(__file__))
sys.path = [p for p in sys.path if p not in ("", _script_dir)]

alt = importlib.import_module("altair")
np = importlib.import_module("numpy")
pd = importlib.import_module("pandas")

# Theme tokens
THEME = os.getenv("ANYPLOT_THEME", "light")
PAGE_BG = "#FAF8F1" if THEME == "light" else "#1A1A17"
ELEVATED_BG = "#FFFDF6" if THEME == "light" else "#242420"
INK = "#1A1A17" if THEME == "light" else "#F0EFE8"
INK_SOFT = "#4A4A44" if THEME == "light" else "#B8B7B0"

IMPRINT = ["#009E73", "#C475FD", "#4467A3"]

# Data - Iris-like dataset with 4 dimensions and 3 species
np.random.seed(42)

n_per_species = 50
species_names = ["Setosa", "Versicolor", "Virginica"]
dimensions = [
    "Sepal Length (cm)",
    "Sepal Width (cm)",
    "Petal Length (cm)",
    "Petal Width (cm)",
    "Petal Area (cm2)",
    "Sepal Aspect Ratio",
]

data = []
for i, sp in enumerate(species_names):
    sepal_length = np.random.normal([5.0, 5.9, 6.6][i], 0.35, n_per_species)
    sepal_width = np.random.normal([3.4, 2.8, 3.0][i], 0.38, n_per_species)
    petal_length = np.random.normal([1.5, 4.3, 5.5][i], 0.17 + i * 0.25, n_per_species)
    petal_width = np.random.normal([0.2, 1.3, 2.0][i], 0.1 + i * 0.15, n_per_species)
    petal_area = petal_length * petal_width
    sepal_aspect_ratio = sepal_length / sepal_width
    for j in range(n_per_species):
        data.append(
            {
                "Species": sp,
                "Sepal Length (cm)": round(sepal_length[j], 2),
                "Sepal Width (cm)": round(sepal_width[j], 2),
                "Petal Length (cm)": round(petal_length[j], 2),
                "Petal Width (cm)": round(petal_width[j], 2),
                "Petal Area (cm2)": round(petal_area[j], 2),
                "Sepal Aspect Ratio": round(sepal_aspect_ratio[j], 2),
                "id": i * n_per_species + j,
            }
        )

df = pd.DataFrame(data)

# Normalize values to 0-1 range for fair comparison across axes
for dim in dimensions:
    min_val = df[dim].min()
    max_val = df[dim].max()
    df[f"{dim}_norm"] = (df[dim] - min_val) / (max_val - min_val)

# Long format retaining original values for tooltips
df_long = df.melt(
    id_vars=["id", "Species"] + dimensions,
    value_vars=[f"{d}_norm" for d in dimensions],
    var_name="Dimension",
    value_name="Normalized Value",
)
df_long["Dimension"] = df_long["Dimension"].str.replace("_norm", "")

# Interactive selection: click a species in the legend to highlight/dim
species_select = alt.selection_point(fields=["Species"], bind="legend", empty=True)

# Plot
spec = (
    alt.Chart(df_long)
    .mark_line(strokeWidth=2.0)
    .encode(
        x=alt.X(
            "Dimension:N",
            sort=dimensions,
            axis=alt.Axis(labelAngle=-20, labelFontSize=13, titleFontSize=17, title=None, labelPadding=10),
        ),
        y=alt.Y(
            "Normalized Value:Q",
            scale=alt.Scale(domain=[0, 1]),
            axis=alt.Axis(labelFontSize=14, titleFontSize=17, title="Normalized Value", tickCount=5),
        ),
        detail="id:N",
        color=alt.Color(
            "Species:N",
            scale=alt.Scale(domain=species_names, range=IMPRINT),
            legend=alt.Legend(
                title="Species",
                titleFontSize=17,
                labelFontSize=15,
                symbolSize=170,
                symbolStrokeWidth=3,
                orient="right",
                padding=12,
                labelLimit=200,
            ),
        ),
        opacity=alt.condition(species_select, alt.value(0.40), alt.value(0.06)),
        tooltip=[
            alt.Tooltip("Species:N"),
            alt.Tooltip("Sepal Length (cm):Q", format=".2f"),
            alt.Tooltip("Sepal Width (cm):Q", format=".2f"),
            alt.Tooltip("Petal Length (cm):Q", format=".2f"),
            alt.Tooltip("Petal Width (cm):Q", format=".2f"),
            alt.Tooltip("Petal Area (cm2):Q", format=".2f"),
            alt.Tooltip("Sepal Aspect Ratio:Q", format=".2f"),
        ],
    )
    .properties(
        width=580,
        height=300,
        background=PAGE_BG,
        title=alt.Title(
            "parallel-basic · python · altair · anyplot.ai",
            subtitle="Setosa separates cleanly on petal traits, while Versicolor and Virginica overlap on sepal traits",
            fontSize=24,
            subtitleFontSize=14,
            subtitleColor=INK_SOFT,
            anchor="middle",
        ),
    )
    .add_params(species_select)
)

chart = (
    spec.configure_view(fill=PAGE_BG, strokeWidth=0)
    .configure_axis(
        domainColor=INK_SOFT, tickColor=INK_SOFT, gridColor=INK, gridOpacity=0.10, labelColor=INK_SOFT, titleColor=INK
    )
    .configure_title(color=INK)
    .configure_legend(
        fillColor=ELEVATED_BG,
        strokeColor=INK_SOFT,
        strokeWidth=0.5,
        cornerRadius=4,
        labelColor=INK_SOFT,
        titleColor=INK,
    )
)

# Save
chart.save(f"plot-{THEME}.png", scale_factor=4.0)

# PAD-only to canonical target (do NOT crop — cropping clips title/axis labels)
TW, TH = 3200, 1800
_img = Image.open(f"plot-{THEME}.png").convert("RGB")
_w, _h = _img.size
if _w > TW or _h > TH:
    raise SystemExit(
        f"altair vl-convert produced {_w}x{_h}, exceeds target {TW}x{TH}. "
        f"Shrink chart .properties(width=, height=) values and re-render."
    )
if _w < TW or _h < TH:
    _canvas = Image.new("RGB", (TW, TH), PAGE_BG)
    _canvas.paste(_img, ((TW - _w) // 2, (TH - _h) // 2))
    _canvas.save(f"plot-{THEME}.png")

chart.save(f"plot-{THEME}.html")
Runnable source as JSON, for any HTTP client: https://api.anyplot.ai/specs/parallel-basic/altair/code. Any spec id and library id listed in llms-full.txt fit the same URL shape; every URL below is complete and callable.
{
  "spec_id": "parallel-basic",
  "language": "python",
  "library": "altair",
  "page": "https://anyplot.ai/parallel-basic/python/altair",
  "hub": "https://anyplot.ai/parallel-basic",
  "code_json": "https://api.anyplot.ai/specs/parallel-basic/altair/code",
  "spec_json": "https://api.anyplot.ai/specs/parallel-basic",
  "render_light_png": "https://storage.googleapis.com/anyplot-images/plots/parallel-basic/python/altair/plot-light.png",
  "render_dark_png": "https://storage.googleapis.com/anyplot-images/plots/parallel-basic/python/altair/plot-dark.png",
  "interactive_light_html": "https://storage.googleapis.com/anyplot-images/plots/parallel-basic/python/altair/plot-light.html",
  "interactive_dark_html": "https://storage.googleapis.com/anyplot-images/plots/parallel-basic/python/altair/plot-dark.html",
  "quality_score": 90.0,
  "license": "MIT",
  "guide": "https://anyplot.ai/llms.txt"
}
Part of Basic Parallel Coordinates Plot on anyplot.ai.