The same plot in 14 other libraries — JavaScript: Chart.js, D3.js, Highcharts, MUI X Charts; Python: Altair, Bokeh, lets-plot, Matplotlib, Plotly, plotnine, Pygal, Seaborn; R: ggplot2; Julia: Makie.jl. Compare all 15 side by side: Basic Parallel Coordinates Plot in Python, R, Julia and JavaScript.
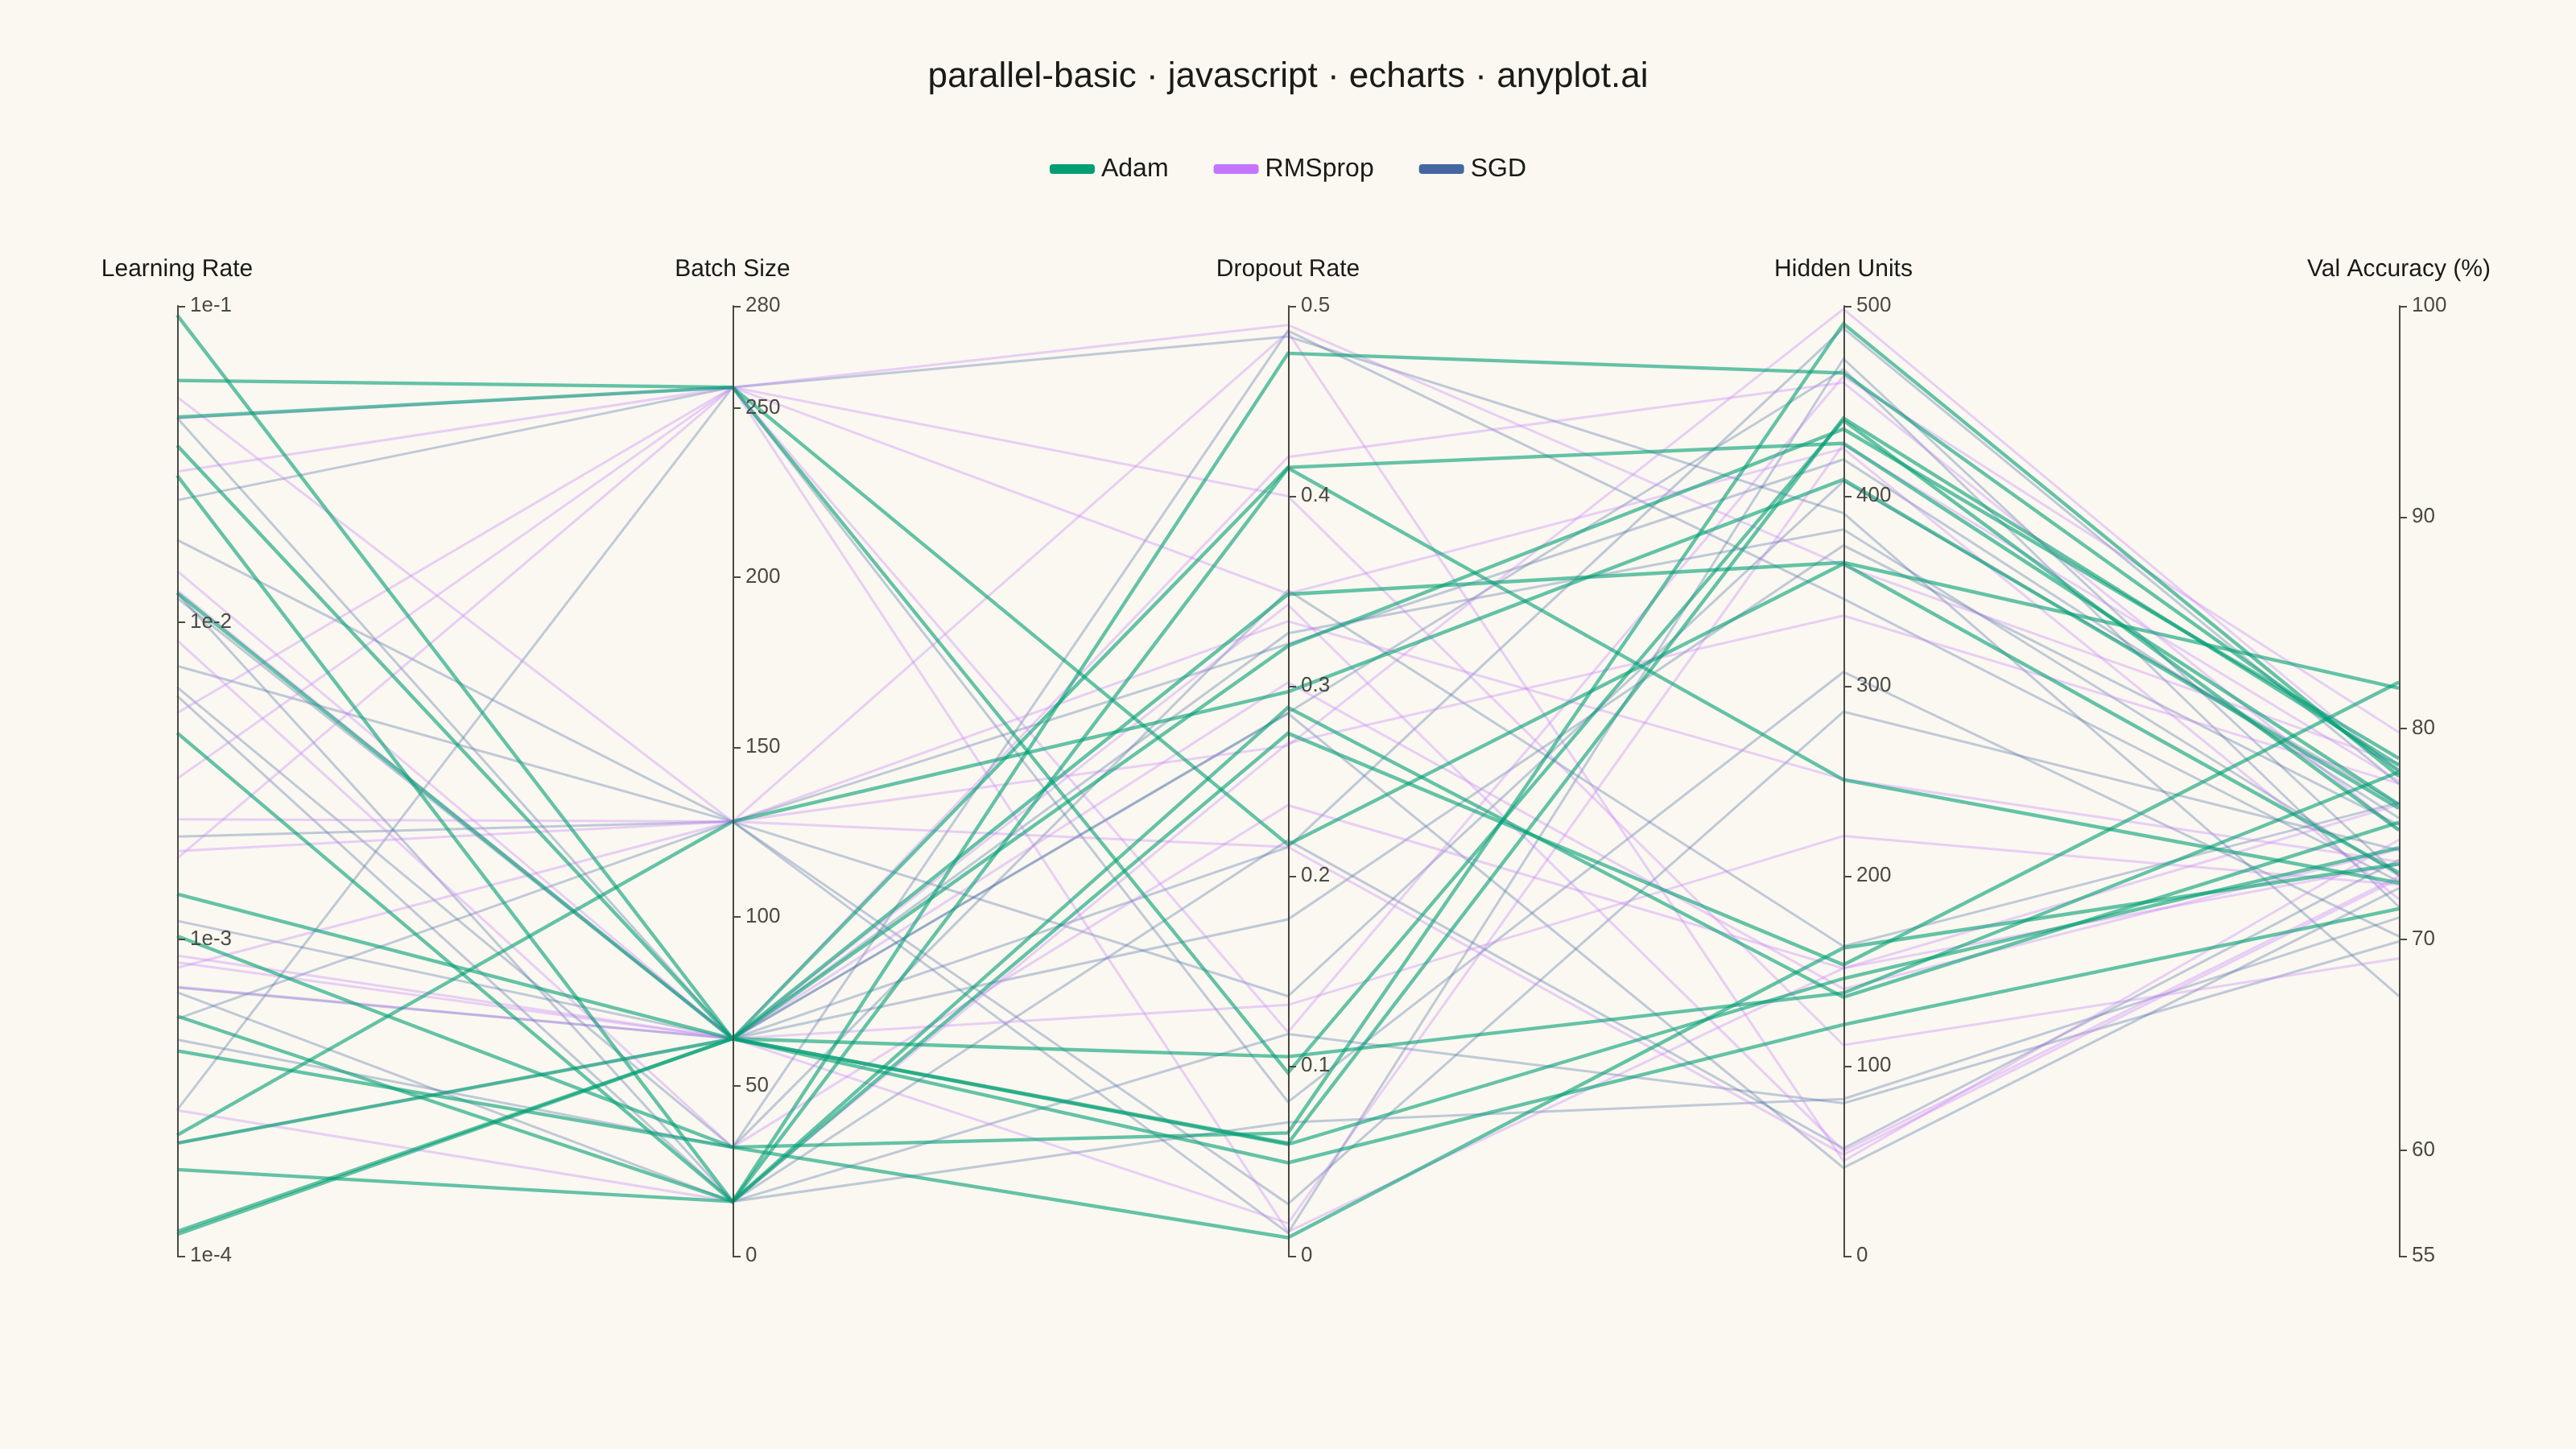
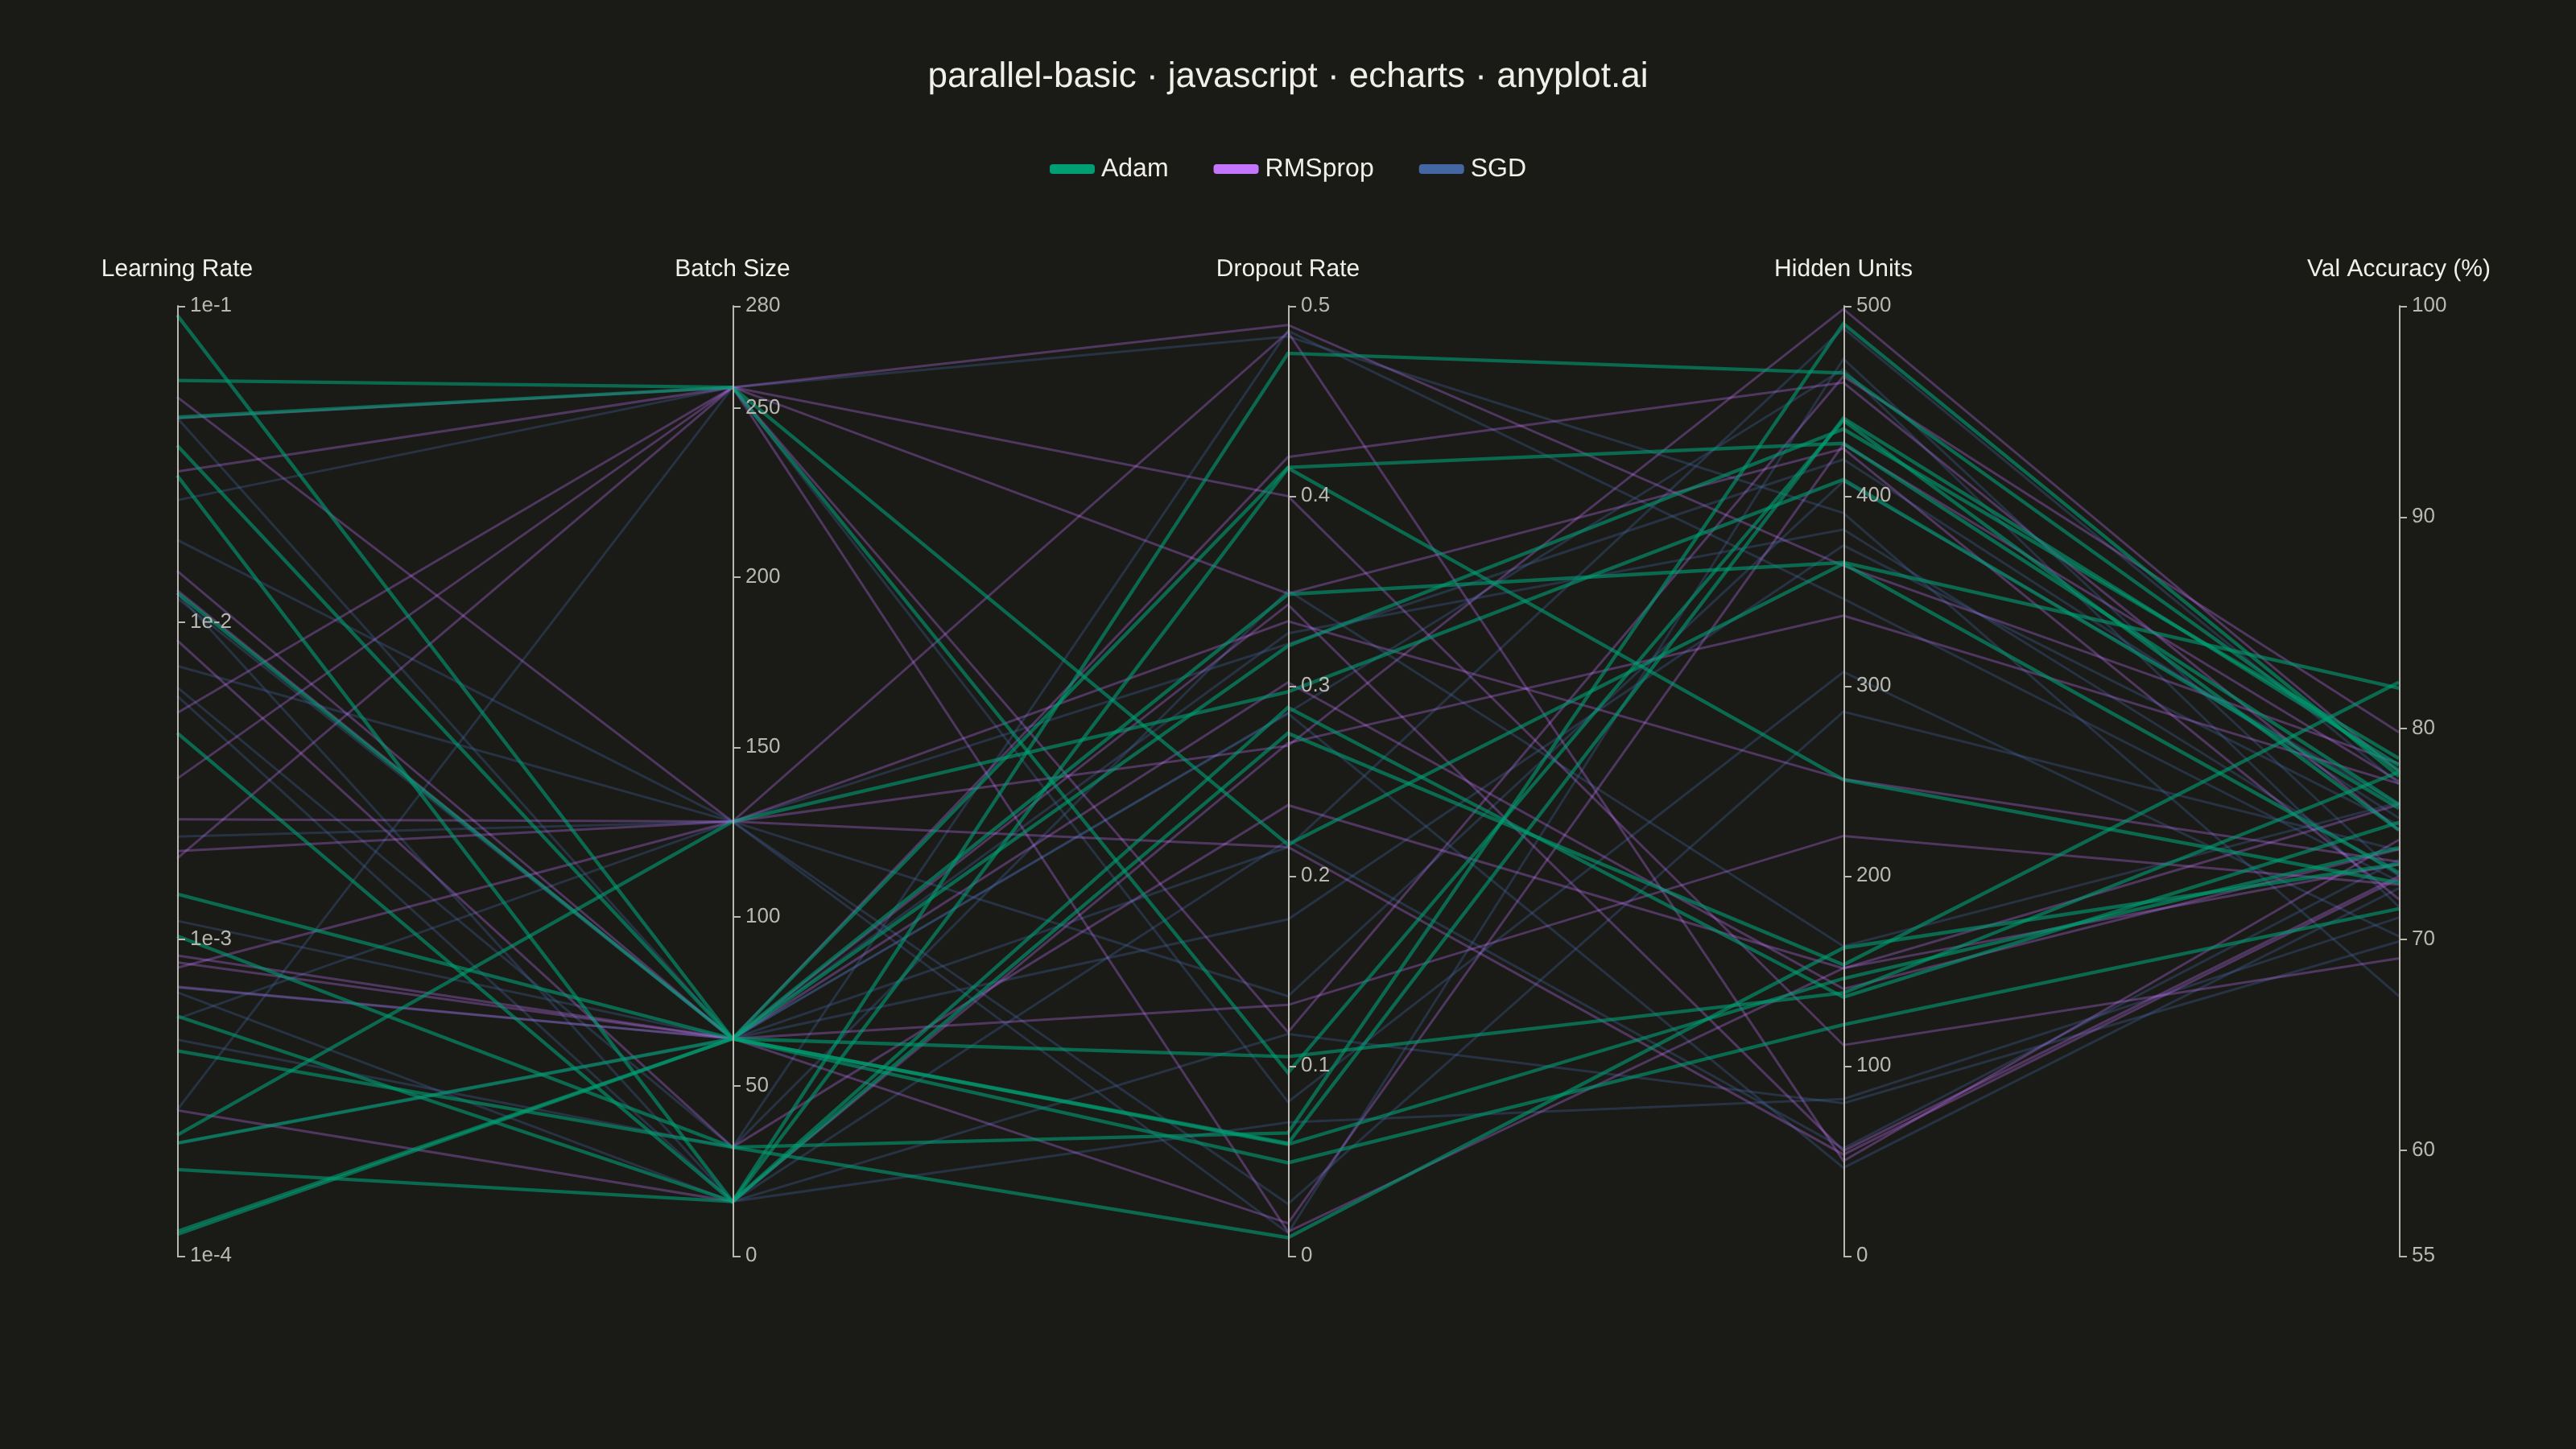
A parallel coordinates plot visualizes multivariate data by representing each variable as a vertical axis and each observation as a line connecting values across all axes. This technique is powerful for identifying patterns, clusters, and outliers in high-dimensional datasets where traditional 2D plots fall short. It enables simultaneous comparison of multiple variables for each data point.
// anyplot.ai
// parallel-basic: Basic Parallel Coordinates Plot
// Library: echarts 6.1.0 | JavaScript 22.23.1
// Quality: 89/100 | Created: 2026-07-24

const t = window.ANYPLOT_TOKENS;

// --- Data: ML hyperparameter search runs, grouped by optimizer -------------
// Tiny fixed-seed LCG — the browser has no seeded RNG.
function lcg(seed) {
  let state = seed >>> 0;
  return function () {
    state = (state * 1664525 + 1013904223) >>> 0;
    return state / 4294967296;
  };
}
const rand = lcg(42);

const OPTIMIZERS = ["Adam", "RMSprop", "SGD"];
const OPT_BONUS = { Adam: 4.5, RMSprop: 2, SGD: 0 };
const BATCH_SIZES = [16, 32, 64, 128, 256];
const RUNS_PER_OPTIMIZER = 16;

function clamp(v, lo, hi) {
  return Math.max(lo, Math.min(hi, v));
}

const runsByOptimizer = OPTIMIZERS.map((optimizer) => {
  const rows = [];
  for (let i = 0; i < RUNS_PER_OPTIMIZER; i++) {
    const learningRate = Math.pow(10, -4 + rand() * 3); // 1e-4 .. 1e-1, log-uniform
    const batchSize = BATCH_SIZES[Math.floor(rand() * BATCH_SIZES.length)];
    const dropout = rand() * 0.5; // 0 .. 0.5
    const hiddenUnits = 32 + rand() * 468; // 32 .. 500

    const lrPenalty = Math.abs(Math.log10(learningRate) - -2.5) * 5;
    const dropoutPenalty = Math.abs(dropout - 0.25) * 8;
    const hiddenBonus = (hiddenUnits / 500) * 5;
    const batchPenalty = (Math.abs(batchSize - 64) / 256) * 3;
    const noise = (rand() - 0.5) * 6;

    const valAccuracy = clamp(
      75 +
        OPT_BONUS[optimizer] -
        lrPenalty -
        dropoutPenalty +
        hiddenBonus -
        batchPenalty +
        noise,
      55,
      99,
    );

    rows.push([learningRate, batchSize, dropout, hiddenUnits, valAccuracy]);
  }
  return rows;
});

// --- Chart -------------------------------------------------------------------
const axisNameStyle = { color: t.ink, fontSize: 15 };
const axisLabelStyle = { color: t.inkSoft, fontSize: 13 };
const axisLineStyle = { lineStyle: { color: t.inkSoft } };

const chart = echarts.init(document.getElementById("container"));
chart.setOption({
  animation: false,
  color: t.palette,
  backgroundColor: "transparent",
  title: {
    text: "parallel-basic · javascript · echarts · anyplot.ai",
    left: "center",
    top: 32,
    textStyle: { color: t.ink, fontSize: 22, fontWeight: "500" },
  },
  legend: {
    top: 92,
    data: OPTIMIZERS,
    textStyle: { color: t.ink, fontSize: 16 },
    itemGap: 28,
    itemWidth: 26,
    itemHeight: 4,
  },
  parallelAxis: [
    {
      dim: 0,
      name: "Learning Rate",
      type: "log",
      min: 1e-4,
      max: 1e-1,
      nameTextStyle: axisNameStyle,
      axisLabel: { ...axisLabelStyle, formatter: (v) => v.toExponential(0) },
      axisLine: axisLineStyle,
    },
    {
      dim: 1,
      name: "Batch Size",
      min: 0,
      max: 280,
      nameTextStyle: axisNameStyle,
      axisLabel: axisLabelStyle,
      axisLine: axisLineStyle,
    },
    {
      dim: 2,
      name: "Dropout Rate",
      min: 0,
      max: 0.5,
      nameTextStyle: axisNameStyle,
      axisLabel: axisLabelStyle,
      axisLine: axisLineStyle,
    },
    {
      dim: 3,
      name: "Hidden Units",
      min: 0,
      max: 500,
      nameTextStyle: axisNameStyle,
      axisLabel: axisLabelStyle,
      axisLine: axisLineStyle,
    },
    {
      dim: 4,
      name: "Val Accuracy (%)",
      min: 55,
      max: 100,
      nameTextStyle: axisNameStyle,
      axisLabel: axisLabelStyle,
      axisLine: axisLineStyle,
    },
  ],
  parallel: {
    left: 110,
    right: 110,
    top: 190,
    bottom: 120,
    parallelAxisDefault: {
      axisLine: axisLineStyle,
      axisTick: { lineStyle: { color: t.inkSoft } },
      splitLine: { show: false },
    },
  },
  tooltip: {
    backgroundColor: t.elevatedBg,
    borderColor: t.grid,
    textStyle: { color: t.ink, fontSize: 14 },
  },
  // Draw back-to-front (SGD, RMSprop, Adam) so Adam's accuracy edge renders on
  // top of the crossing mesh instead of being buried by later series; colors
  // stay pinned to each optimizer's canonical Imprint slot regardless of draw order.
  series: ["SGD", "RMSprop", "Adam"].map((optimizer) => {
    const idx = OPTIMIZERS.indexOf(optimizer);
    const isAdam = optimizer === "Adam";
    return {
      name: optimizer,
      type: "parallel",
      smooth: false,
      itemStyle: { color: t.palette[idx] },
      lineStyle: {
        color: t.palette[idx],
        width: isAdam ? 2.2 : 1.5,
        opacity: isAdam ? 0.6 : 0.32,
      },
      emphasis: { lineStyle: { opacity: 0.9, width: 2.8 } },
      data: runsByOptimizer[idx],
    };
  }),
});
Runnable source as JSON, for any HTTP client: https://api.anyplot.ai/specs/parallel-basic/echarts/code. Any spec id and library id listed in llms-full.txt fit the same URL shape; every URL below is complete and callable.
{
  "spec_id": "parallel-basic",
  "language": "javascript",
  "library": "echarts",
  "page": "https://anyplot.ai/parallel-basic/javascript/echarts",
  "hub": "https://anyplot.ai/parallel-basic",
  "code_json": "https://api.anyplot.ai/specs/parallel-basic/echarts/code",
  "spec_json": "https://api.anyplot.ai/specs/parallel-basic",
  "render_light_png": "https://storage.googleapis.com/anyplot-images/plots/parallel-basic/javascript/echarts/plot-light.png",
  "render_dark_png": "https://storage.googleapis.com/anyplot-images/plots/parallel-basic/javascript/echarts/plot-dark.png",
  "interactive_light_html": "https://storage.googleapis.com/anyplot-images/plots/parallel-basic/javascript/echarts/plot-light.html",
  "interactive_dark_html": "https://storage.googleapis.com/anyplot-images/plots/parallel-basic/javascript/echarts/plot-dark.html",
  "quality_score": 89.0,
  "license": "MIT",
  "guide": "https://anyplot.ai/llms.txt"
}
Part of Basic Parallel Coordinates Plot on anyplot.ai.