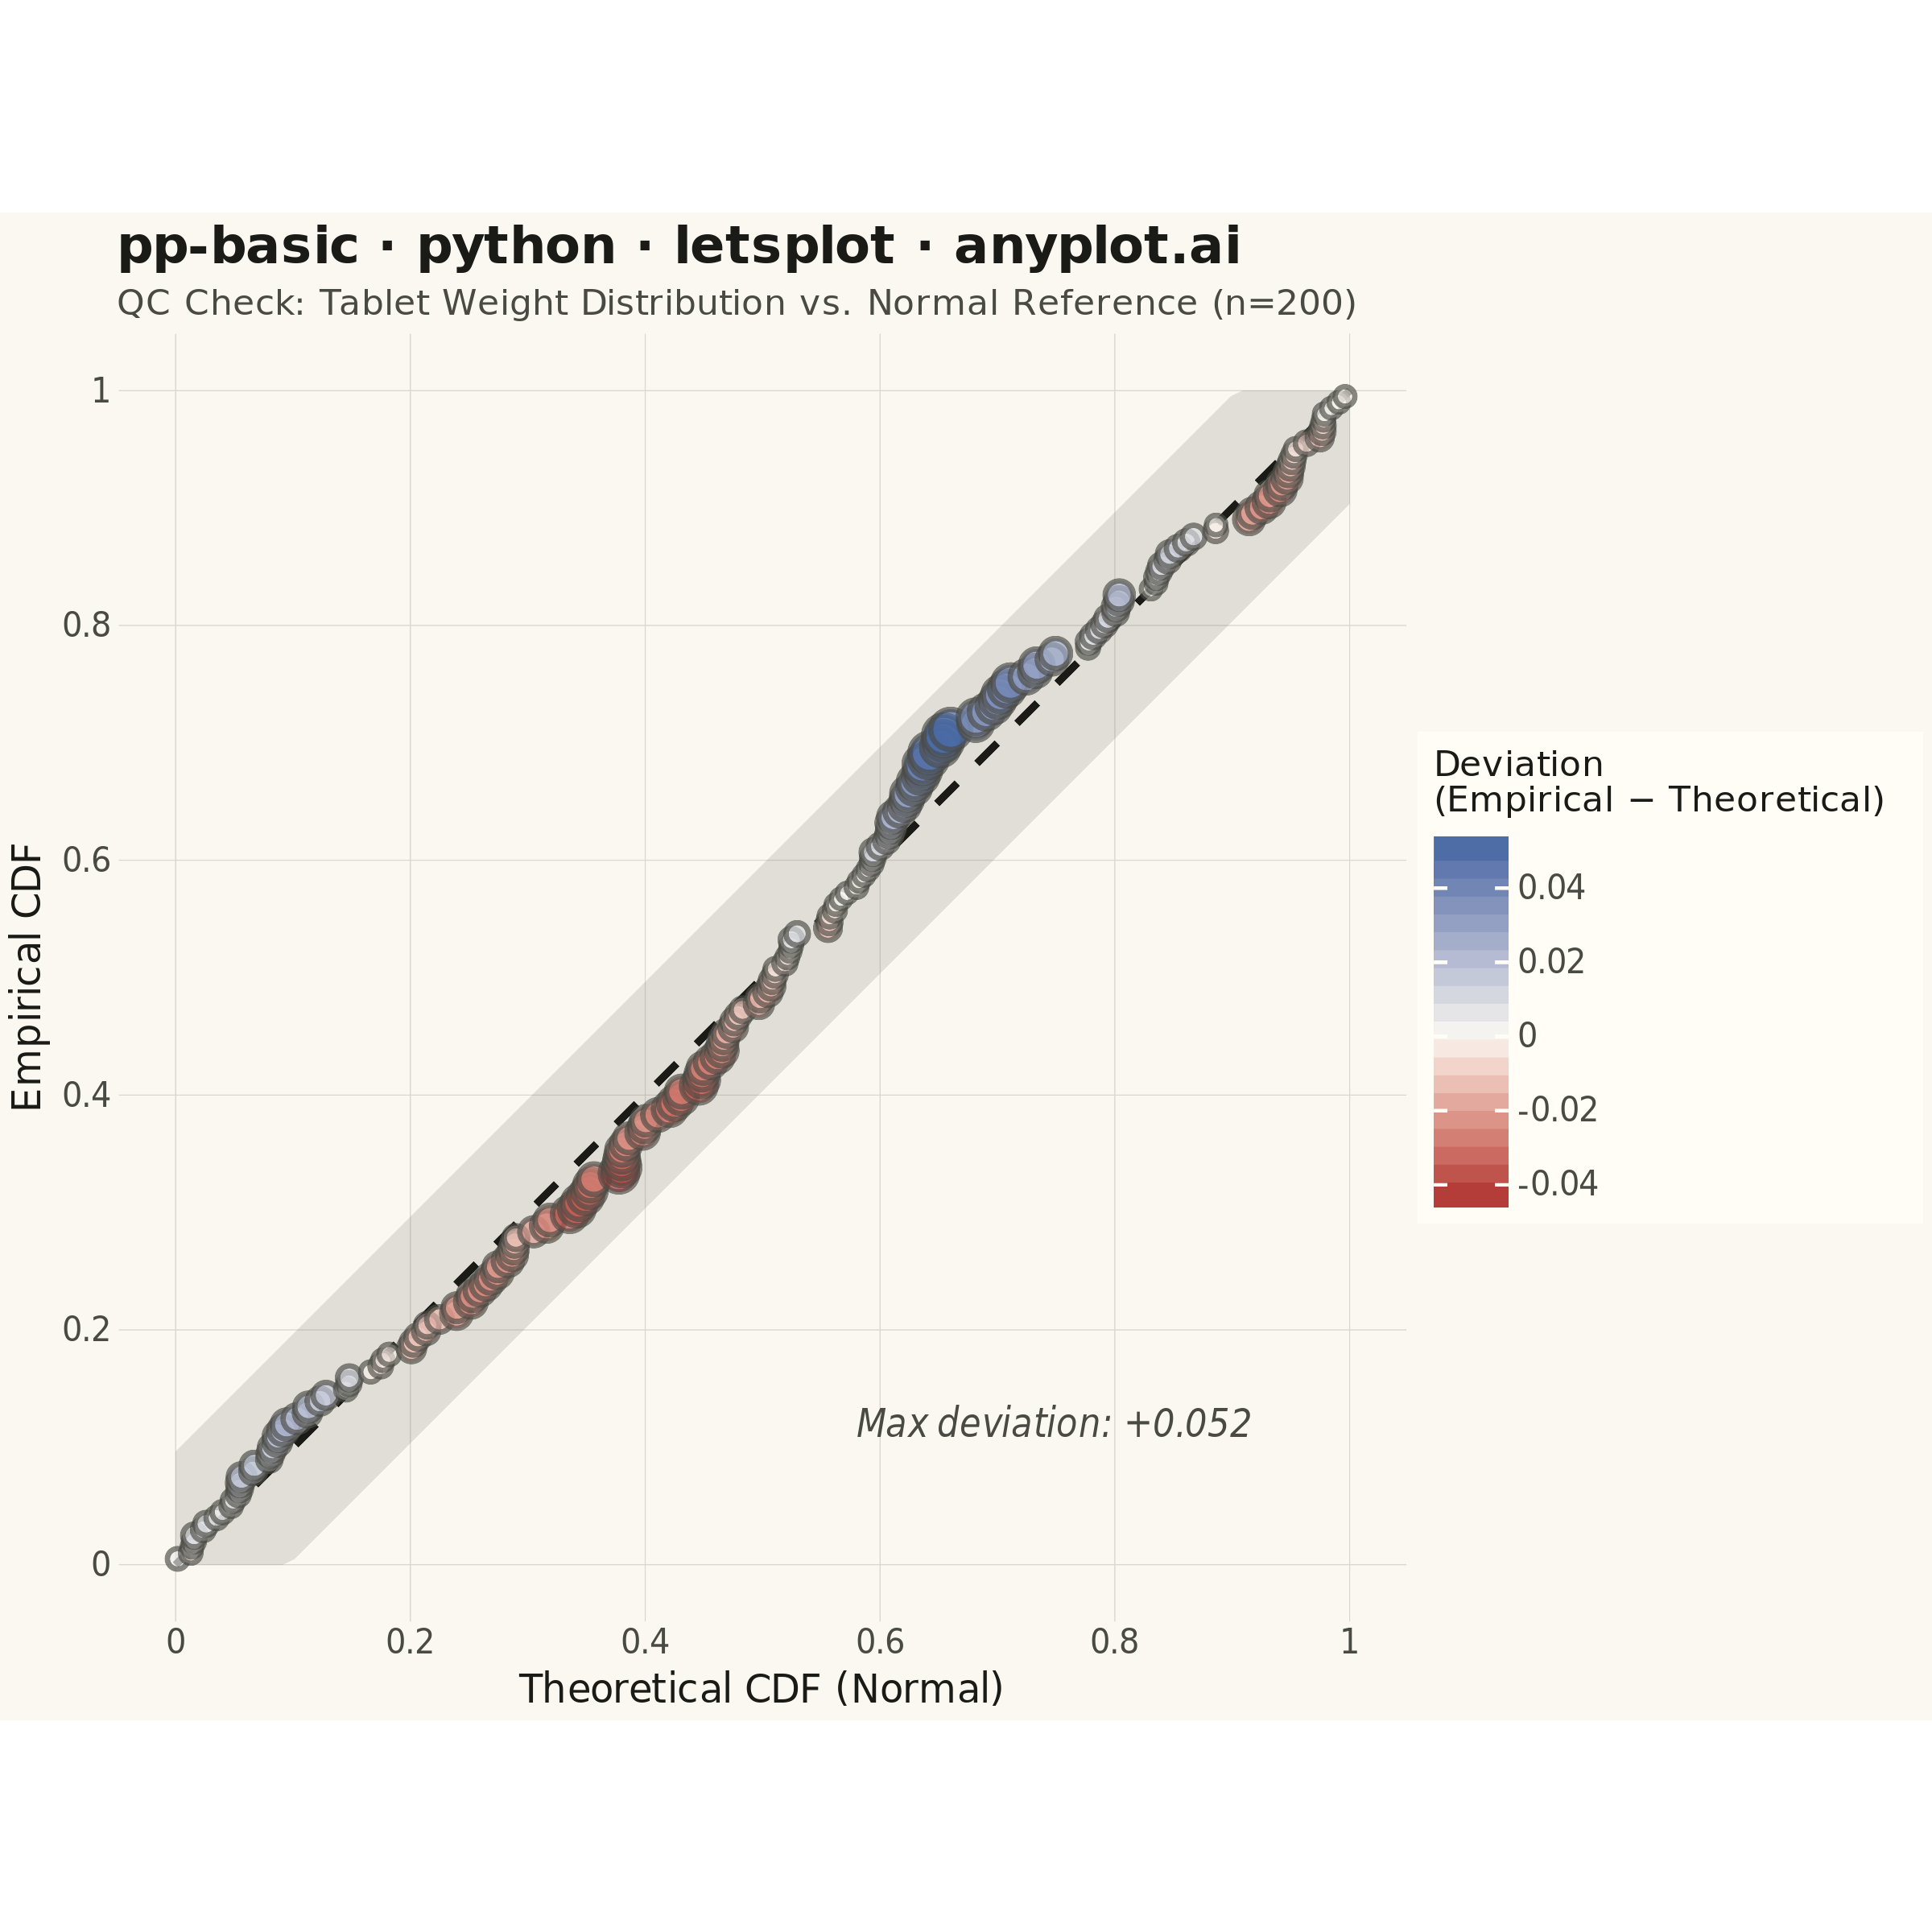
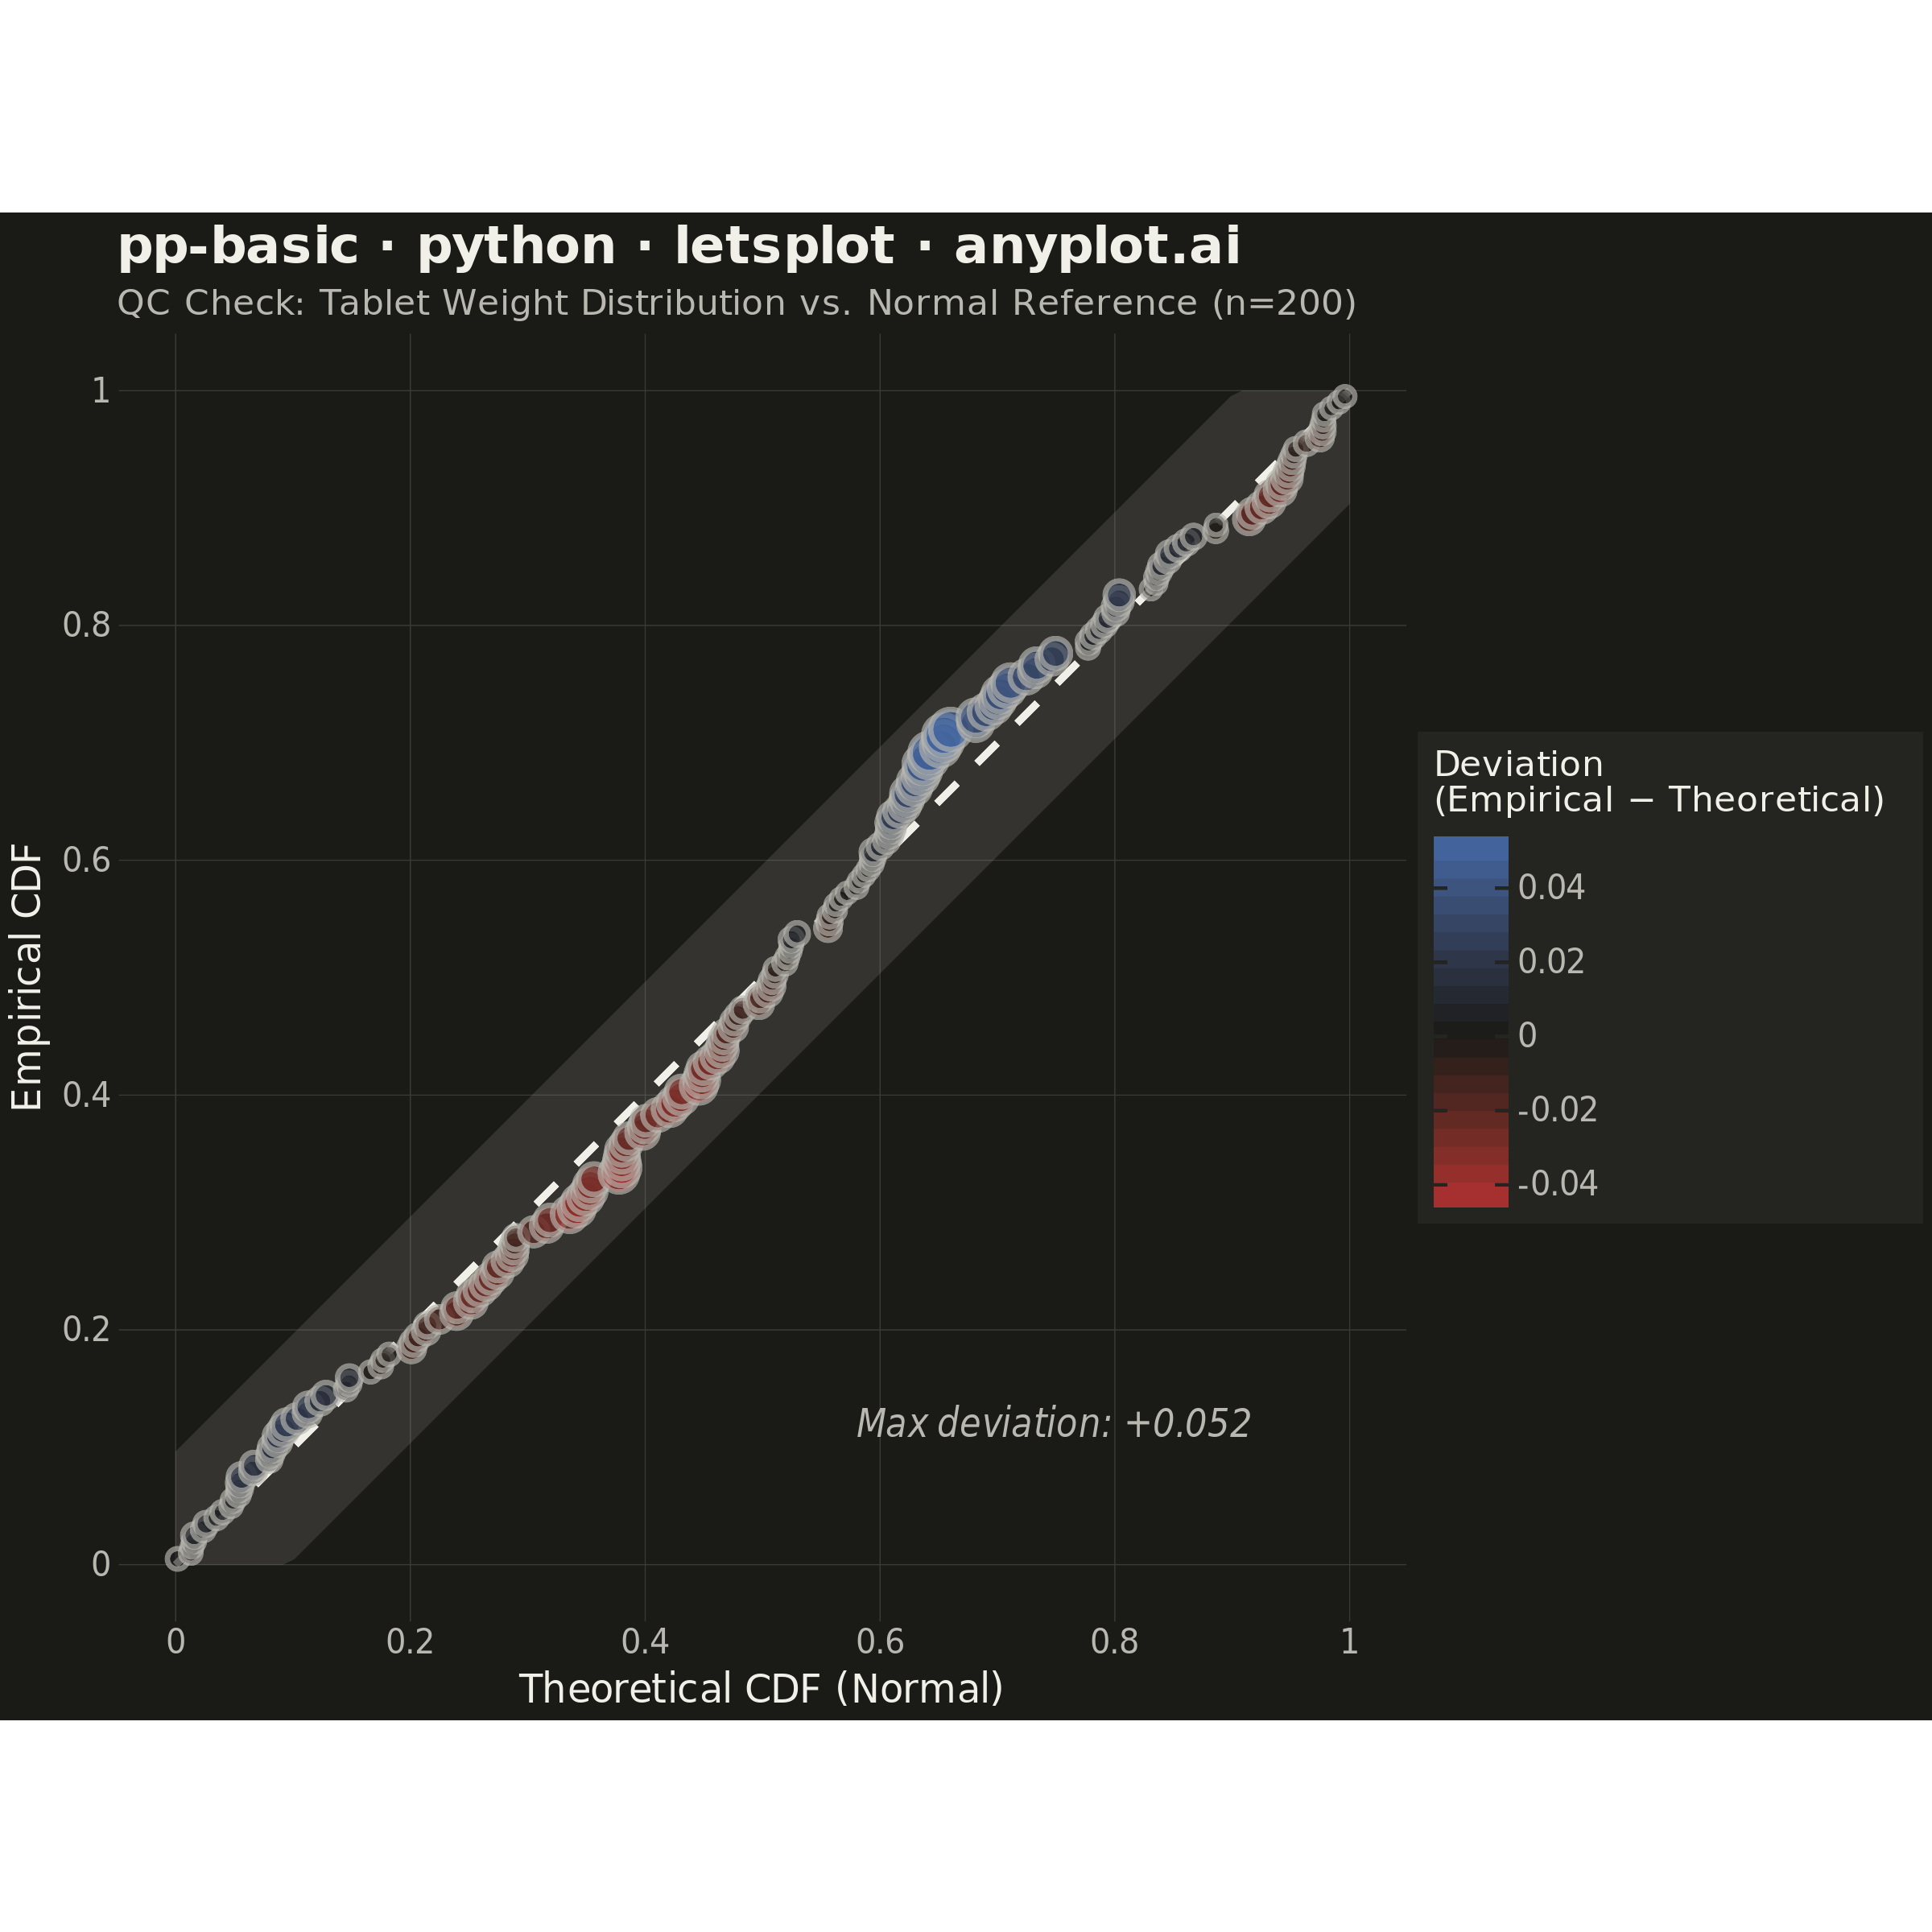
A diagnostic plot comparing the cumulative distribution function (CDF) of observed data against a theoretical distribution by plotting empirical CDF values against theoretical CDF values. Unlike Q-Q plots which compare quantiles, P-P plots compare cumulative probabilities on both axes (0 to 1), making them more sensitive to deviations in the center of the distribution. Points falling along the 45-degree diagonal indicate a good fit.
""" anyplot.ai
pp-basic: Probability-Probability (P-P) Plot
Library: letsplot 4.10.1 | Python 3.13.13
Quality: 93/100 | Updated: 2026-06-16
"""

import os
from math import erf, sqrt

import numpy as np
import pandas as pd
from lets_plot import *


LetsPlot.setup_html()

# Theme tokens (see prompts/default-style-guide.md "Theme-adaptive Chrome")
THEME = os.getenv("ANYPLOT_THEME", "light")
PAGE_BG = "#FAF8F1" if THEME == "light" else "#1A1A17"
ELEVATED_BG = "#FFFDF6" if THEME == "light" else "#242420"
INK = "#1A1A17" if THEME == "light" else "#F0EFE8"
INK_SOFT = "#4A4A44" if THEME == "light" else "#B8B7B0"
INK_MUTED = "#6B6A63" if THEME == "light" else "#A8A79F"
# Subtle gridline (~15% INK over PAGE_BG, per style guide rgba(...,0.15))
GRID = "#D8D7D0" if THEME == "light" else "#3A3A36"

# Imprint diverging cmap: matte-red <-> near-neutral (page bg) <-> blue
IMPRINT_DIV_LOW = "#AE3030"
IMPRINT_DIV_MID = PAGE_BG
IMPRINT_DIV_HIGH = "#4467A3"

# Data: pharmaceutical tablet weight measurements (mg) from a filling machine
# Real-world QC scenario - checking if weights follow a normal distribution
np.random.seed(42)
n_samples = 200

# Tablet weights: target 500mg, slight right skew from occasional overfills
normal_fill = np.random.normal(500, 8, 160)
overfill_events = np.random.exponential(5, 40) + 498
observed = np.concatenate([normal_fill, overfill_events])
observed = observed[:n_samples]

# Sort observed data
observed_sorted = np.sort(observed)

# Compute empirical CDF using plotting position formula i/(n+1)
empirical_cdf = np.arange(1, n_samples + 1) / (n_samples + 1)

# Fit normal distribution (MLE: mean and std of data)
mu = np.mean(observed_sorted)
sigma = np.std(observed_sorted, ddof=0)

# Compute theoretical CDF values (normal CDF inline)
z_scores = (observed_sorted - mu) / (sigma * sqrt(2))
theoretical_cdf = 0.5 * (1 + np.vectorize(erf)(z_scores))

# Signed deviation from perfect fit drives the diverging color mapping
deviation = empirical_cdf - theoretical_cdf

# Classify deviation region for tooltips
region = np.where(np.abs(deviation) < 0.02, "Near fit", np.where(deviation > 0, "Above diagonal", "Below diagonal"))

# Create dataframe for P-P plot points
df_pp = pd.DataFrame(
    {
        "theoretical": theoretical_cdf,
        "empirical": empirical_cdf,
        "deviation": deviation,
        "abs_deviation": np.abs(deviation),
        "weight": observed_sorted,
        "region": region,
    }
)

# Confidence envelope around diagonal (approximate 95% Kolmogorov band)
ks_band = 1.36 / sqrt(n_samples)
envelope_x = np.linspace(0, 1, 100)
df_envelope = pd.DataFrame(
    {
        "x": envelope_x,
        "y_upper": np.minimum(envelope_x + ks_band, 1.0),
        "y_lower": np.maximum(envelope_x - ks_band, 0.0),
    }
)

# Reference line (perfect fit diagonal)
df_ref = pd.DataFrame({"x": [0, 1], "y": [0, 1]})

# Annotation for max deviation - placed in the empty lower-right triangle to avoid overlap
max_dev_idx = np.argmax(np.abs(deviation))
df_annotation = pd.DataFrame({"x": [0.58], "y": [0.12], "label": [f"Max deviation: {deviation[max_dev_idx]:+.3f}"]})

# Plot with lets-plot distinctive features: tooltips, theme-adaptive chrome, text annotation
plot = (
    ggplot()
    + geom_ribbon(
        aes(x="x", ymin="y_lower", ymax="y_upper"),
        data=df_envelope,
        fill=INK_MUTED,
        alpha=0.18,
        size=0,
        tooltips=layer_tooltips().line("95% Kolmogorov band"),
    )
    + geom_line(aes(x="x", y="y"), data=df_ref, color=INK, size=1.0, linetype="dashed", tooltips="none")
    + geom_point(
        aes(x="theoretical", y="empirical", fill="deviation", size="abs_deviation"),
        data=df_pp,
        shape=21,
        color=INK_SOFT,
        stroke=0.7,
        alpha=0.65,
        tooltips=layer_tooltips()
        .format("weight", ".1f")
        .format("deviation", "+.4f")
        .line("@|@weight mg")
        .line("Deviation|@deviation")
        .line("@region"),
    )
    + geom_text(
        aes(x="x", y="y", label="label"), data=df_annotation, size=6, color=INK_SOFT, hjust=0, fontface="italic"
    )
    + scale_fill_gradient2(
        low=IMPRINT_DIV_LOW,
        mid=IMPRINT_DIV_MID,
        high=IMPRINT_DIV_HIGH,
        midpoint=0,
        name="Deviation\n(Empirical − Theoretical)",
    )
    + scale_size(range=[2, 5], guide="none")
    + labs(
        x="Theoretical CDF (Normal)",
        y="Empirical CDF",
        title="pp-basic · python · letsplot · anyplot.ai",
        subtitle="QC Check: Tablet Weight Distribution vs. Normal Reference (n=200)",
    )
    + scale_x_continuous(limits=[0, 1], breaks=[0, 0.2, 0.4, 0.6, 0.8, 1.0])
    + scale_y_continuous(limits=[0, 1], breaks=[0, 0.2, 0.4, 0.6, 0.8, 1.0])
    + coord_fixed(ratio=1)
    + theme_minimal()
    + theme(
        plot_background=element_rect(fill=PAGE_BG, color=PAGE_BG),
        panel_background=element_rect(fill=PAGE_BG, color=PAGE_BG),
        panel_grid_major=element_line(color=GRID, size=0.3),
        panel_grid_minor=element_blank(),
        plot_title=element_text(size=16, face="bold", color=INK),
        plot_subtitle=element_text(size=11, color=INK_SOFT),
        axis_title=element_text(size=12, color=INK),
        axis_text=element_text(size=10, color=INK_SOFT),
        axis_line=element_line(color=INK_SOFT, size=0.4),
        legend_background=element_rect(fill=ELEVATED_BG, color=INK_SOFT),
        legend_title=element_text(size=11, color=INK),
        legend_text=element_text(size=10, color=INK_SOFT),
        legend_position="right",
    )
    + ggsize(600, 600)
)

# Save (square 2400 x 2400: ggsize 600 x scale 4)
ggsave(plot, f"plot-{THEME}.png", path=".", scale=4)
ggsave(plot, f"plot-{THEME}.html", path=".")
Runnable source as JSON, for any HTTP client: https://api.anyplot.ai/specs/pp-basic/letsplot/code. Any spec id and library id listed in llms-full.txt fit the same URL shape; every URL below is complete and callable.
{
  "spec_id": "pp-basic",
  "language": "python",
  "library": "letsplot",
  "page": "https://anyplot.ai/pp-basic/python/letsplot",
  "hub": "https://anyplot.ai/pp-basic",
  "code_json": "https://api.anyplot.ai/specs/pp-basic/letsplot/code",
  "spec_json": "https://api.anyplot.ai/specs/pp-basic",
  "render_light_png": "https://storage.googleapis.com/anyplot-images/plots/pp-basic/python/letsplot/plot-light.png",
  "render_dark_png": "https://storage.googleapis.com/anyplot-images/plots/pp-basic/python/letsplot/plot-dark.png",
  "interactive_light_html": "https://storage.googleapis.com/anyplot-images/plots/pp-basic/python/letsplot/plot-light.html",
  "interactive_dark_html": "https://storage.googleapis.com/anyplot-images/plots/pp-basic/python/letsplot/plot-dark.html",
  "quality_score": 93.0,
  "license": "MIT",
  "guide": "https://anyplot.ai/llms.txt"
}
Part of Probability-Probability (P-P) Plot on anyplot.ai.