The same plot in 14 other libraries — JavaScript: D3.js, Apache ECharts, Highcharts, MUI X Charts; Python: Altair, Bokeh, lets-plot, Matplotlib, Plotly, plotnine, Pygal, Seaborn; R: ggplot2; Julia: Makie.jl. Compare all 15 side by side: Basic Pyramid Chart in Python, R, Julia and JavaScript.
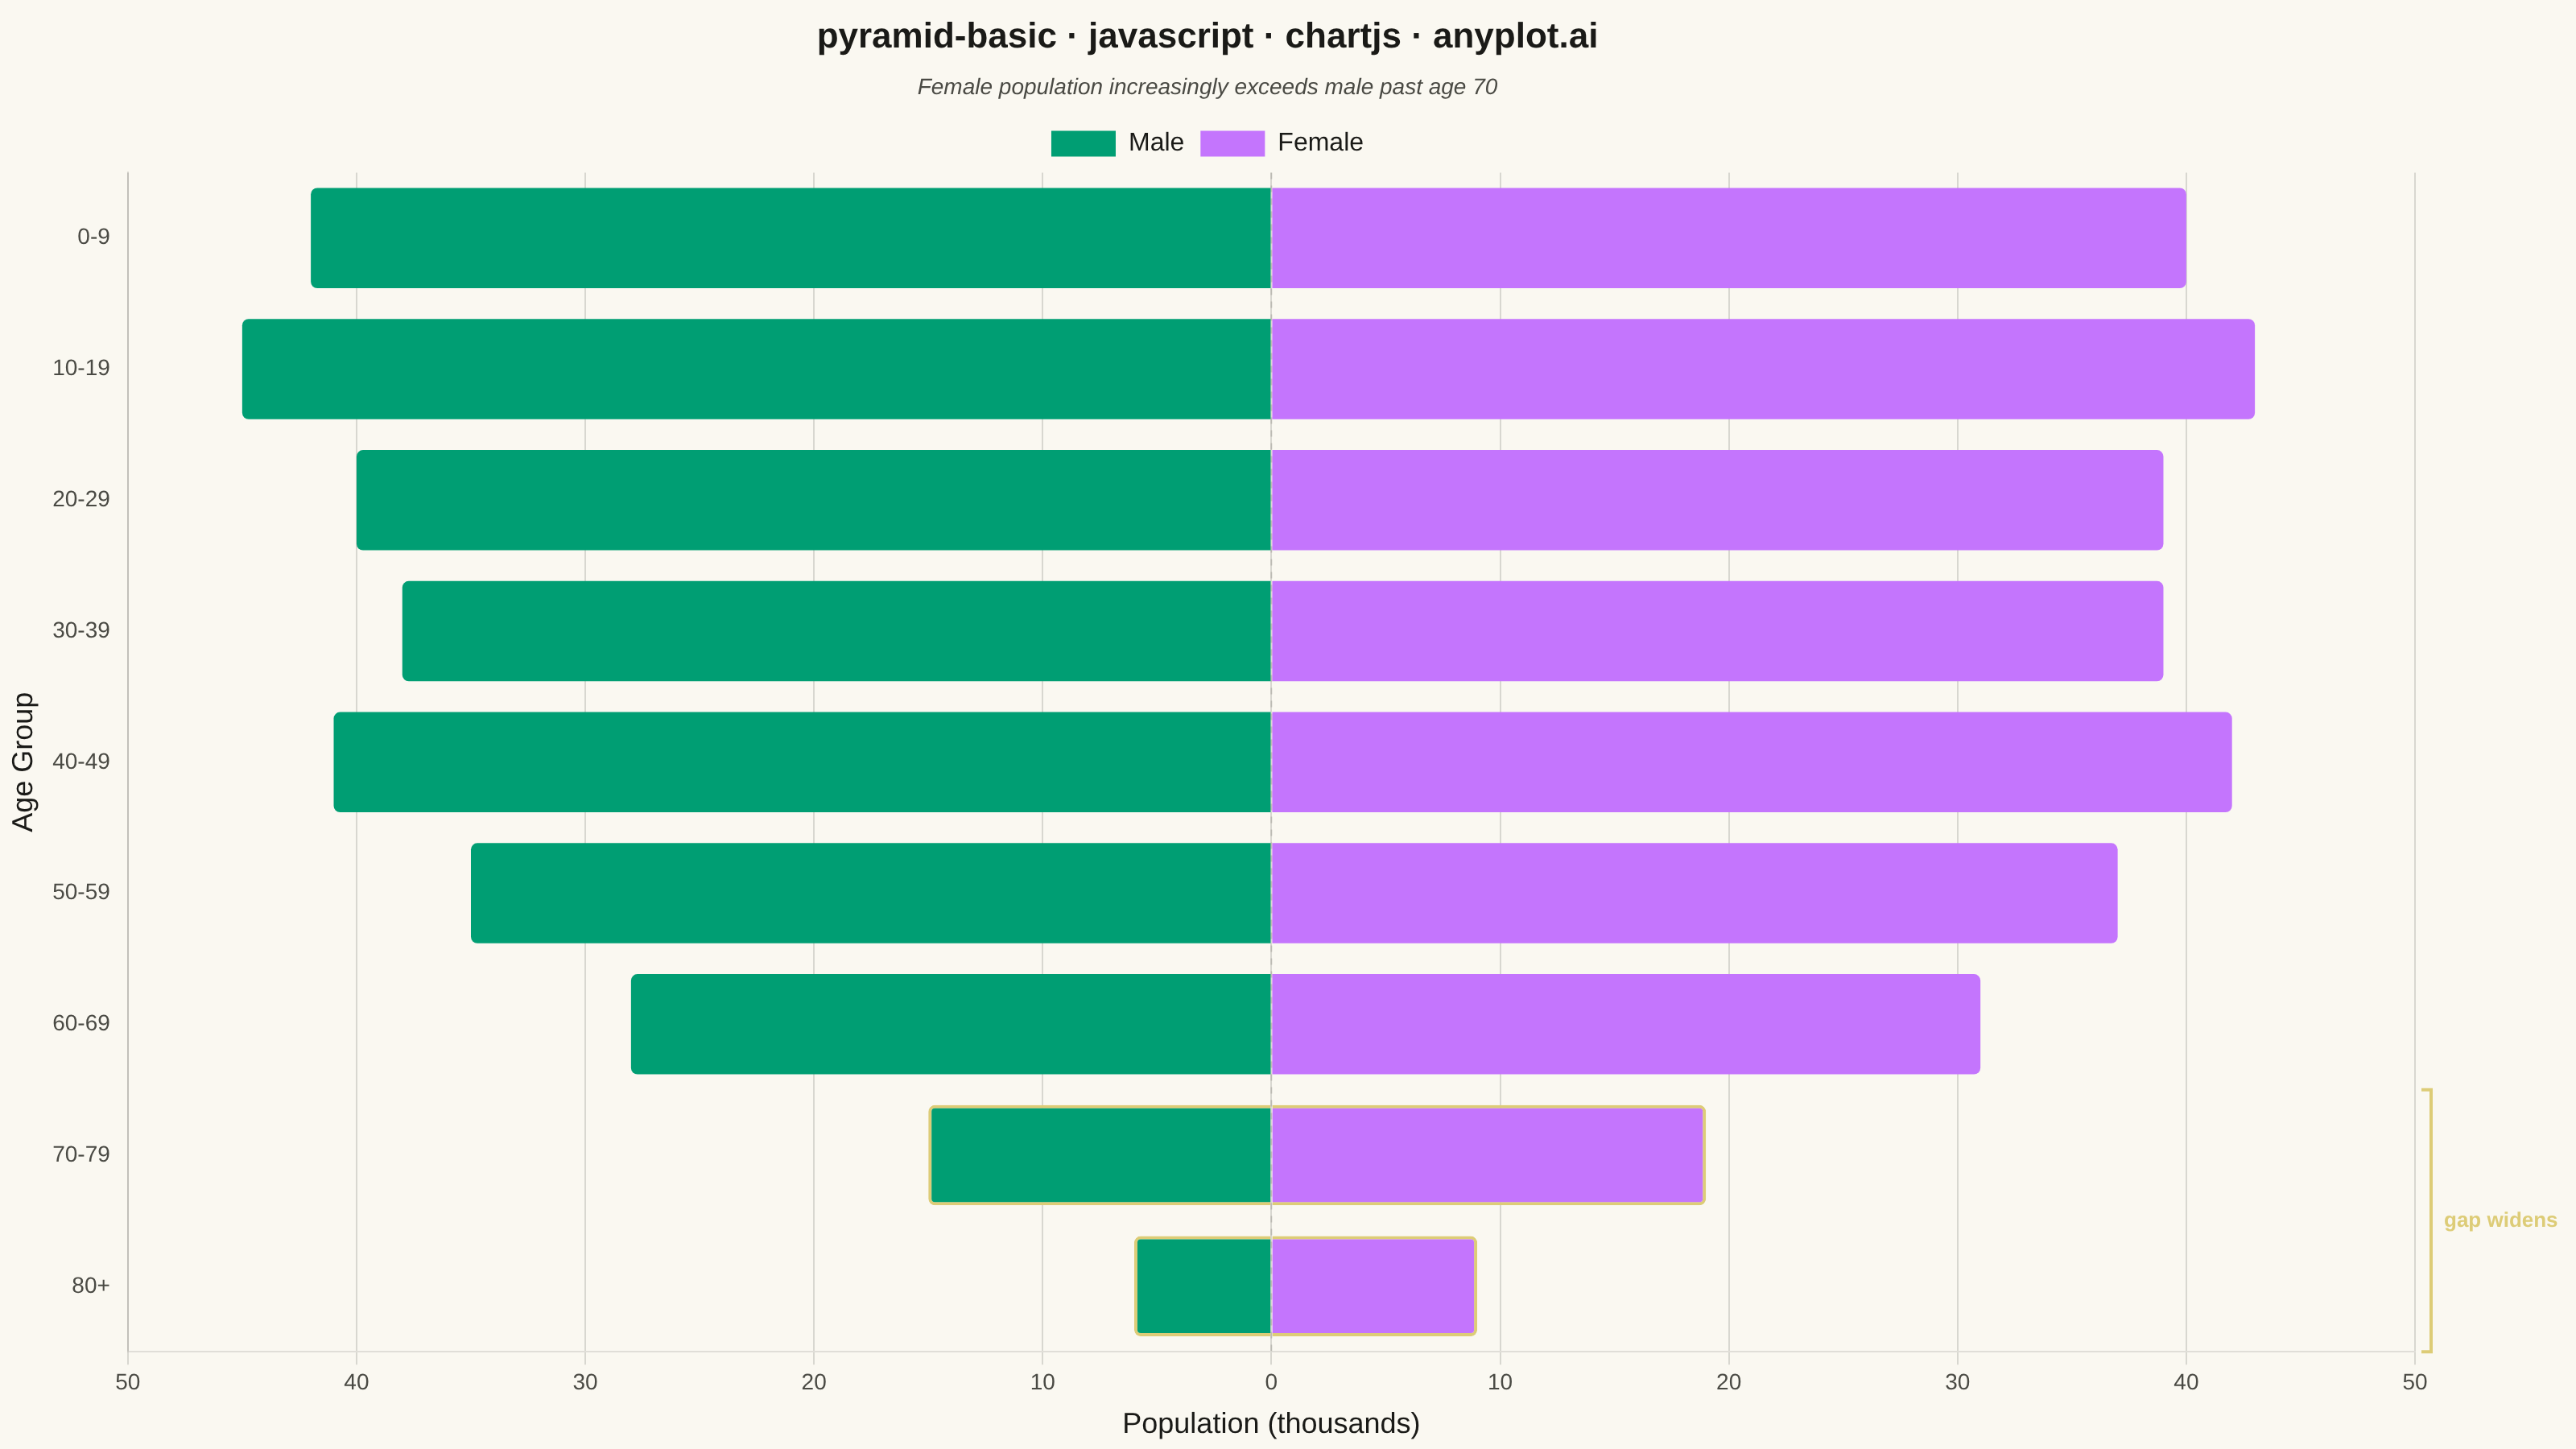
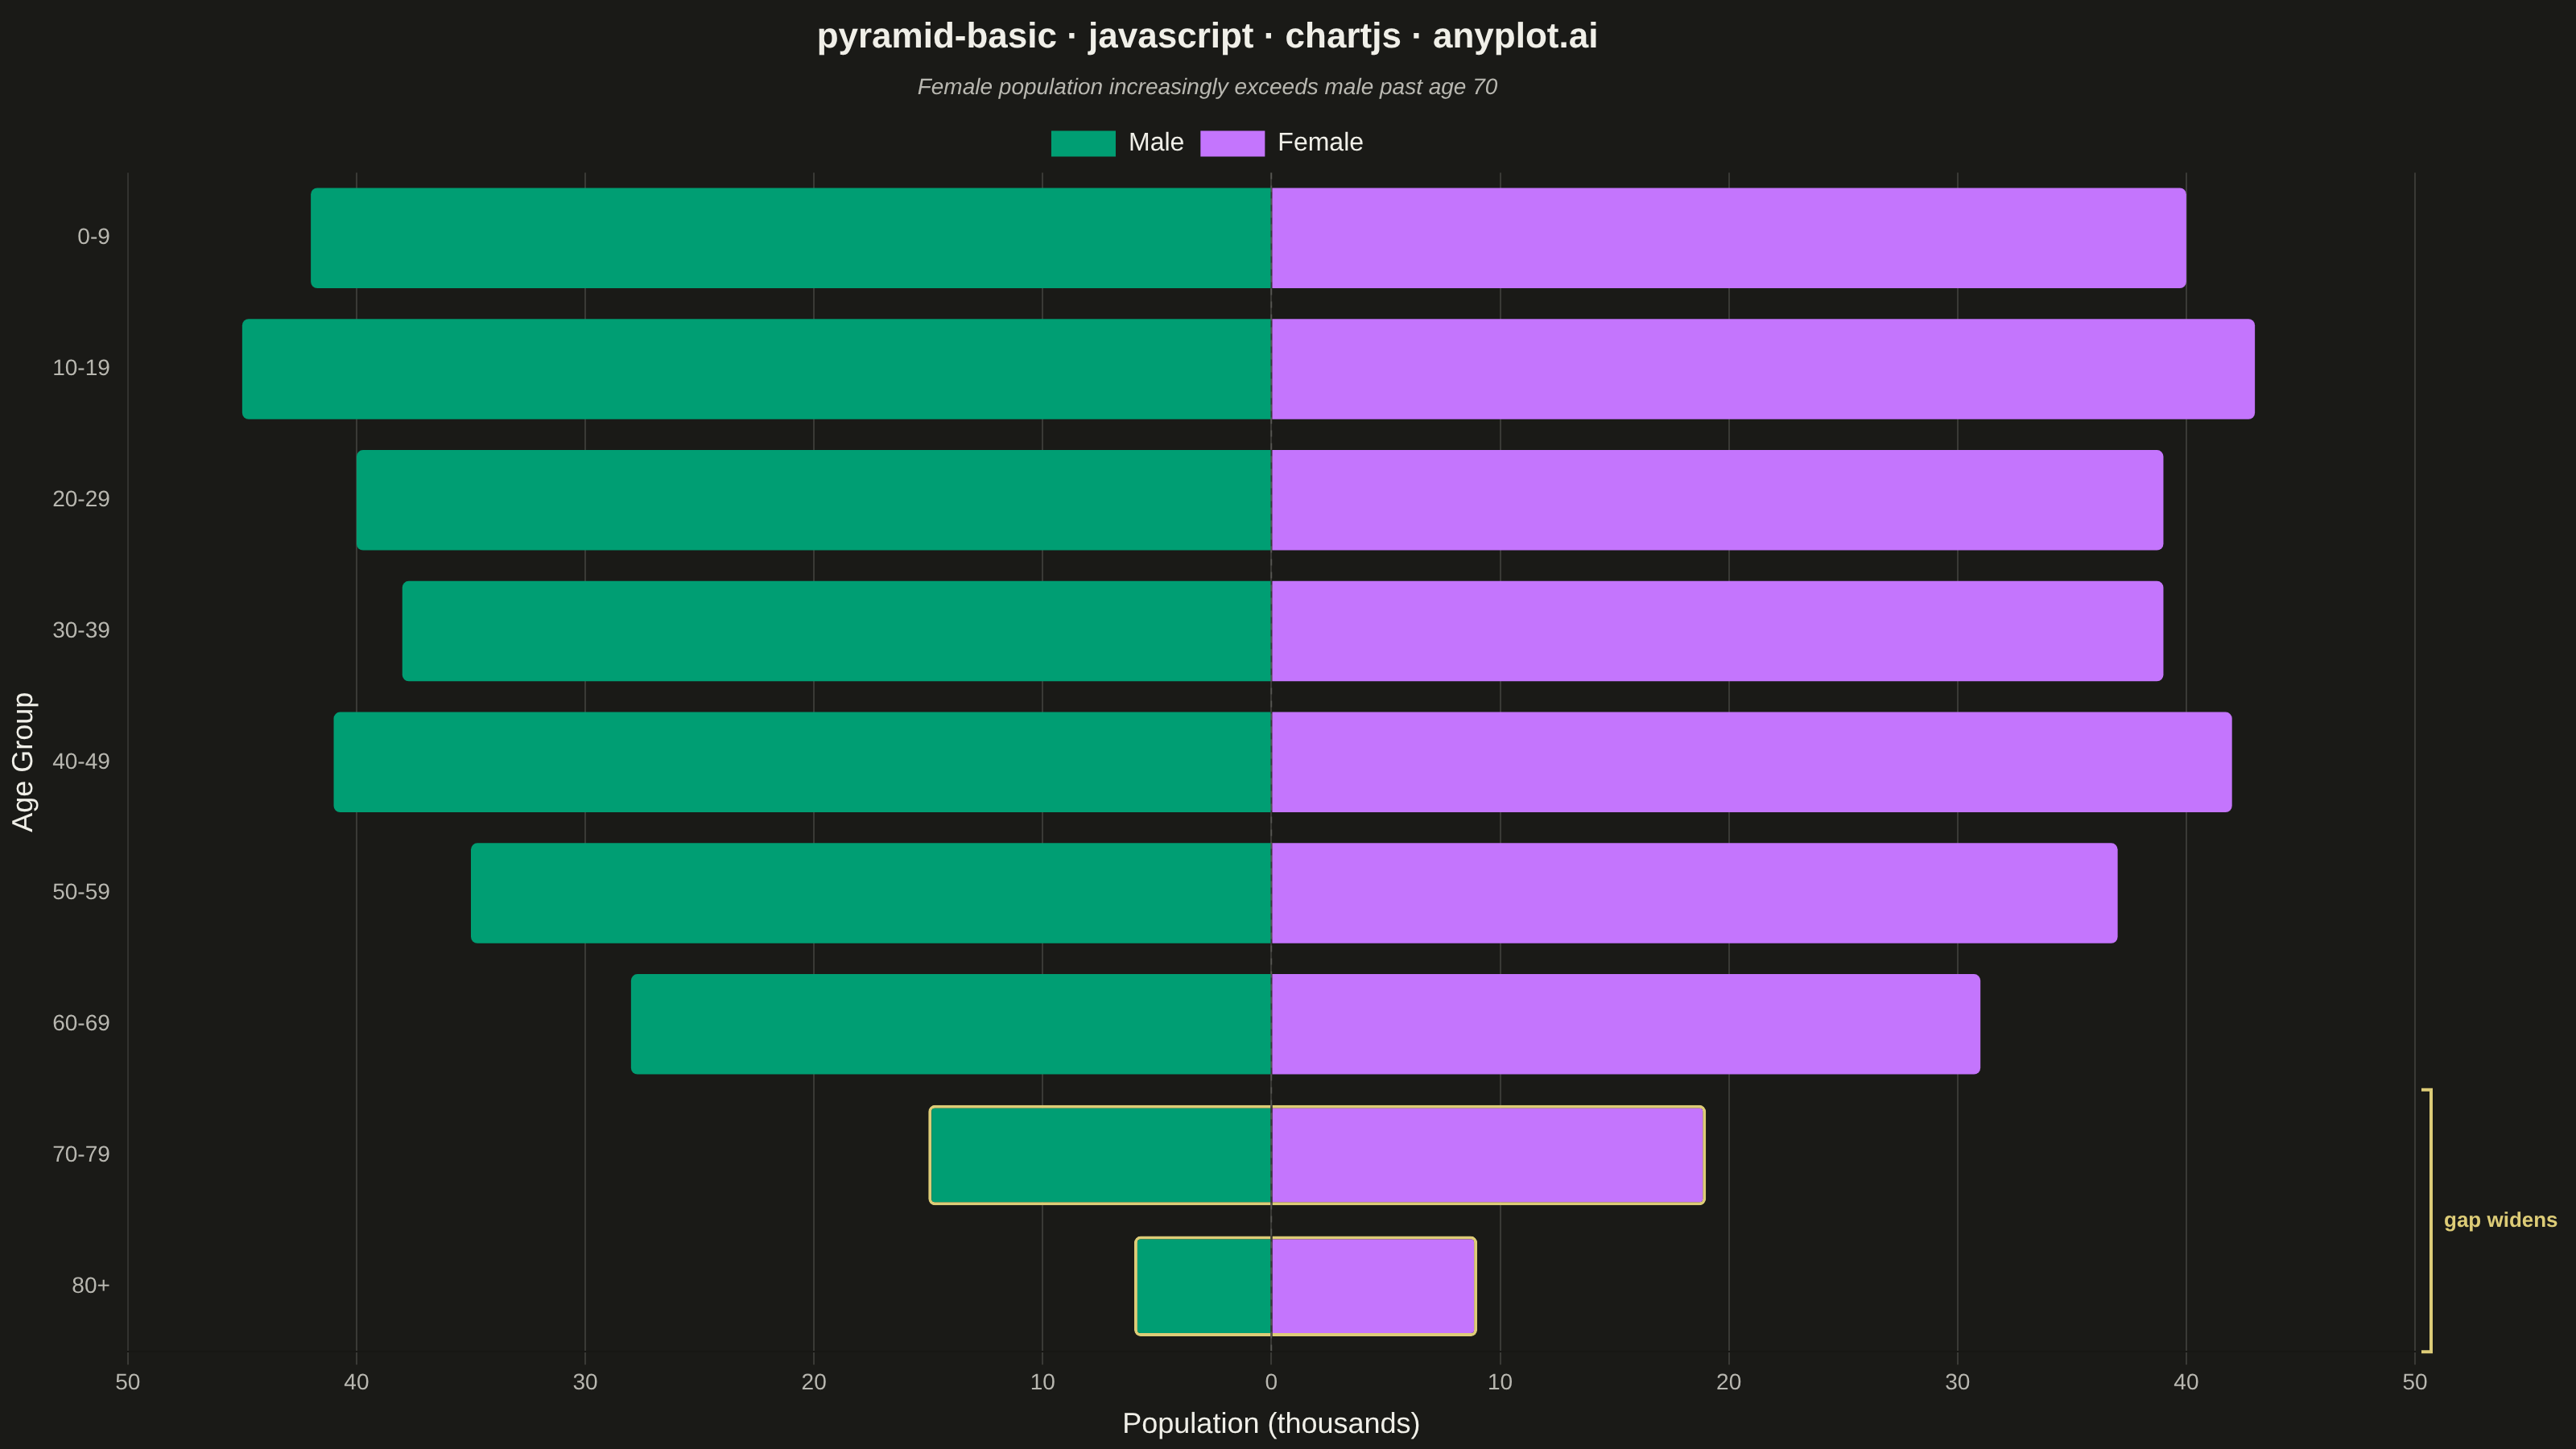
A pyramid chart displays two opposing horizontal bar charts that share a central axis, creating a pyramid or butterfly shape. This visualization is ideal for comparing two related metrics across the same categories, revealing asymmetries and patterns in bidirectional data. Most commonly used for population pyramids showing age-gender distributions.
// anyplot.ai
// pyramid-basic: Basic Pyramid Chart
// Library: chartjs 4.4.7 | JavaScript 22.23.2
// Quality: 94/100 | Created: 2026-09-05

//# anyplot-orientation: landscape
const t = window.ANYPLOT_TOKENS;

// --- Data (in-memory, deterministic) ---------------------------------------
const ageGroups = ["0-9", "10-19", "20-29", "30-39", "40-49", "50-59", "60-69", "70-79", "80+"];
const malePopulation = [42, 45, 40, 38, 41, 35, 28, 15, 6];
const femalePopulation = [40, 43, 39, 39, 42, 37, 31, 19, 9];
const axisMax = 50;

// Oldest two cohorts show the widest female/male gap — give them a subtle
// accent border so the eye lands on the chart's own insight.
const highlightedRows = new Set([7, 8]);
const accentBorder = (color) => ageGroups.map((_, i) => (highlightedRows.has(i) ? color : "transparent"));
const accentWidth = ageGroups.map((_, i) => (highlightedRows.has(i) ? 2 : 0));

// --- Mount -------------------------------------------------------------------
const canvas = document.createElement("canvas");
document.getElementById("container").appendChild(canvas);

// --- Chart.js-specific plugin --------------------------------------------
// A small local plugin (Chart.js's own extensibility hook, not a cross-library
// pattern) draws a dashed center axis line plus a bracket + label calling out
// the widening gender gap in the two oldest cohorts.
const pyramidAnnotations = {
  id: "pyramidAnnotations",
  afterDraw(chart) {
    const { ctx, chartArea, scales } = chart;
    const centerX = scales.x.getPixelForValue(0);

    ctx.save();

    ctx.setLineDash([4, 4]);
    ctx.strokeStyle = t.grid;
    ctx.lineWidth = 1;
    ctx.beginPath();
    ctx.moveTo(centerX, chartArea.top);
    ctx.lineTo(centerX, chartArea.bottom);
    ctx.stroke();
    ctx.setLineDash([]);

    const rowHeight = scales.y.getPixelForTick(1) - scales.y.getPixelForTick(0);
    const topY = scales.y.getPixelForTick(7) - rowHeight / 2;
    const bottomY = scales.y.getPixelForTick(8) + rowHeight / 2;
    const bracketX = chartArea.right + 10;

    ctx.strokeStyle = t.amber;
    ctx.lineWidth = 2;
    ctx.beginPath();
    ctx.moveTo(bracketX - 6, topY);
    ctx.lineTo(bracketX, topY);
    ctx.lineTo(bracketX, bottomY);
    ctx.lineTo(bracketX - 6, bottomY);
    ctx.stroke();

    ctx.fillStyle = t.amber;
    ctx.font = "600 13px sans-serif";
    ctx.textAlign = "left";
    ctx.textBaseline = "middle";
    ctx.fillText("gap widens", bracketX + 8, (topY + bottomY) / 2);

    ctx.restore();
  },
};

// --- Chart -------------------------------------------------------------------
new Chart(canvas, {
  type: "bar",
  data: {
    labels: ageGroups,
    datasets: [
      {
        label: "Male",
        data: malePopulation.map((v) => -v),
        backgroundColor: t.palette[0],
        borderColor: accentBorder(t.amber),
        borderWidth: accentWidth,
        borderRadius: 4,
        categoryPercentage: 0.85,
        barPercentage: 0.9,
      },
      {
        label: "Female",
        data: femalePopulation,
        backgroundColor: t.palette[1],
        borderColor: accentBorder(t.amber),
        borderWidth: accentWidth,
        borderRadius: 4,
        categoryPercentage: 0.85,
        barPercentage: 0.9,
      },
    ],
  },
  plugins: [pyramidAnnotations],
  options: {
    indexAxis: "y",
    responsive: true,
    maintainAspectRatio: false,
    animation: false,
    layout: { padding: { top: 0, right: 100 } },
    plugins: {
      title: {
        display: true,
        text: "pyramid-basic · javascript · chartjs · anyplot.ai",
        color: t.ink,
        font: { size: 22, weight: "600" },
      },
      subtitle: {
        display: true,
        text: "Female population increasingly exceeds male past age 70",
        color: t.inkSoft,
        font: { size: 14, style: "italic" },
        padding: { bottom: 8 },
      },
      legend: {
        position: "top",
        labels: { color: t.ink, font: { size: 16 } },
        padding: 8,
      },
      tooltip: {
        callbacks: {
          label: (ctx) => `${ctx.dataset.label}: ${Math.abs(ctx.parsed.x)}k`,
        },
      },
    },
    scales: {
      x: {
        stacked: true,
        min: -axisMax,
        max: axisMax,
        ticks: {
          color: t.inkSoft,
          font: { size: 14 },
          stepSize: 10,
          callback: (value) => Math.abs(value),
        },
        grid: { color: t.grid },
        title: { display: true, text: "Population (thousands)", color: t.ink, font: { size: 18 } },
      },
      y: {
        stacked: true,
        ticks: { color: t.inkSoft, font: { size: 14 } },
        grid: { display: false },
        title: { display: true, text: "Age Group", color: t.ink, font: { size: 18 } },
      },
    },
  },
});
Runnable source as JSON, for any HTTP client: https://api.anyplot.ai/specs/pyramid-basic/chartjs/code. Any spec id and library id listed in llms-full.txt fit the same URL shape; every URL below is complete and callable.
{
  "spec_id": "pyramid-basic",
  "language": "javascript",
  "library": "chartjs",
  "page": "https://anyplot.ai/pyramid-basic/javascript/chartjs",
  "hub": "https://anyplot.ai/pyramid-basic",
  "code_json": "https://api.anyplot.ai/specs/pyramid-basic/chartjs/code",
  "spec_json": "https://api.anyplot.ai/specs/pyramid-basic",
  "render_light_png": "https://storage.googleapis.com/anyplot-images/plots/pyramid-basic/javascript/chartjs/plot-light.png",
  "render_dark_png": "https://storage.googleapis.com/anyplot-images/plots/pyramid-basic/javascript/chartjs/plot-dark.png",
  "interactive_light_html": "https://storage.googleapis.com/anyplot-images/plots/pyramid-basic/javascript/chartjs/plot-light.html",
  "interactive_dark_html": "https://storage.googleapis.com/anyplot-images/plots/pyramid-basic/javascript/chartjs/plot-dark.html",
  "quality_score": 94.0,
  "license": "MIT",
  "guide": "https://anyplot.ai/llms.txt"
}
Part of Basic Pyramid Chart on anyplot.ai.