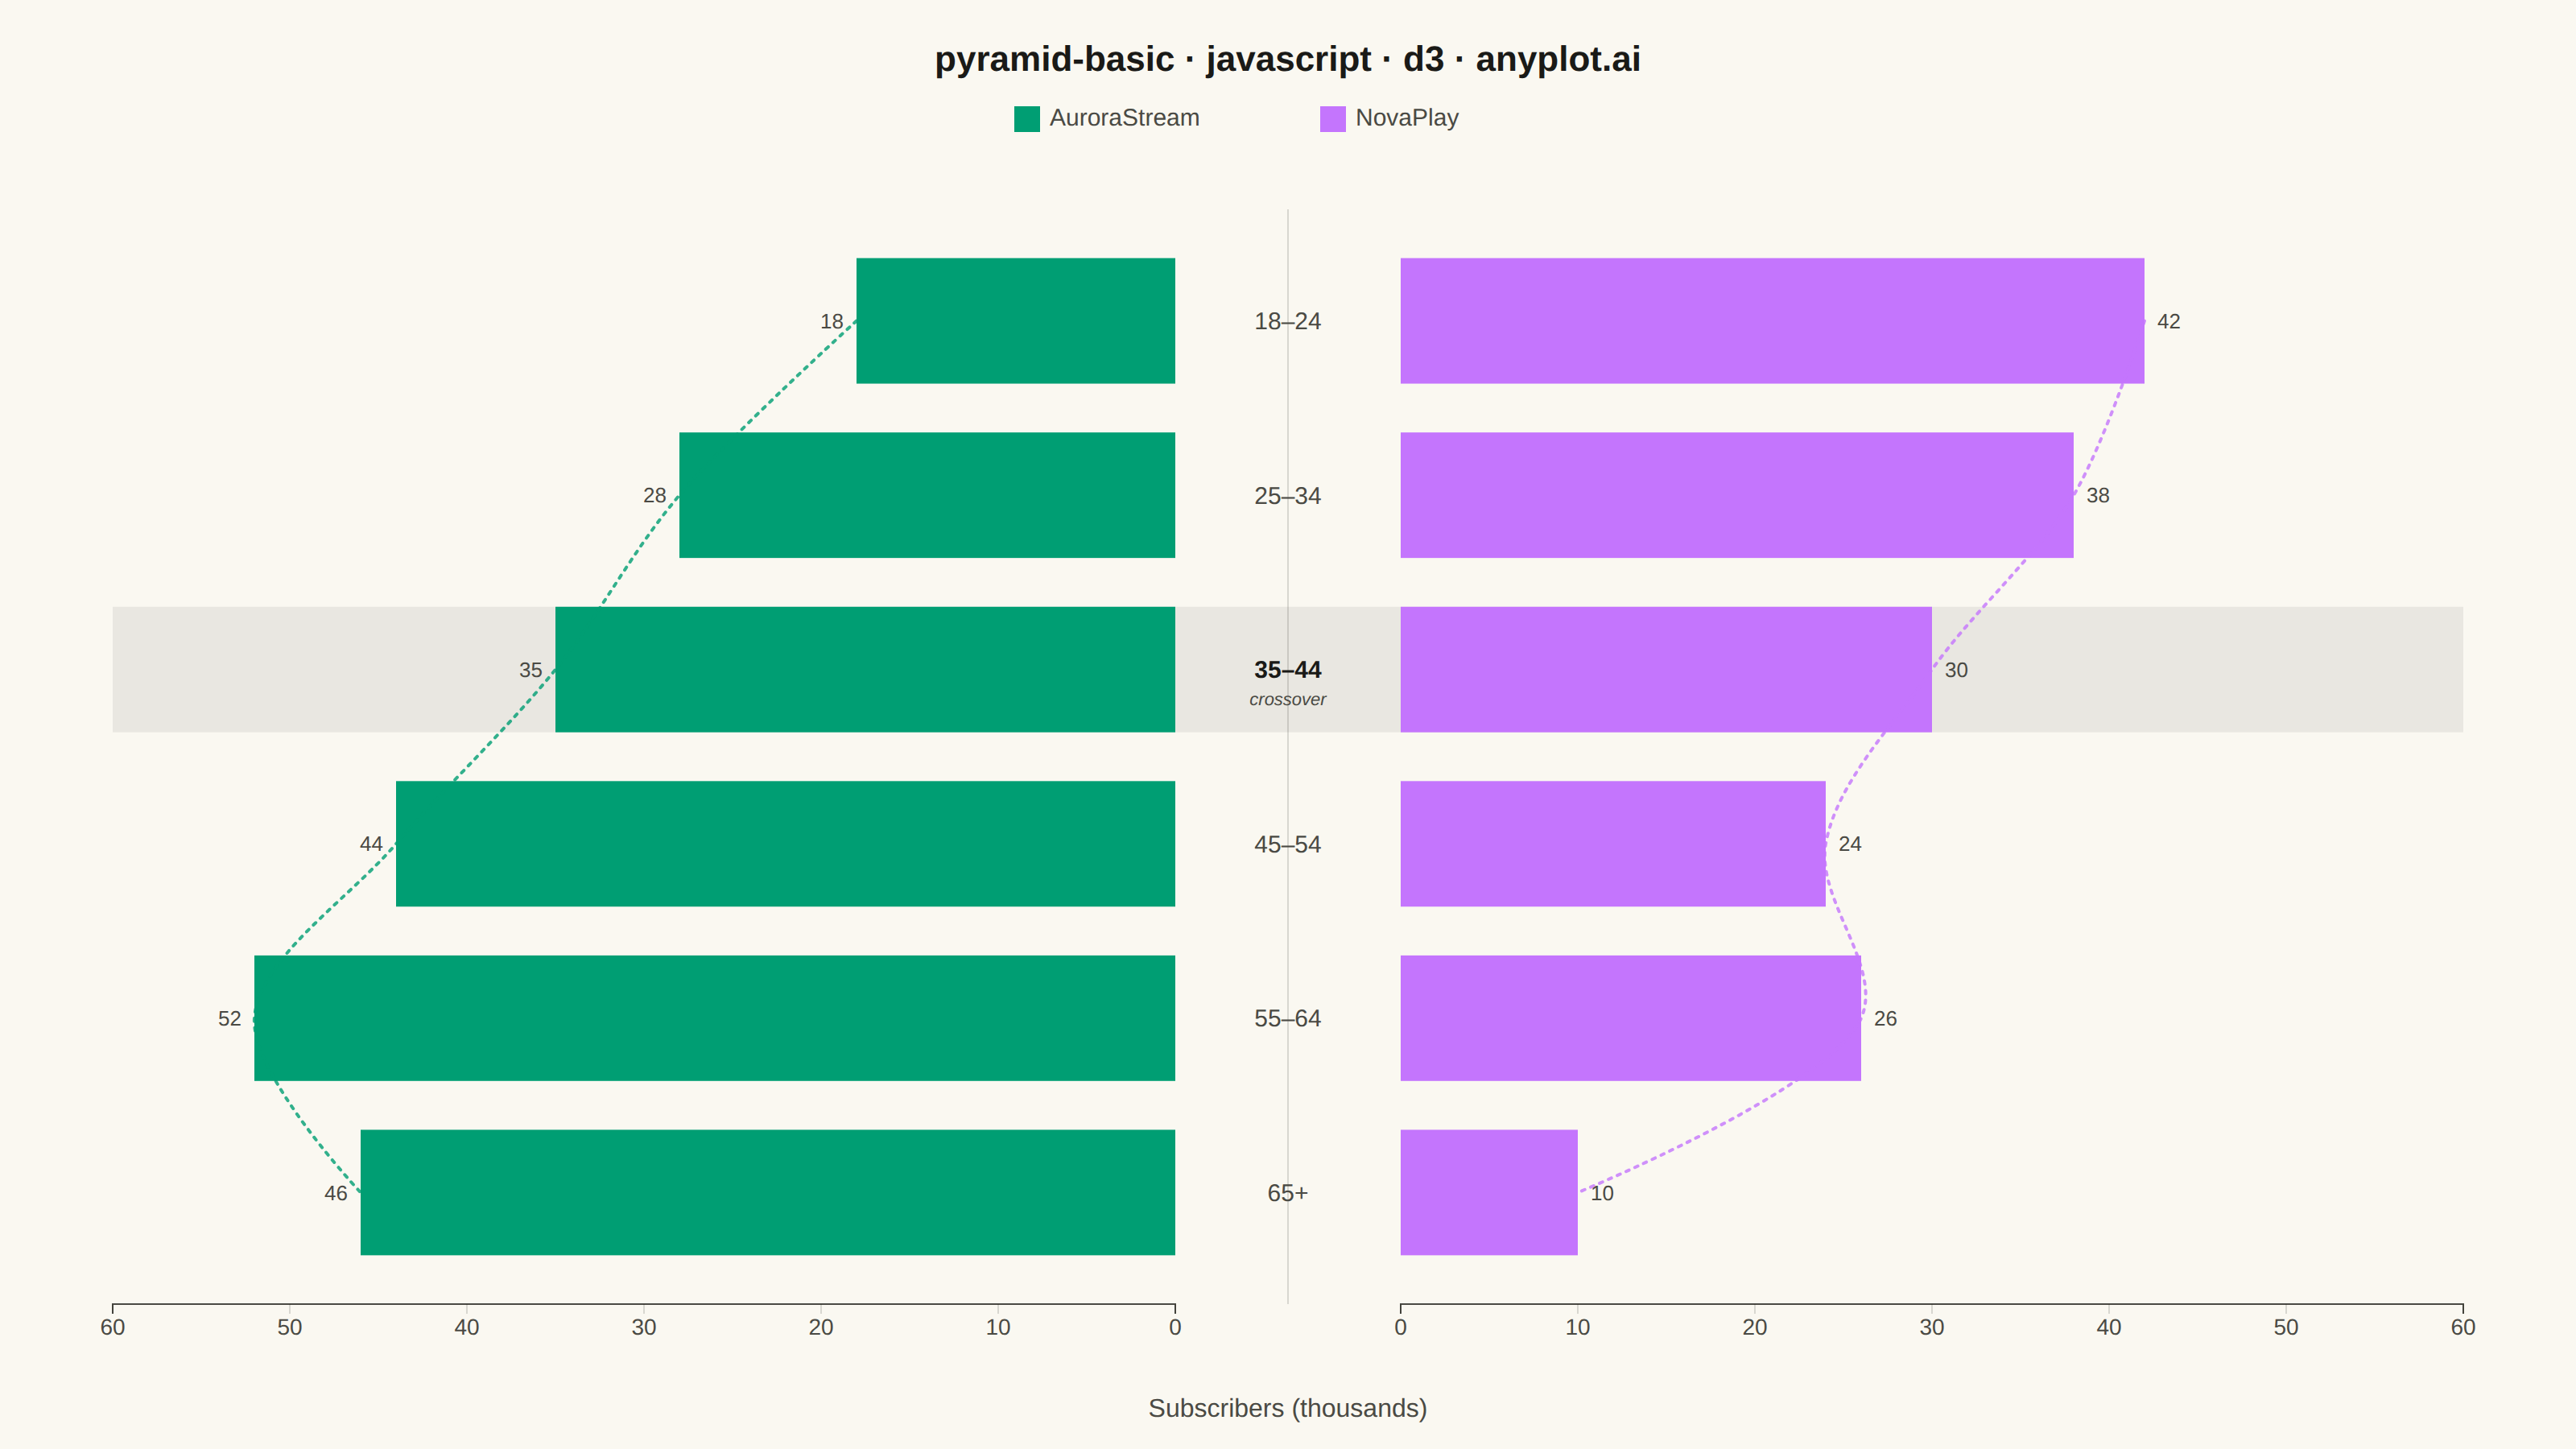
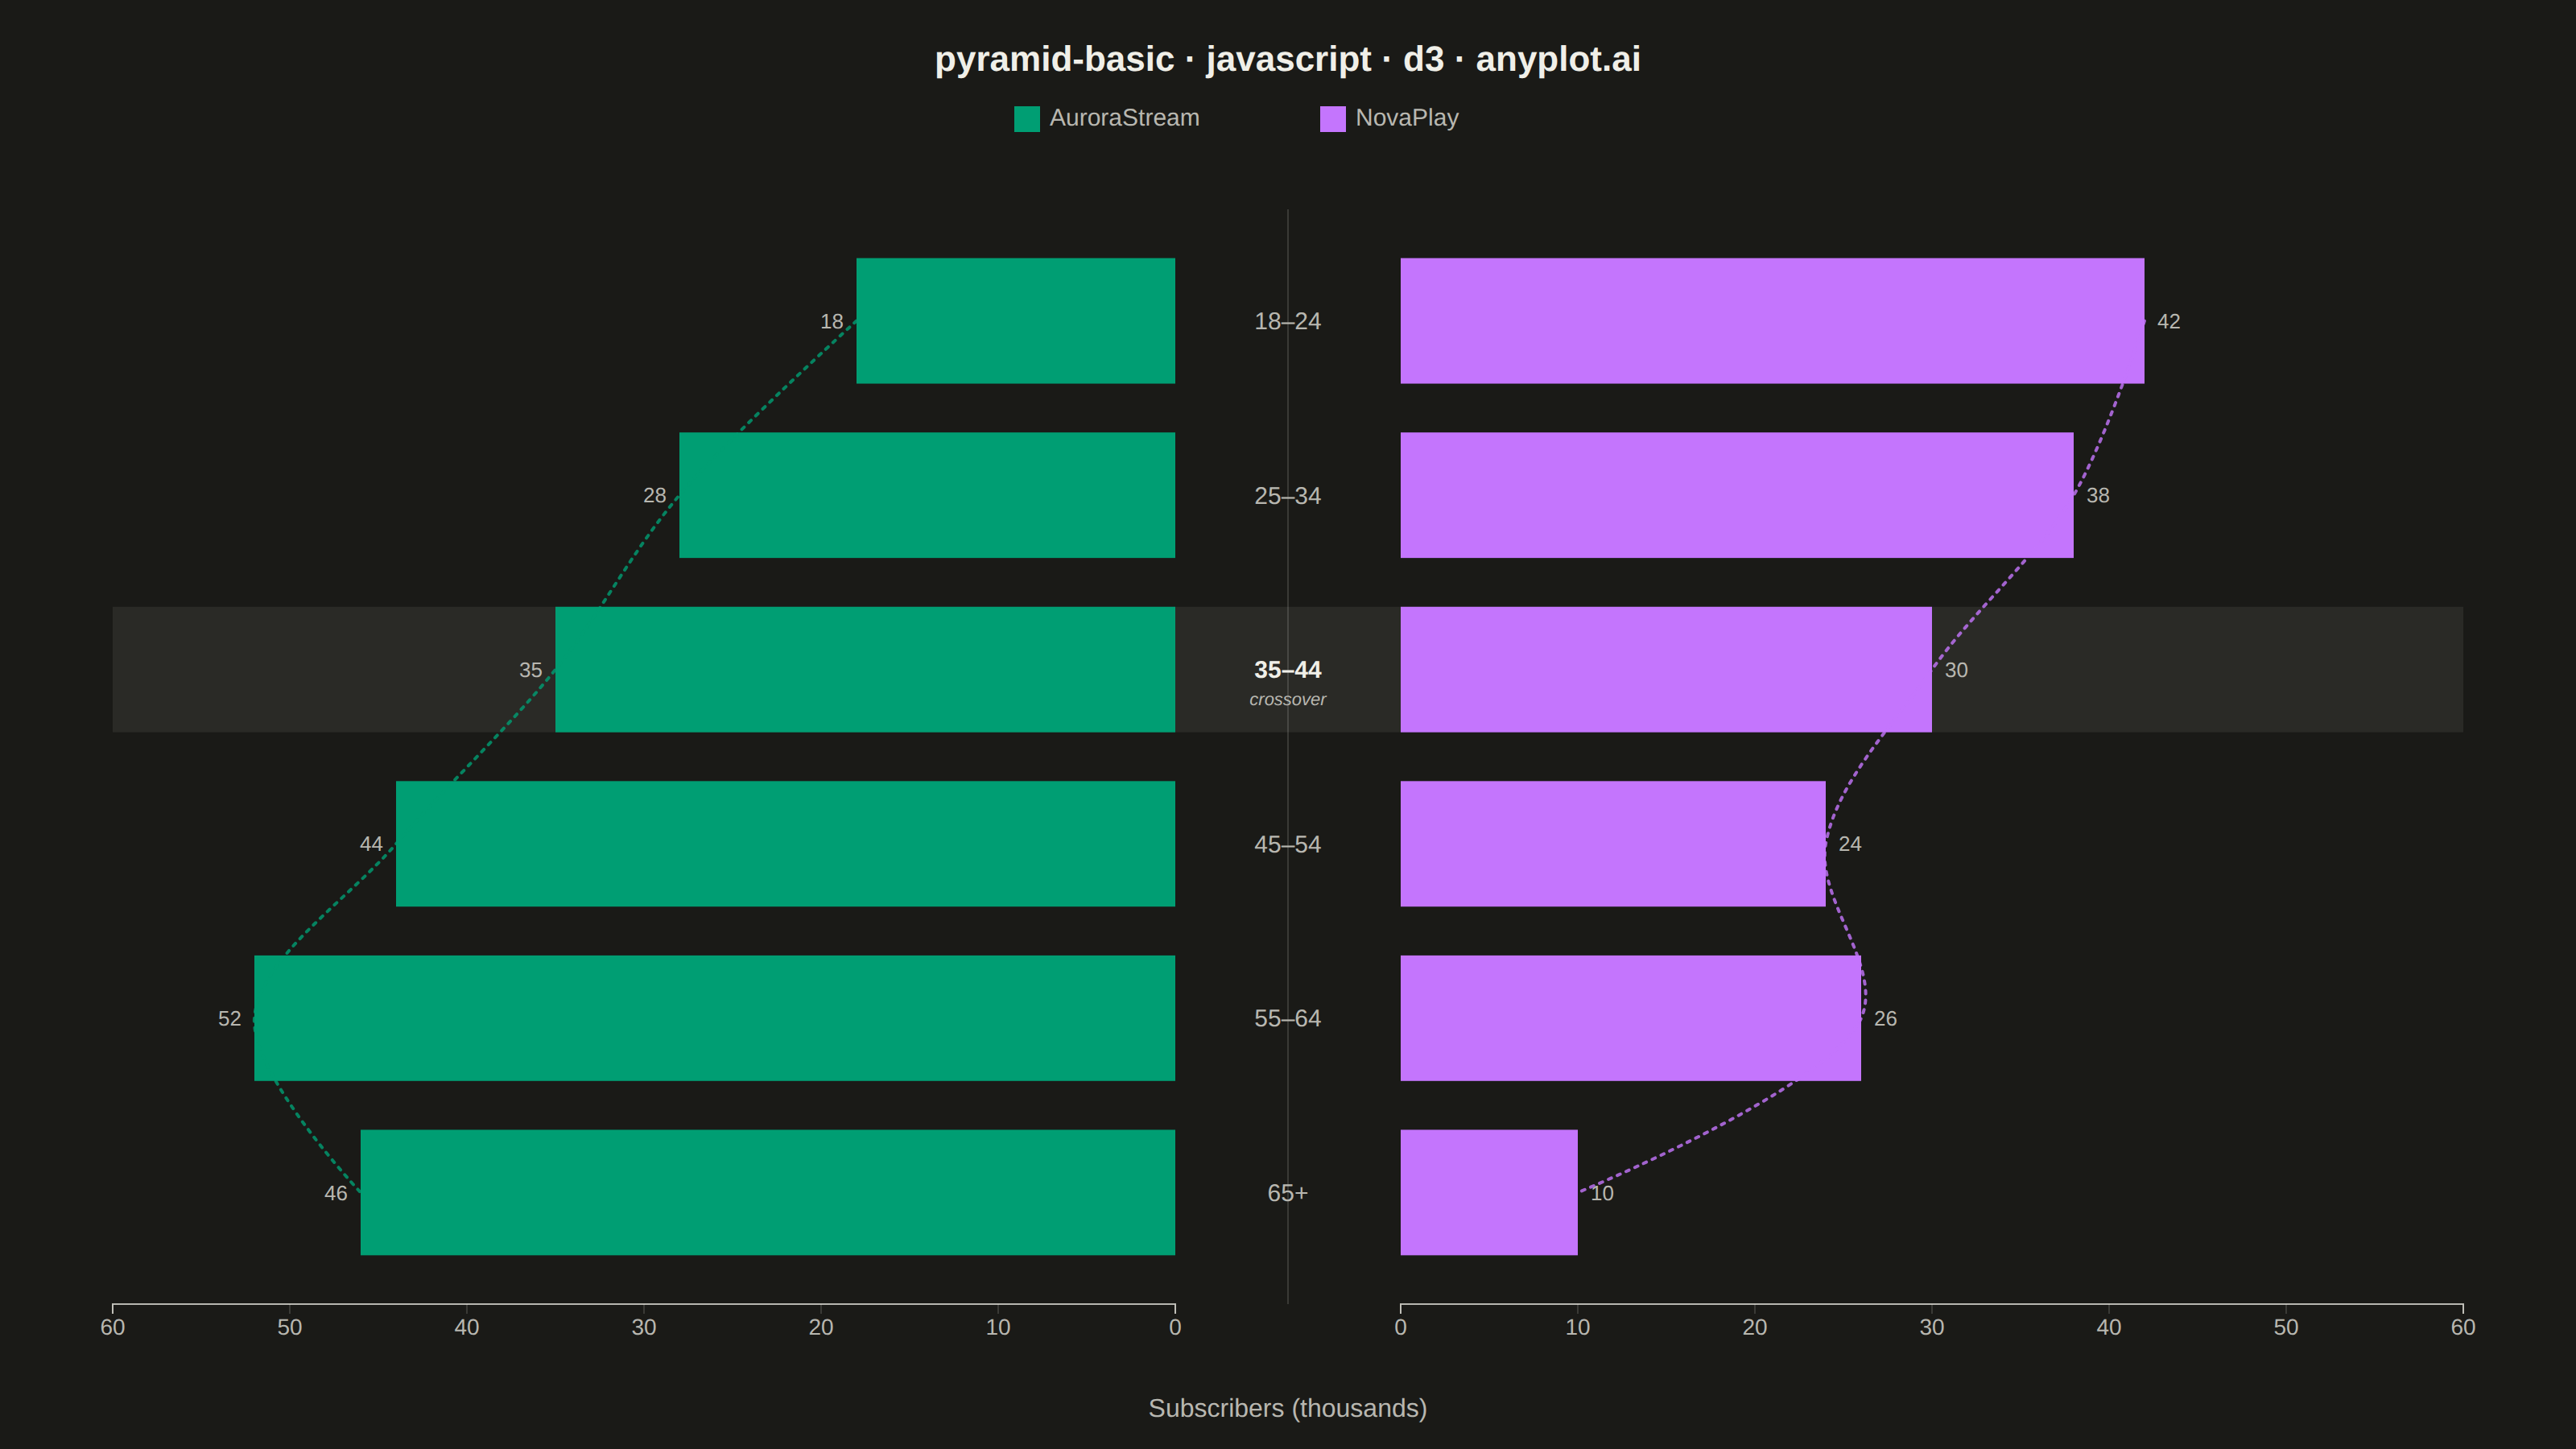
The same plot in 14 other libraries — JavaScript: Chart.js, Apache ECharts, Highcharts, MUI X Charts; Python: Altair, Bokeh, lets-plot, Matplotlib, Plotly, plotnine, Pygal, Seaborn; R: ggplot2; Julia: Makie.jl. Compare all 15 side by side: Basic Pyramid Chart in Python, R, Julia and JavaScript.
A pyramid chart displays two opposing horizontal bar charts that share a central axis, creating a pyramid or butterfly shape. This visualization is ideal for comparing two related metrics across the same categories, revealing asymmetries and patterns in bidirectional data. Most commonly used for population pyramids showing age-gender distributions.
// anyplot.ai
// pyramid-basic: Basic Pyramid Chart
// Library: d3 7.9.0 | JavaScript 22.23.2
// Quality: 96/100 | Created: 2026-09-05

const t = window.ANYPLOT_TOKENS;
const { width, height } = window.ANYPLOT_SIZE;

// Data — streaming-service subscriber counts by age bracket (thousands).
// Two competing services, symmetric axis scale, revealing an age-driven
// crossover in preference. NovaPlay ticks up slightly at 55–64 before its
// final drop — a small real-world irregularity rather than a clean decay.
const ageGroups = [
  { category: "18–24", auroraStream: 18, novaPlay: 42 },
  { category: "25–34", auroraStream: 28, novaPlay: 38 },
  { category: "35–44", auroraStream: 35, novaPlay: 30 },
  { category: "45–54", auroraStream: 44, novaPlay: 24 },
  { category: "55–64", auroraStream: 52, novaPlay: 26 },
  { category: "65+", auroraStream: 46, novaPlay: 10 },
];
const maxValue = 60;
// First bracket where AuroraStream overtakes NovaPlay — called out below.
const crossoverIndex = ageGroups.findIndex((d) => d.auroraStream > d.novaPlay);

// Layout — two mirrored bar areas separated by a gap for center category labels.
const margin = { top: 130, right: 70, bottom: 90, left: 70 };
const innerWidth = width - margin.left - margin.right;
const innerHeight = height - margin.top - margin.bottom;
const centerGap = 140;
const sideWidth = (innerWidth - centerGap) / 2;
const leftX0 = margin.left;
const rightX0 = margin.left + sideWidth + centerGap;
const centerX = margin.left + sideWidth + centerGap / 2;

// Scales
const xLeft = d3.scaleLinear().domain([0, maxValue]).range([sideWidth, 0]);
const xRight = d3.scaleLinear().domain([0, maxValue]).range([0, sideWidth]);
const y = d3
  .scaleBand()
  .domain(ageGroups.map((d) => d.category))
  .range([0, innerHeight])
  .padding(0.28);

// SVG mount
const svg = d3.select("#container").append("svg").attr("width", width).attr("height", height);

// Crossover row highlight — the bracket where AuroraStream first overtakes
// NovaPlay, drawn behind everything else so it reads as a subtle backdrop.
const crossoverCategory = ageGroups[crossoverIndex].category;
svg
  .append("rect")
  .attr("x", leftX0)
  .attr("y", margin.top + y(crossoverCategory))
  .attr("width", innerWidth)
  .attr("height", y.bandwidth())
  .attr("fill", t.grid)
  .attr("opacity", 0.5);

// Center divider
svg
  .append("line")
  .attr("x1", centerX)
  .attr("x2", centerX)
  .attr("y1", margin.top)
  .attr("y2", margin.top + innerHeight)
  .attr("stroke", t.grid)
  .attr("stroke-width", 1);

// Left bars (AuroraStream)
svg
  .selectAll(".bar-left")
  .data(ageGroups)
  .join("rect")
  .attr("x", (d) => leftX0 + xLeft(d.auroraStream))
  .attr("y", (d) => margin.top + y(d.category))
  .attr("width", (d) => sideWidth - xLeft(d.auroraStream))
  .attr("height", y.bandwidth())
  .attr("fill", t.palette[0]);

// Right bars (NovaPlay)
svg
  .selectAll(".bar-right")
  .data(ageGroups)
  .join("rect")
  .attr("x", rightX0)
  .attr("y", (d) => margin.top + y(d.category))
  .attr("width", (d) => xRight(d.novaPlay))
  .attr("height", y.bandwidth())
  .attr("fill", t.palette[1]);

// Trend lines through each bar's tip — a d3-shape line generator with a
// Catmull-Rom curve, distinct from a plain bar/axis composition and doubling
// as a visual thread that carries the eye through the age-driven crossover.
const bandCenter = (d) => margin.top + y(d.category) + y.bandwidth() / 2;
const lineGen = d3.line().curve(d3.curveCatmullRom.alpha(0.5));
svg
  .append("path")
  .attr("d", lineGen(ageGroups.map((d) => [leftX0 + xLeft(d.auroraStream), bandCenter(d)])))
  .attr("fill", "none")
  .attr("stroke", t.palette[0])
  .attr("stroke-width", 2)
  .attr("stroke-dasharray", "2,4")
  .attr("stroke-linecap", "round")
  .attr("opacity", 0.8);
svg
  .append("path")
  .attr("d", lineGen(ageGroups.map((d) => [rightX0 + xRight(d.novaPlay), bandCenter(d)])))
  .attr("fill", "none")
  .attr("stroke", t.palette[1])
  .attr("stroke-width", 2)
  .attr("stroke-dasharray", "2,4")
  .attr("stroke-linecap", "round")
  .attr("opacity", 0.8);

// Value labels at each bar's tip.
svg
  .selectAll(".value-label-left")
  .data(ageGroups)
  .join("text")
  .attr("x", (d) => leftX0 + xLeft(d.auroraStream) - 8)
  .attr("y", bandCenter)
  .attr("dy", "0.35em")
  .attr("text-anchor", "end")
  .attr("fill", t.inkSoft)
  .style("font-size", "13px")
  .text((d) => d.auroraStream);
svg
  .selectAll(".value-label-right")
  .data(ageGroups)
  .join("text")
  .attr("x", (d) => rightX0 + xRight(d.novaPlay) + 8)
  .attr("y", bandCenter)
  .attr("dy", "0.35em")
  .attr("text-anchor", "start")
  .attr("fill", t.inkSoft)
  .style("font-size", "13px")
  .text((d) => d.novaPlay);

// Center category labels — the crossover bracket is emphasized (bolder,
// full-ink) so the point where AuroraStream overtakes NovaPlay reads clearly.
svg
  .selectAll(".category-label")
  .data(ageGroups)
  .join("text")
  .attr("x", centerX)
  .attr("y", bandCenter)
  .attr("dy", "0.35em")
  .attr("text-anchor", "middle")
  .attr("fill", (d) => (d.category === crossoverCategory ? t.ink : t.inkSoft))
  .style("font-size", "15px")
  .style("font-weight", (d) => (d.category === crossoverCategory ? "700" : "400"))
  .text((d) => d.category);

// Small caption under the crossover category naming the story explicitly.
svg
  .append("text")
  .attr("x", centerX)
  .attr("y", margin.top + y(crossoverCategory) + y.bandwidth() / 2 + 22)
  .attr("text-anchor", "middle")
  .attr("fill", t.inkSoft)
  .style("font-size", "11px")
  .style("font-style", "italic")
  .text("crossover");

// Value axes (bottom, mirrored)
const leftAxis = svg
  .append("g")
  .attr("transform", `translate(${leftX0},${margin.top + innerHeight})`)
  .call(d3.axisBottom(xLeft).ticks(5));
const rightAxis = svg
  .append("g")
  .attr("transform", `translate(${rightX0},${margin.top + innerHeight})`)
  .call(d3.axisBottom(xRight).ticks(5));
for (const axis of [leftAxis, rightAxis]) {
  axis.selectAll("text").attr("fill", t.inkSoft).style("font-size", "14px");
  axis.selectAll("line").attr("stroke", t.grid);
  axis.select(".domain").attr("stroke", t.inkSoft);
}

// Axis title
svg
  .append("text")
  .attr("x", margin.left + innerWidth / 2)
  .attr("y", height - 20)
  .attr("text-anchor", "middle")
  .attr("fill", t.inkSoft)
  .style("font-size", "16px")
  .text("Subscribers (thousands)");

// Legend
const legend = svg.append("g").attr("transform", `translate(${margin.left + innerWidth / 2}, 78)`);
const legendItems = [
  { label: "AuroraStream", color: t.palette[0], dx: -170 },
  { label: "NovaPlay", color: t.palette[1], dx: 20 },
];
for (const item of legendItems) {
  legend
    .append("rect")
    .attr("x", item.dx)
    .attr("y", -12)
    .attr("width", 16)
    .attr("height", 16)
    .attr("fill", item.color);
  legend
    .append("text")
    .attr("x", item.dx + 22)
    .attr("y", 0)
    .attr("fill", t.inkSoft)
    .style("font-size", "15px")
    .text(item.label);
}

// Title
svg
  .append("text")
  .attr("x", width / 2)
  .attr("y", 44)
  .attr("text-anchor", "middle")
  .attr("fill", t.ink)
  .style("font-size", "22px")
  .style("font-weight", "600")
  .text("pyramid-basic · javascript · d3 · anyplot.ai");
Runnable source as JSON, for any HTTP client: https://api.anyplot.ai/specs/pyramid-basic/d3/code. Any spec id and library id listed in llms-full.txt fit the same URL shape; every URL below is complete and callable.
{
  "spec_id": "pyramid-basic",
  "language": "javascript",
  "library": "d3",
  "page": "https://anyplot.ai/pyramid-basic/javascript/d3",
  "hub": "https://anyplot.ai/pyramid-basic",
  "code_json": "https://api.anyplot.ai/specs/pyramid-basic/d3/code",
  "spec_json": "https://api.anyplot.ai/specs/pyramid-basic",
  "render_light_png": "https://storage.googleapis.com/anyplot-images/plots/pyramid-basic/javascript/d3/plot-light.png",
  "render_dark_png": "https://storage.googleapis.com/anyplot-images/plots/pyramid-basic/javascript/d3/plot-dark.png",
  "interactive_light_html": "https://storage.googleapis.com/anyplot-images/plots/pyramid-basic/javascript/d3/plot-light.html",
  "interactive_dark_html": "https://storage.googleapis.com/anyplot-images/plots/pyramid-basic/javascript/d3/plot-dark.html",
  "quality_score": 96.0,
  "license": "MIT",
  "guide": "https://anyplot.ai/llms.txt"
}
Part of Basic Pyramid Chart on anyplot.ai.