The same plot in 14 other libraries — JavaScript: Chart.js, D3.js, Apache ECharts, Highcharts; Python: Altair, Bokeh, lets-plot, Matplotlib, Plotly, plotnine, Pygal, Seaborn; R: ggplot2; Julia: Makie.jl. Compare all 15 side by side: Basic Pyramid Chart in Python, R, Julia and JavaScript.
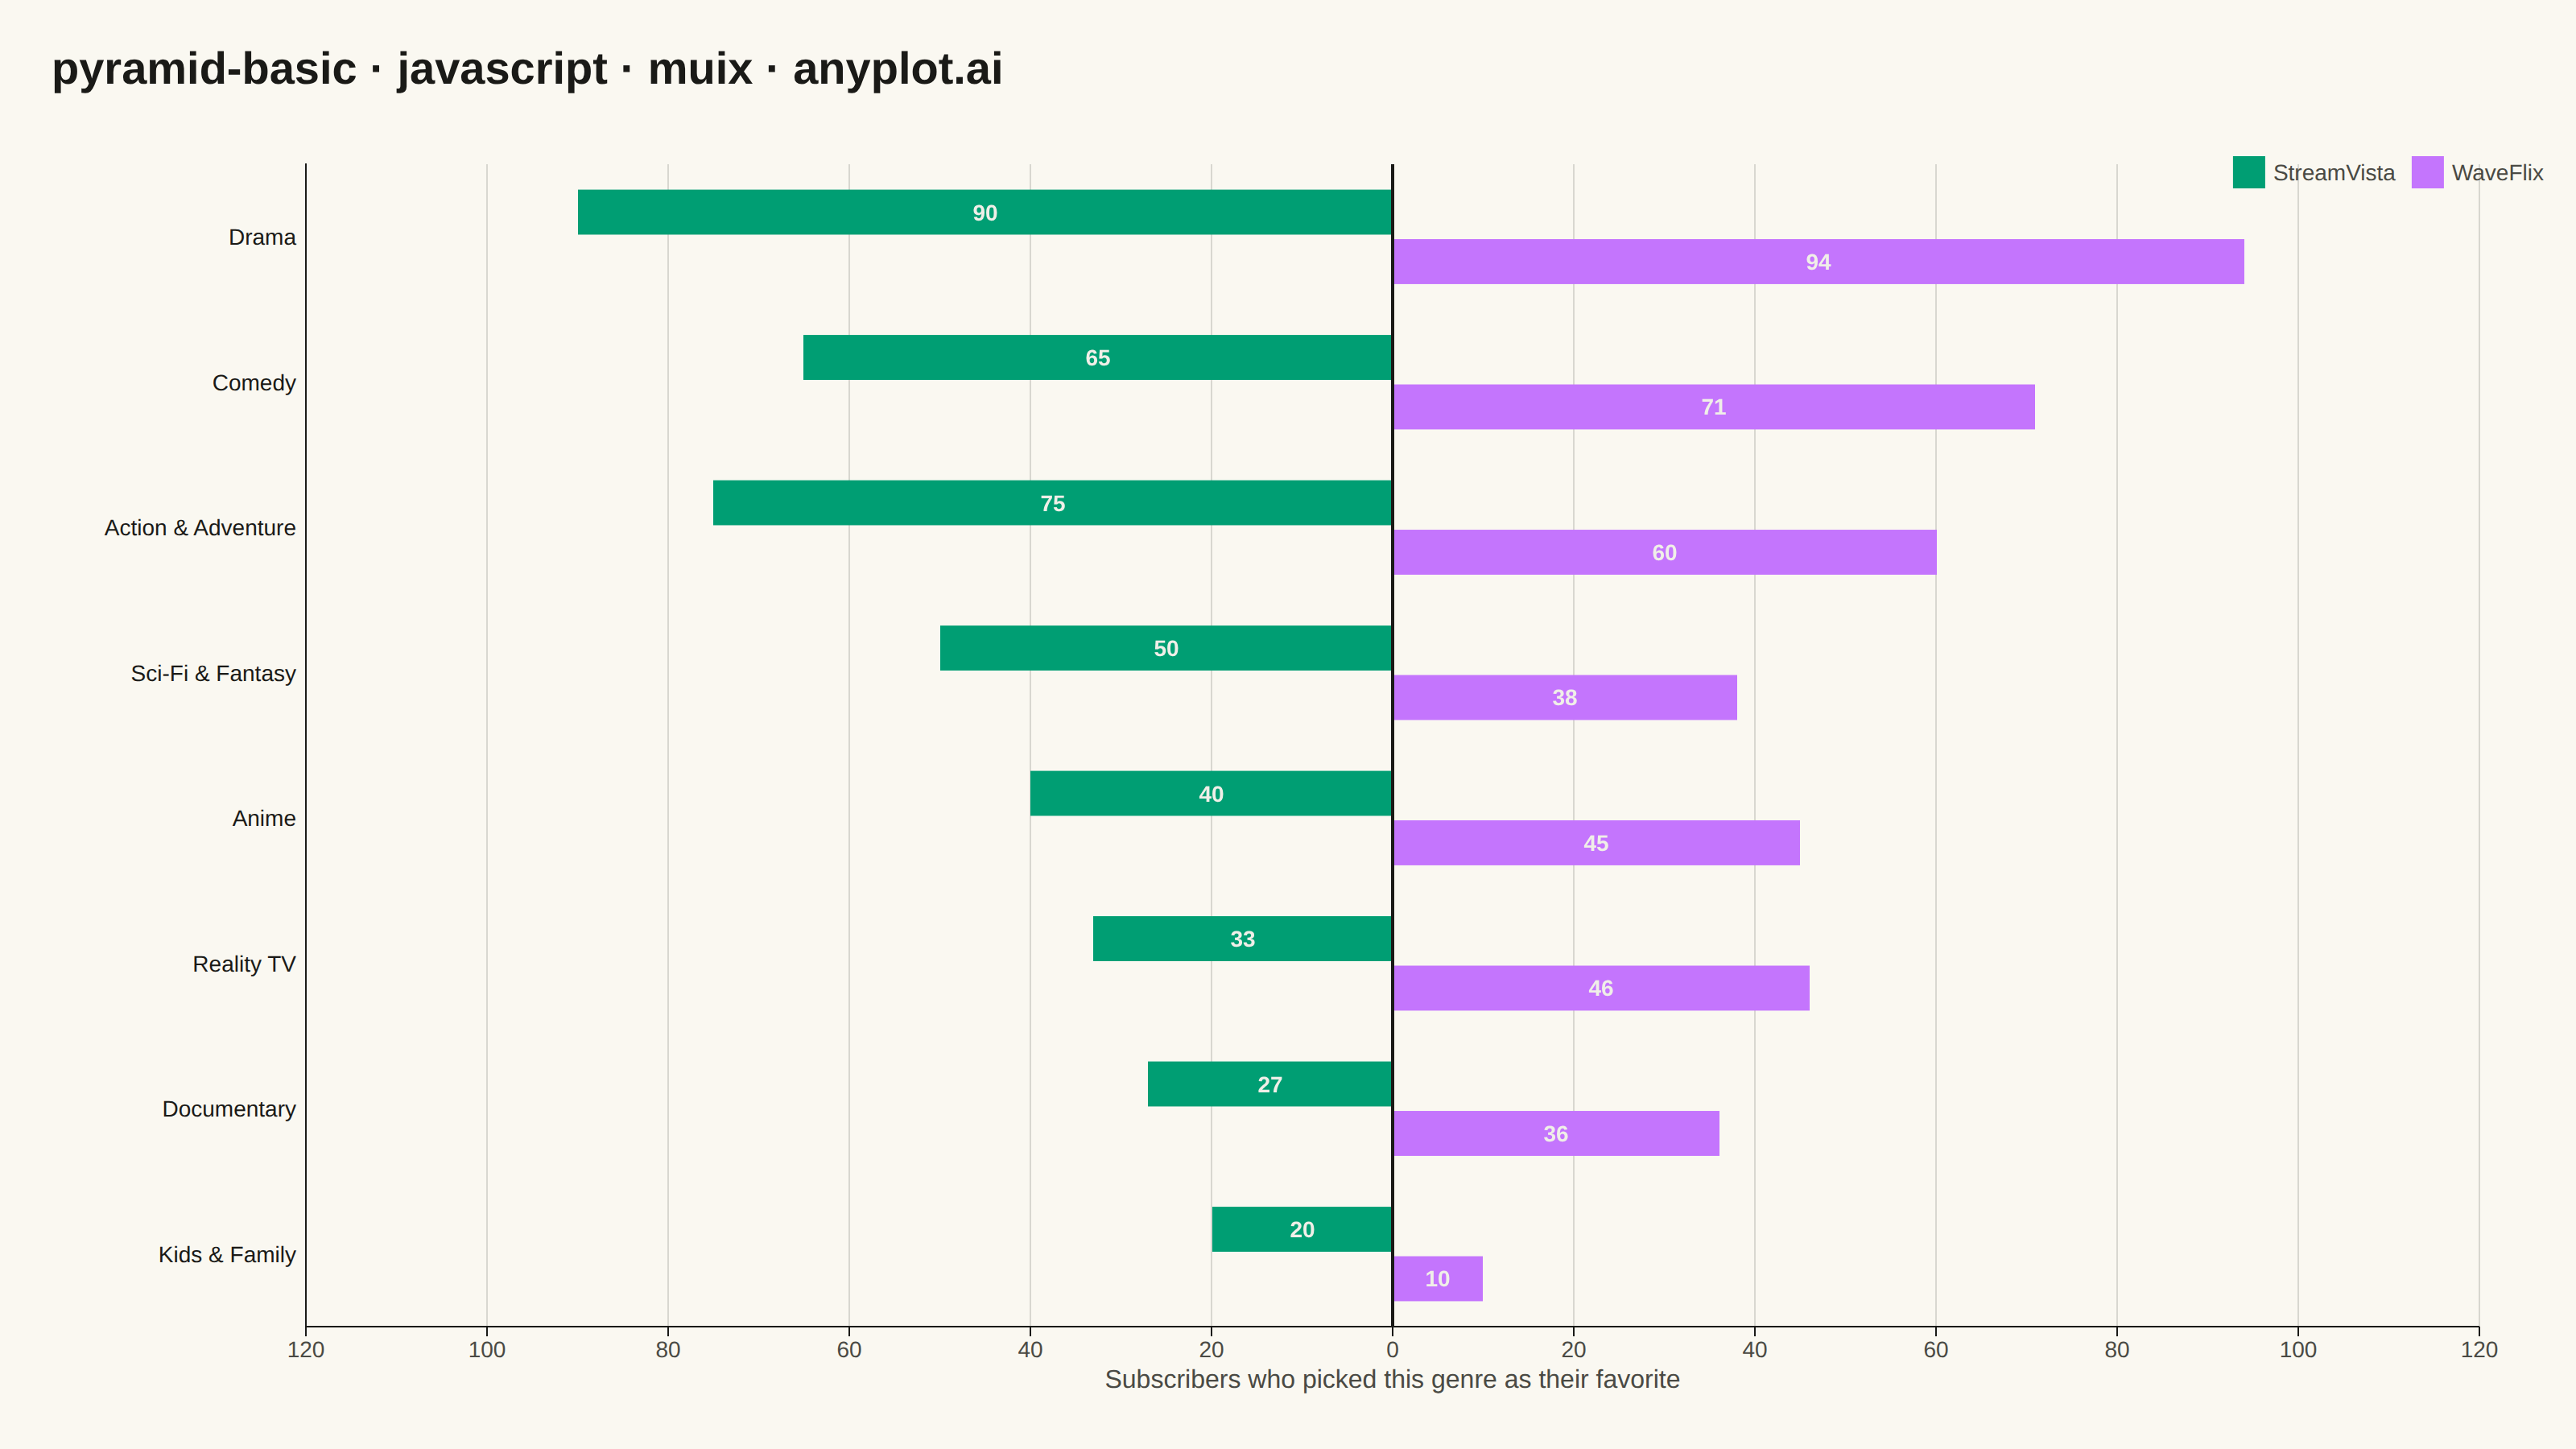
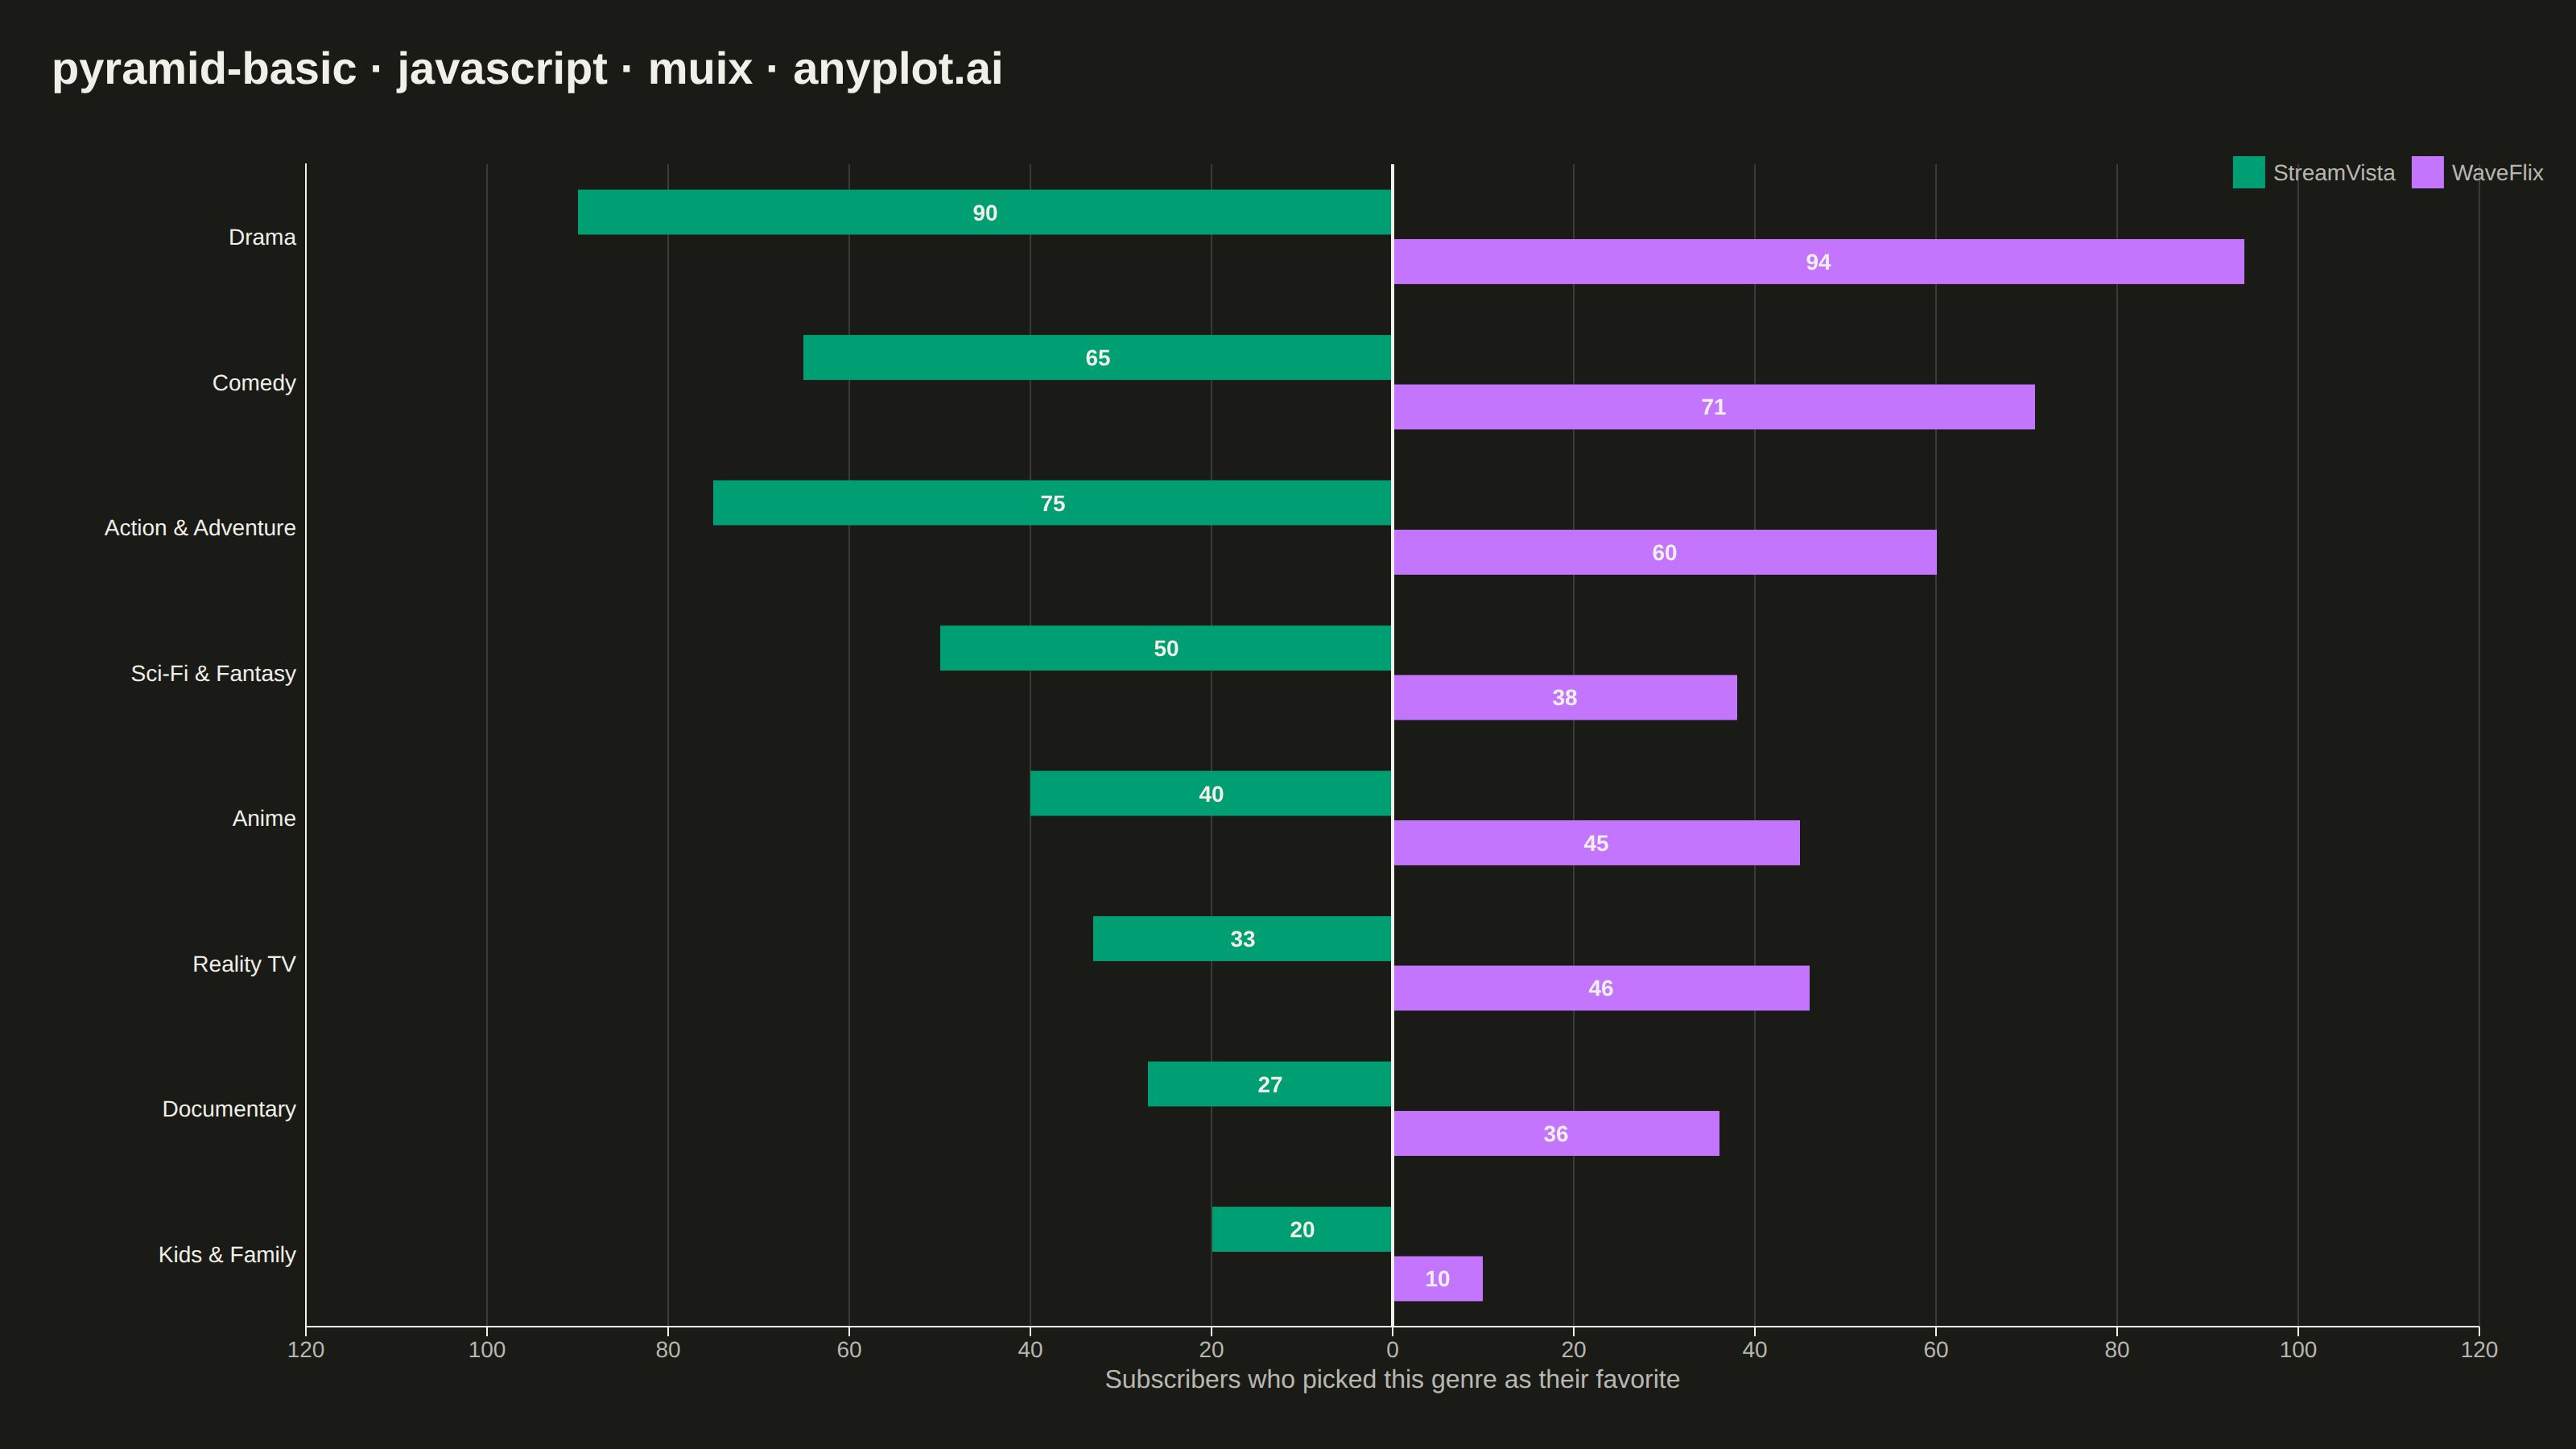
A pyramid chart displays two opposing horizontal bar charts that share a central axis, creating a pyramid or butterfly shape. This visualization is ideal for comparing two related metrics across the same categories, revealing asymmetries and patterns in bidirectional data. Most commonly used for population pyramids showing age-gender distributions.
// anyplot.ai
// pyramid-basic: Basic Pyramid Chart
// Library: muix 7.29.1 | JavaScript 22.23.2
// Quality: 89/100 | Created: 2026-09-05
import { BarChart } from "@mui/x-charts/BarChart";
import { ChartsReferenceLine } from "@mui/x-charts/ChartsReferenceLine";
import Box from "@mui/material/Box";
import Typography from "@mui/material/Typography";

const t = window.ANYPLOT_TOKENS;

// --- Data (in-memory, deterministic): streaming-service genre preference ----
// Survey of 400 subscribers per service, asked which genre they watch most.
// Each category holds two independent counts (not a signed net score) --
// Service A always extends left, Service B always extends right, sharing the
// zero baseline as the pyramid's central axis. Sorted by combined magnitude
// (descending) so the chart tapers into a classic pyramid silhouette.
const genreRows = [
  { name: "Action & Adventure", streamVista: 75, waveFlix: 60 },
  { name: "Drama", streamVista: 90, waveFlix: 94 },
  { name: "Comedy", streamVista: 65, waveFlix: 71 },
  { name: "Sci-Fi & Fantasy", streamVista: 50, waveFlix: 38 },
  { name: "Reality TV", streamVista: 33, waveFlix: 46 },
  { name: "Anime", streamVista: 40, waveFlix: 45 },
  { name: "Documentary", streamVista: 27, waveFlix: 36 },
  { name: "Kids & Family", streamVista: 20, waveFlix: 10 },
].sort((a, b) => b.streamVista + b.waveFlix - (a.streamVista + a.waveFlix));

const genres = genreRows.map((r) => r.name);
const streamVista = genreRows.map((r) => r.streamVista);
const waveFlix = genreRows.map((r) => r.waveFlix);

// One shared stack per row: negative values (Service A, negated below) land
// left of zero, positive values (Service B) land right -- MUI X's default
// `stackOffset: "diverging"` for mixed-sign stacks on a shared stackId.
const leftData = streamVista.map((v) => -v);
const rightData = waveFlix;

const axisLimit = Math.ceil((Math.max(...streamVista, ...waveFlix) + 10) / 20) * 20;
// Explicit tick positions every 20 units -- the default continuous-scale tick
// generator produced 35 ticks (every 10) across this range, which is too
// dense for mobile-scale legibility.
const xTicks = [];
for (let v = -axisLimit; v <= axisLimit; v += 20) xTicks.push(v);

export default function Chart() {
  const W = window.ANYPLOT_SIZE.width;
  const H = window.ANYPLOT_SIZE.height;
  const CHART_TOP = 82;

  return (
    <Box sx={{ position: "relative", width: W, height: H, bgcolor: t.pageBg }}>
      <Box sx={{ position: "absolute", top: 22, left: 32, right: 32 }}>
        <Typography sx={{ color: t.ink, fontSize: 28, fontWeight: 600 }}>
          pyramid-basic · javascript · muix · anyplot.ai
        </Typography>
      </Box>

      <Box sx={{ position: "absolute", top: CHART_TOP, left: 0, right: 0, bottom: 0 }}>
        <BarChart
          width={W}
          height={H - CHART_TOP}
          layout="horizontal"
          skipAnimation
          barLabel={(item) => (item.value === null ? null : `${Math.abs(item.value)}`)}
          series={[
            {
              id: "streamvista",
              stackId: "genre",
              data: leftData,
              label: "StreamVista",
              color: t.palette[0],
              valueFormatter: (v) => (v === null ? "" : `${Math.abs(v)} viewers`),
            },
            {
              id: "waveflix",
              stackId: "genre",
              data: rightData,
              label: "WaveFlix",
              color: t.palette[1],
              valueFormatter: (v) => (v === null ? "" : `${v} viewers`),
            },
          ]}
          xAxis={[
            {
              id: "value",
              min: -axisLimit,
              max: axisLimit,
              label: "Subscribers who picked this genre as their favorite",
              labelStyle: { fontSize: 16, fill: t.inkSoft },
              tickLabelStyle: { fontSize: 14, fill: t.inkSoft },
              tickInterval: xTicks,
              valueFormatter: (v) => `${Math.abs(v)}`,
            },
          ]}
          yAxis={[
            {
              scaleType: "band",
              data: genres,
              tickLabelStyle: { fontSize: 14, fill: t.ink },
              disableTicks: true,
              categoryGapRatio: 0.35,
            },
          ]}
          margin={{ top: 20, right: 60, bottom: 76, left: 190 }}
          grid={{ vertical: true }}
          slotProps={{
            legend: {
              position: { vertical: "top", horizontal: "right" },
              labelStyle: { fontSize: 14, fill: t.inkSoft },
            },
          }}
          sx={{
            "& .MuiBarLabel-root": {
              fill: "#F0EFE8",
              fontSize: "14px",
              fontWeight: 600,
            },
            "& .MuiChartsAxis-line": { stroke: t.inkSoft },
            "& .MuiChartsGrid-line": { stroke: t.grid },
          }}
        >
          <ChartsReferenceLine x={0} axisId="value" lineStyle={{ stroke: t.ink, strokeWidth: 2 }} />
        </BarChart>
      </Box>
    </Box>
  );
}
Runnable source as JSON, for any HTTP client: https://api.anyplot.ai/specs/pyramid-basic/muix/code. Any spec id and library id listed in llms-full.txt fit the same URL shape; every URL below is complete and callable.
{
  "spec_id": "pyramid-basic",
  "language": "javascript",
  "library": "muix",
  "page": "https://anyplot.ai/pyramid-basic/javascript/muix",
  "hub": "https://anyplot.ai/pyramid-basic",
  "code_json": "https://api.anyplot.ai/specs/pyramid-basic/muix/code",
  "spec_json": "https://api.anyplot.ai/specs/pyramid-basic",
  "render_light_png": "https://storage.googleapis.com/anyplot-images/plots/pyramid-basic/javascript/muix/plot-light.png",
  "render_dark_png": "https://storage.googleapis.com/anyplot-images/plots/pyramid-basic/javascript/muix/plot-dark.png",
  "interactive_light_html": "https://storage.googleapis.com/anyplot-images/plots/pyramid-basic/javascript/muix/plot-light.html",
  "interactive_dark_html": "https://storage.googleapis.com/anyplot-images/plots/pyramid-basic/javascript/muix/plot-dark.html",
  "quality_score": 89.0,
  "license": "MIT",
  "guide": "https://anyplot.ai/llms.txt"
}
Part of Basic Pyramid Chart on anyplot.ai.