The same plot in 14 other libraries — JavaScript: Chart.js, Apache ECharts, Highcharts, MUI X Charts; Python: Altair, Bokeh, lets-plot, Matplotlib, Plotly, plotnine, Pygal, Seaborn; R: ggplot2; Julia: Makie.jl. Compare all 15 side by side: Recurrence Plot for Nonlinear Time Series in Python, R, Julia and JavaScript.
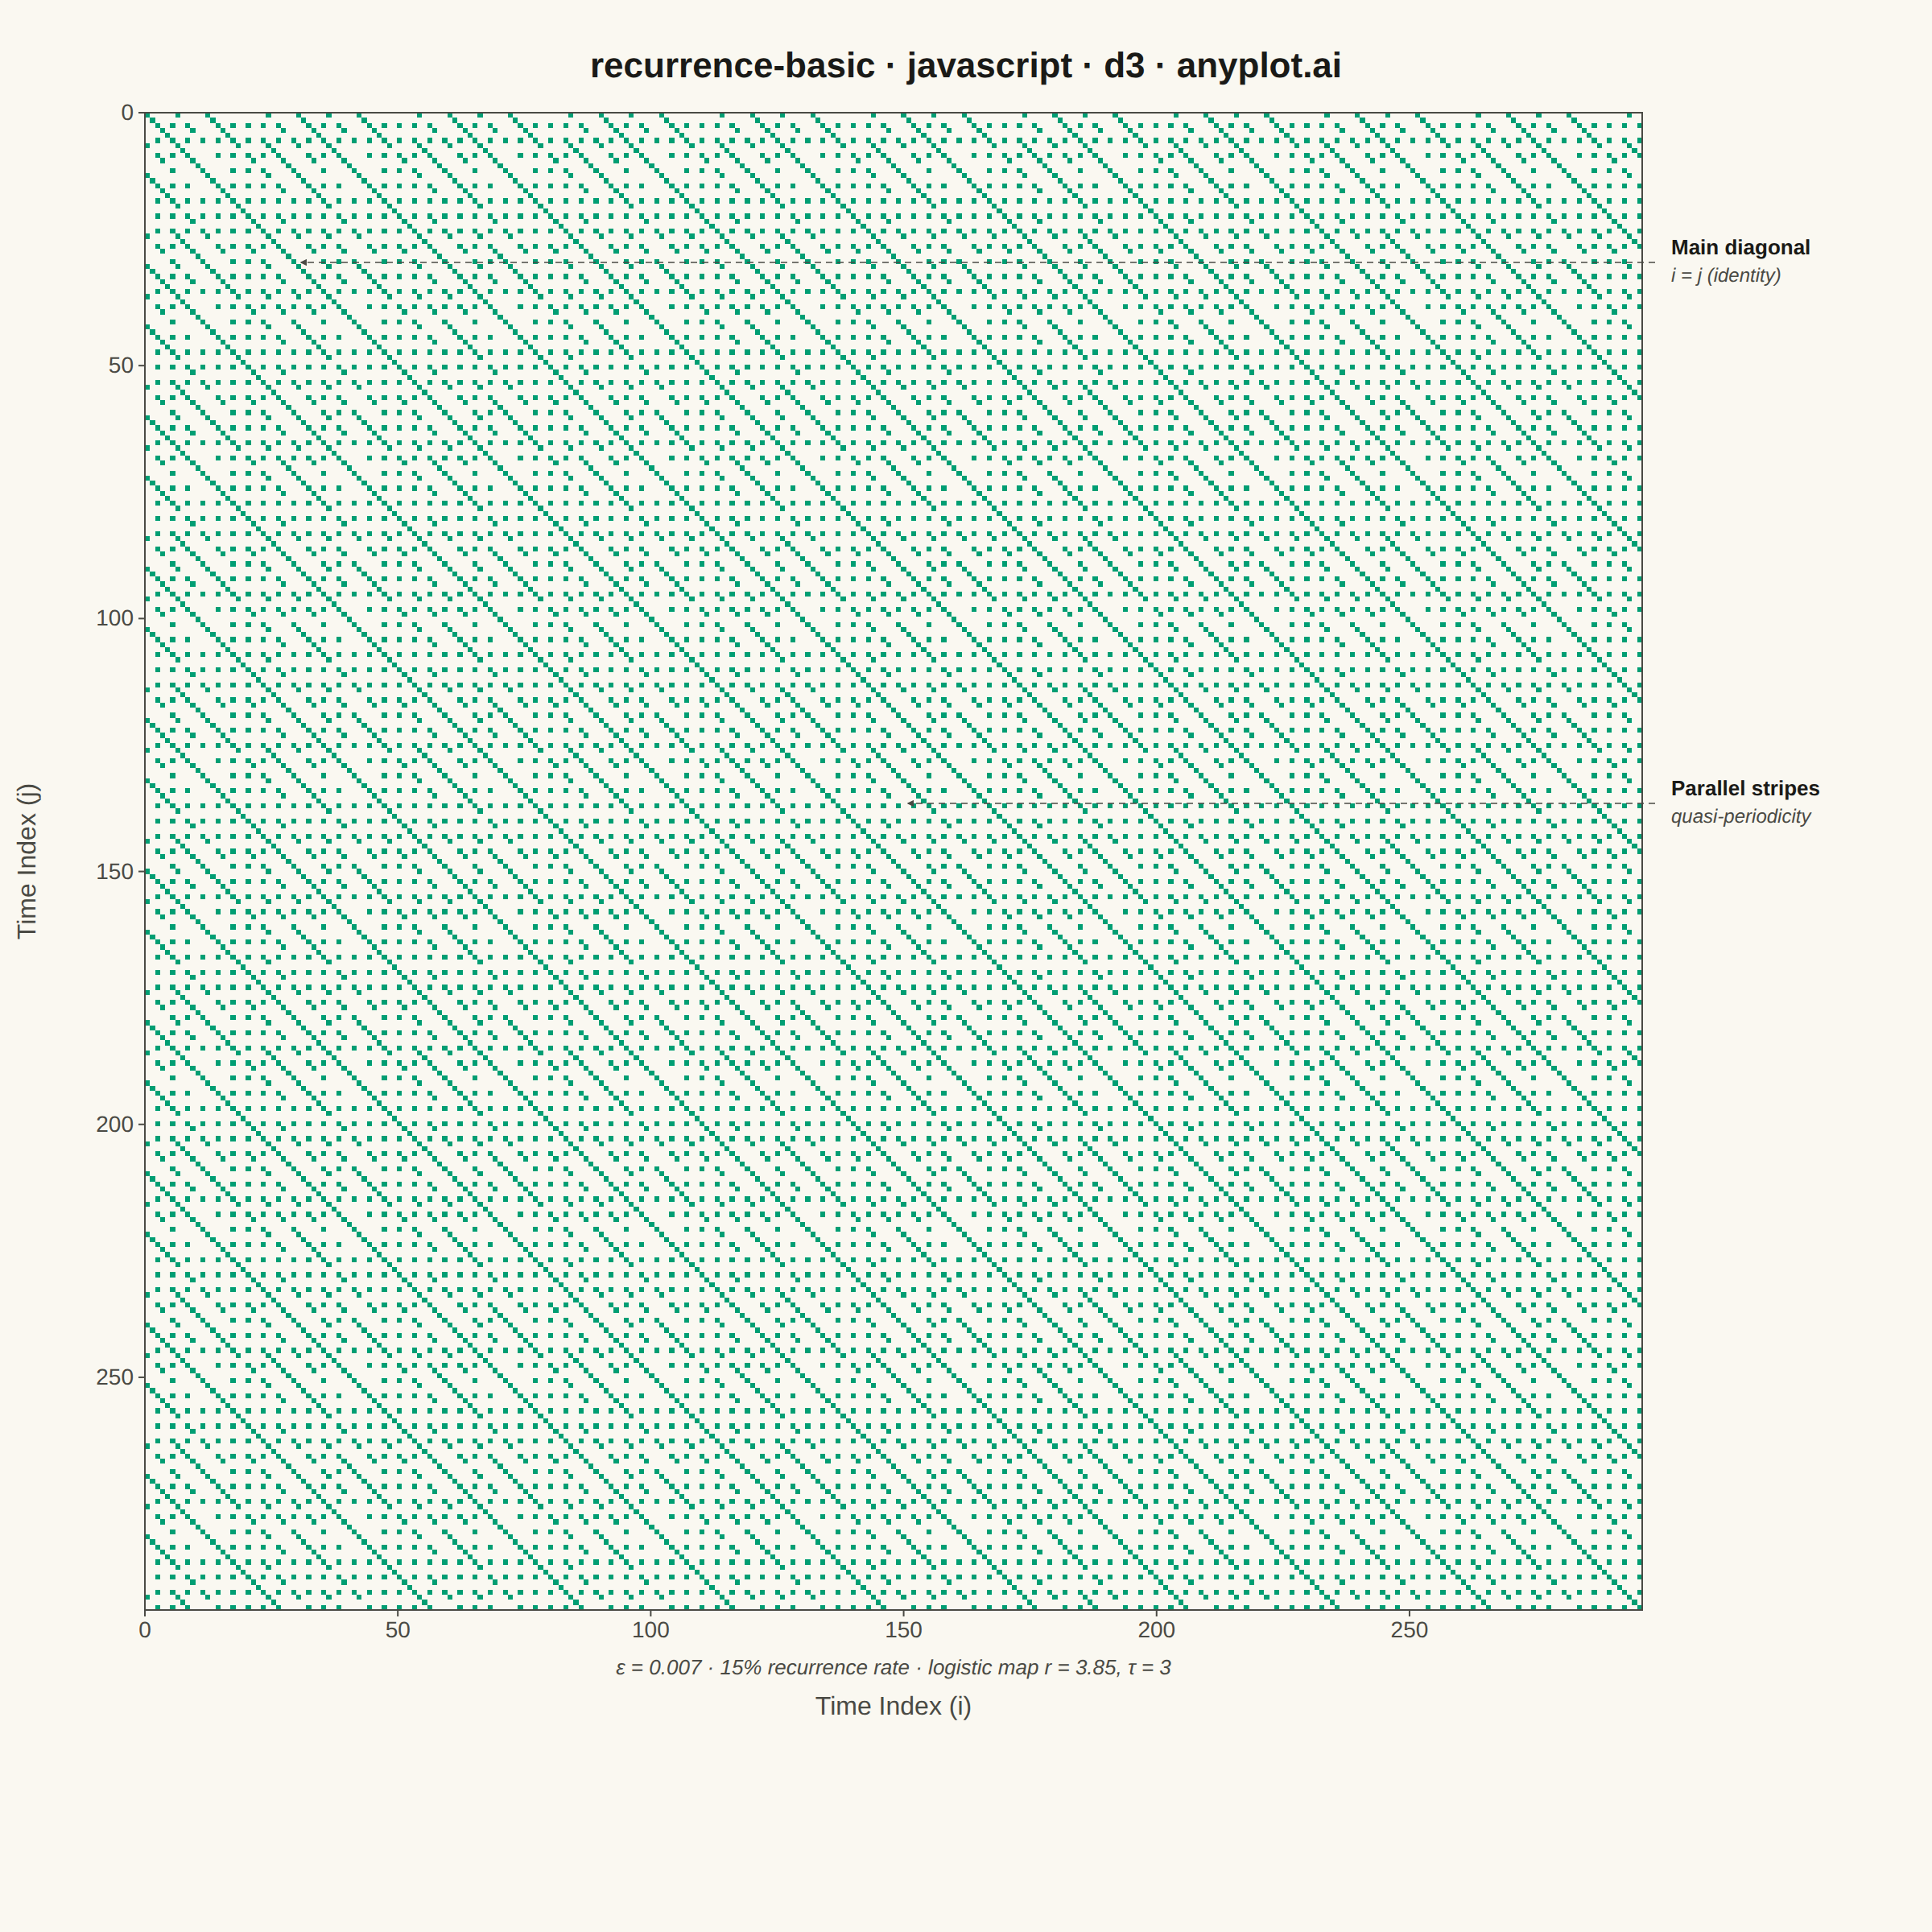
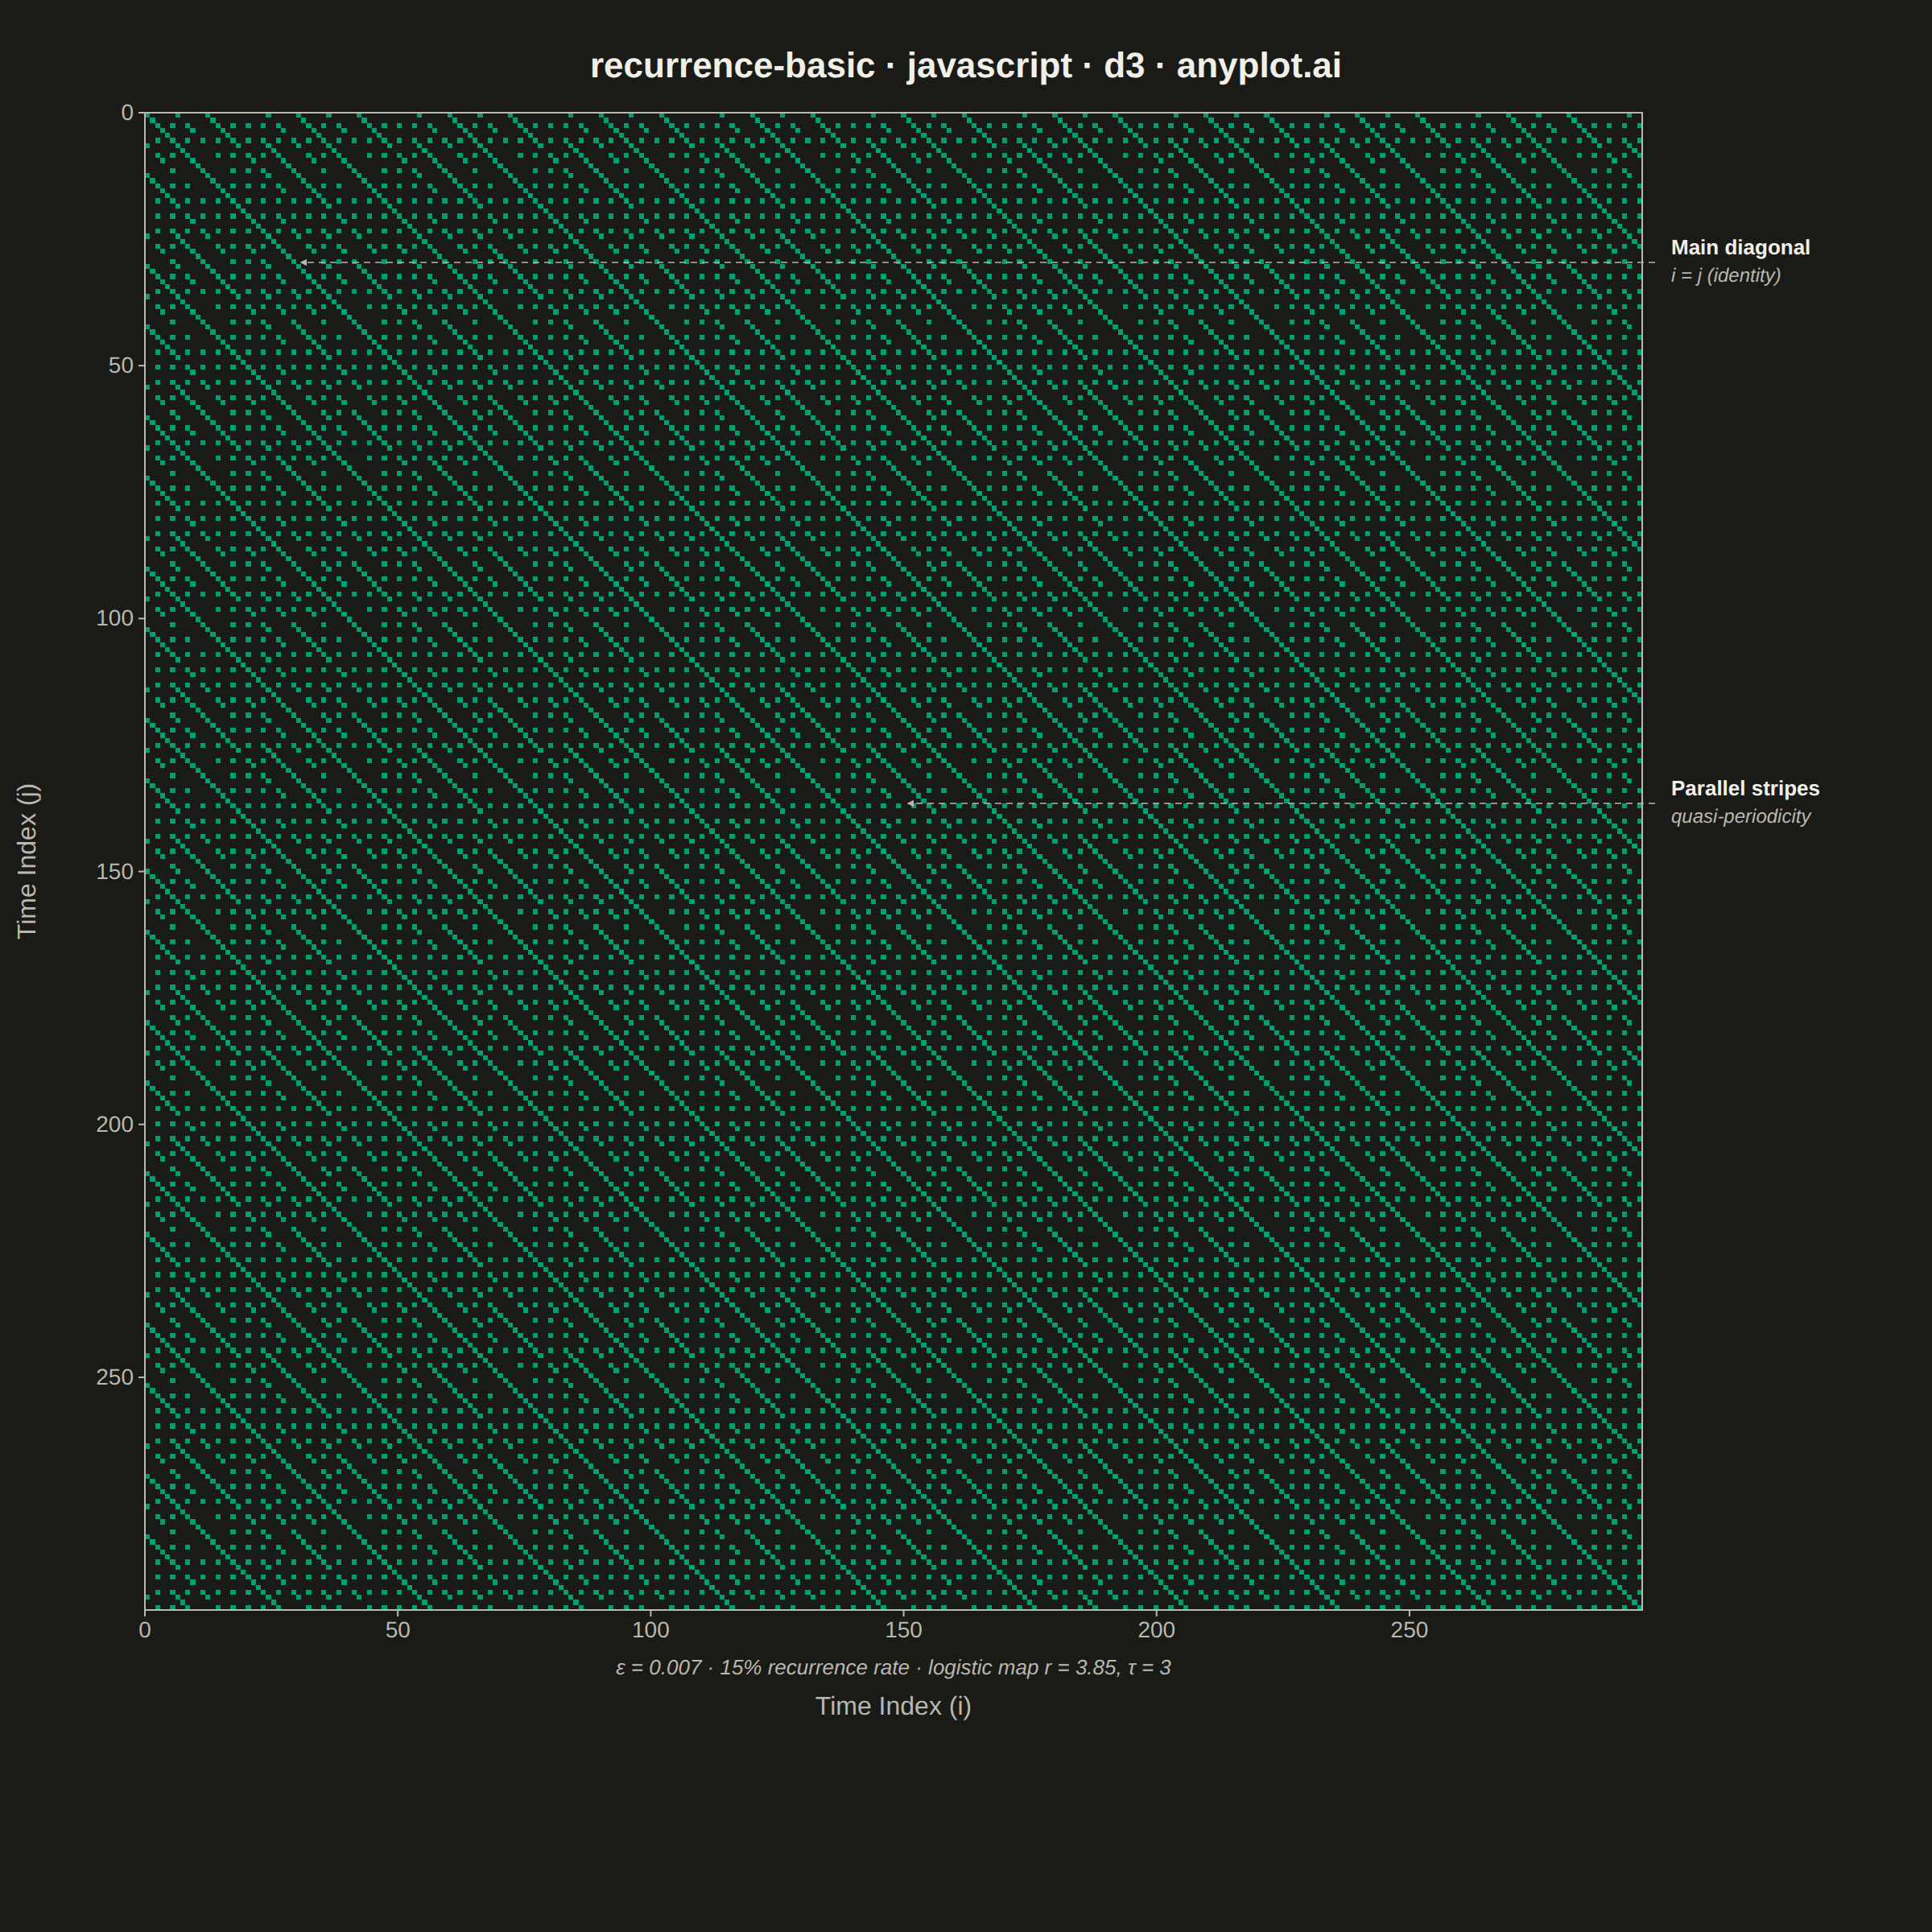
A recurrence plot is a binary or distance-based matrix visualization that reveals when states in a dynamical system recur over time. Both axes represent time indices, and a point is plotted at position (i, j) when the system state at time i is sufficiently similar to the state at time j (distance below a threshold). The resulting symmetric matrix exposes hidden structure in complex, nonlinear dynamics — diagonal lines indicate determinism, vertical/horizontal lines reveal laminar states, and block structures signal regime changes.
// anyplot.ai
// recurrence-basic: Recurrence Plot for Nonlinear Time Series
// Library: d3 7.9.0 | JavaScript 22.22.3
// Quality: 93/100 | Created: 2026-06-10

//# anyplot-orientation: square

const t = window.ANYPLOT_TOKENS;
const { width, height } = window.ANYPLOT_SIZE;

// Extended right and bottom margins for structural annotations
const margin = { top: 70, right: 180, bottom: 200, left: 90 };
const iw = width - margin.left - margin.right;   // 930 (square plot area)
const ih = height - margin.top - margin.bottom;  // 930

// --- Data: logistic map (deterministic, r=3.85 → chaotic regime) ----------
const R = 3.85, TAU = 3, N_STEPS = 350, N_BURN = 50;
const xs = new Array(N_STEPS);
xs[0] = 0.5;
for (let k = 1; k < N_STEPS; k++) xs[k] = R * xs[k - 1] * (1 - xs[k - 1]);

const series = xs.slice(N_BURN);      // 300 post-transient values
const M = series.length - TAU;        // 297 embedded points

// Time-delay embedding: e[i] = [x(i), x(i + TAU)]
const emb = new Array(M);
for (let i = 0; i < M; i++) emb[i] = [series[i], series[i + TAU]];

// Euclidean distance matrix — collect upper triangle for threshold
const dist = Array.from({ length: M }, () => new Float32Array(M));
const upperD = [];
for (let i = 0; i < M; i++) {
  for (let j = i + 1; j < M; j++) {
    const d = Math.hypot(emb[i][0] - emb[j][0], emb[i][1] - emb[j][1]);
    dist[i][j] = dist[j][i] = d;
    upperD.push(d);
  }
}
upperD.sort((a, b) => a - b);
const eps = upperD[Math.floor(upperD.length * 0.15)];  // ~15% recurrence rate

// --- Recurrence matrix → offscreen canvas → SVG image ---------------------
const offCanvas = document.createElement("canvas");
offCanvas.width = M;
offCanvas.height = M;
const ctx = offCanvas.getContext("2d");

const hr = h => [parseInt(h.slice(1, 3), 16), parseInt(h.slice(3, 5), 16), parseInt(h.slice(5, 7), 16)];
const [bR, bG, bB] = hr(t.pageBg);
const [fR, fG, fB] = hr(t.palette[0]);  // Imprint palette[0] = #009E73

const imgData = ctx.createImageData(M, M);
const px = imgData.data;

for (let i = 0; i < M; i++) {
  for (let j = 0; j < M; j++) {
    const idx = 4 * (i * M + j);
    if (dist[i][j] <= eps) {
      px[idx] = fR; px[idx + 1] = fG; px[idx + 2] = fB; px[idx + 3] = 255;
    } else {
      px[idx] = bR; px[idx + 1] = bG; px[idx + 2] = bB; px[idx + 3] = 255;
    }
  }
}
ctx.putImageData(imgData, 0, 0);

// --- SVG mount --------------------------------------------------------------
const svg = d3.select("#container").append("svg")
  .attr("width", width).attr("height", height);

svg.append("rect").attr("width", width).attr("height", height).attr("fill", t.pageBg);

// Arrowhead marker for annotation leader lines
svg.append("defs").append("marker")
  .attr("id", "arr")
  .attr("viewBox", "0 0 6 6")
  .attr("markerWidth", 6).attr("markerHeight", 6)
  .attr("refX", 5).attr("refY", 3)
  .attr("orient", "auto")
  .append("path").attr("d", "M0,0 L0,6 L6,3 z").attr("fill", t.inkSoft);

const g = svg.append("g").attr("transform", `translate(${margin.left},${margin.top})`);

// Recurrence image — pixelated rendering keeps cell edges crisp
g.append("image")
  .attr("x", 0).attr("y", 0)
  .attr("width", iw).attr("height", ih)
  .attr("preserveAspectRatio", "none")
  .style("image-rendering", "pixelated")
  .attr("href", offCanvas.toDataURL());

// Plot border — slightly heavier for visual definition
g.append("rect")
  .attr("x", 0).attr("y", 0)
  .attr("width", iw).attr("height", ih)
  .attr("fill", "none")
  .attr("stroke", t.inkSoft).attr("stroke-width", 1);

// --- Axes ------------------------------------------------------------------
const xScale = d3.scaleLinear().domain([0, M - 1]).range([0, iw]);
const yScale = d3.scaleLinear().domain([0, M - 1]).range([0, ih]);

const xAxisG = g.append("g").attr("transform", `translate(0,${ih})`)
  .call(d3.axisBottom(xScale).ticks(6).tickSize(4));
const yAxisG = g.append("g")
  .call(d3.axisLeft(yScale).ticks(6).tickSize(4));

for (const ax of [xAxisG, yAxisG]) {
  ax.selectAll("text").attr("fill", t.inkSoft).style("font-size", "14px");
  ax.selectAll("line").attr("stroke", t.inkSoft);
  ax.select(".domain").attr("stroke", "none");  // border rect handles the edge
}

// --- Axis labels -----------------------------------------------------------
g.append("text")
  .attr("x", iw / 2).attr("y", ih + 65)
  .attr("text-anchor", "middle")
  .attr("fill", t.inkSoft).style("font-size", "16px")
  .text("Time Index (i)");

g.append("text")
  .attr("transform", "rotate(-90)")
  .attr("x", -(ih / 2)).attr("y", -68)
  .attr("text-anchor", "middle")
  .attr("fill", t.inkSoft).style("font-size", "16px")
  .text("Time Index (j)");

// --- ε threshold annotation (analytical context) --------------------------
g.append("text")
  .attr("x", iw / 2).attr("y", ih + 40)
  .attr("text-anchor", "middle")
  .attr("fill", t.inkSoft).style("font-size", "13px").style("font-style", "italic")
  .text(`ε = ${eps.toFixed(3)}  ·  15% recurrence rate  ·  logistic map r = 3.85, τ = 3`);

// --- Structural annotations (D3 text + leader lines into matrix) -----------
// Pixel positions of annotation targets inside the 930×930 plot area
const diagTargetX = Math.round(ih * 0.10);  // point on main diagonal (i=j≈30)
const diagTargetY = diagTargetX;
const stripeTargetX = Math.round(iw * 0.505); // offset-stripe at i≈150, j≈137
const stripeTargetY = Math.round(ih * 0.461);

const annX = iw + 18;  // start of annotation text in right margin

// Annotation 1: main diagonal — leader from text region into diagonal
g.append("line")
  .attr("x1", annX - 10).attr("y1", diagTargetY)
  .attr("x2", diagTargetX + 4).attr("y2", diagTargetY)
  .attr("stroke", t.inkSoft).attr("stroke-width", 0.7)
  .attr("stroke-dasharray", "4,3")
  .attr("marker-end", "url(#arr)");
g.append("text")
  .attr("x", annX).attr("y", diagTargetY - 5)
  .attr("fill", t.ink).style("font-size", "13px").style("font-weight", "600")
  .text("Main diagonal");
g.append("text")
  .attr("x", annX).attr("y", diagTargetY + 12)
  .attr("fill", t.inkSoft).style("font-size", "12px").style("font-style", "italic")
  .text("i = j  (identity)");

// Annotation 2: parallel off-diagonal stripe — quasi-periodicity indicator
g.append("line")
  .attr("x1", annX - 10).attr("y1", stripeTargetY)
  .attr("x2", stripeTargetX + 4).attr("y2", stripeTargetY)
  .attr("stroke", t.inkSoft).attr("stroke-width", 0.7)
  .attr("stroke-dasharray", "4,3")
  .attr("marker-end", "url(#arr)");
g.append("text")
  .attr("x", annX).attr("y", stripeTargetY - 5)
  .attr("fill", t.ink).style("font-size", "13px").style("font-weight", "600")
  .text("Parallel stripes");
g.append("text")
  .attr("x", annX).attr("y", stripeTargetY + 12)
  .attr("fill", t.inkSoft).style("font-size", "12px").style("font-style", "italic")
  .text("quasi-periodicity");

// --- Title -----------------------------------------------------------------
svg.append("text")
  .attr("x", width / 2).attr("y", 48)
  .attr("text-anchor", "middle")
  .attr("fill", t.ink)
  .style("font-size", "22px").style("font-weight", "600")
  .text("recurrence-basic · javascript · d3 · anyplot.ai");
Runnable source as JSON, for any HTTP client: https://api.anyplot.ai/specs/recurrence-basic/d3/code. Any spec id and library id listed in llms-full.txt fit the same URL shape; every URL below is complete and callable.
{
  "spec_id": "recurrence-basic",
  "language": "javascript",
  "library": "d3",
  "page": "https://anyplot.ai/recurrence-basic/javascript/d3",
  "hub": "https://anyplot.ai/recurrence-basic",
  "code_json": "https://api.anyplot.ai/specs/recurrence-basic/d3/code",
  "spec_json": "https://api.anyplot.ai/specs/recurrence-basic",
  "render_light_png": "https://storage.googleapis.com/anyplot-images/plots/recurrence-basic/javascript/d3/plot-light.png",
  "render_dark_png": "https://storage.googleapis.com/anyplot-images/plots/recurrence-basic/javascript/d3/plot-dark.png",
  "interactive_light_html": "https://storage.googleapis.com/anyplot-images/plots/recurrence-basic/javascript/d3/plot-light.html",
  "interactive_dark_html": "https://storage.googleapis.com/anyplot-images/plots/recurrence-basic/javascript/d3/plot-dark.html",
  "quality_score": 93.0,
  "license": "MIT",
  "guide": "https://anyplot.ai/llms.txt"
}
Part of Recurrence Plot for Nonlinear Time Series on anyplot.ai.