The same plot in 14 other libraries — Python: Altair, Bokeh, Matplotlib, Plotly, plotnine, Pygal, Seaborn; R: ggplot2; Julia: Makie.jl; JavaScript: Chart.js, D3.js, Apache ECharts, Highcharts, MUI X Charts. Compare all 15 side by side: Recurrence Plot for Nonlinear Time Series in Python, R, Julia and JavaScript.
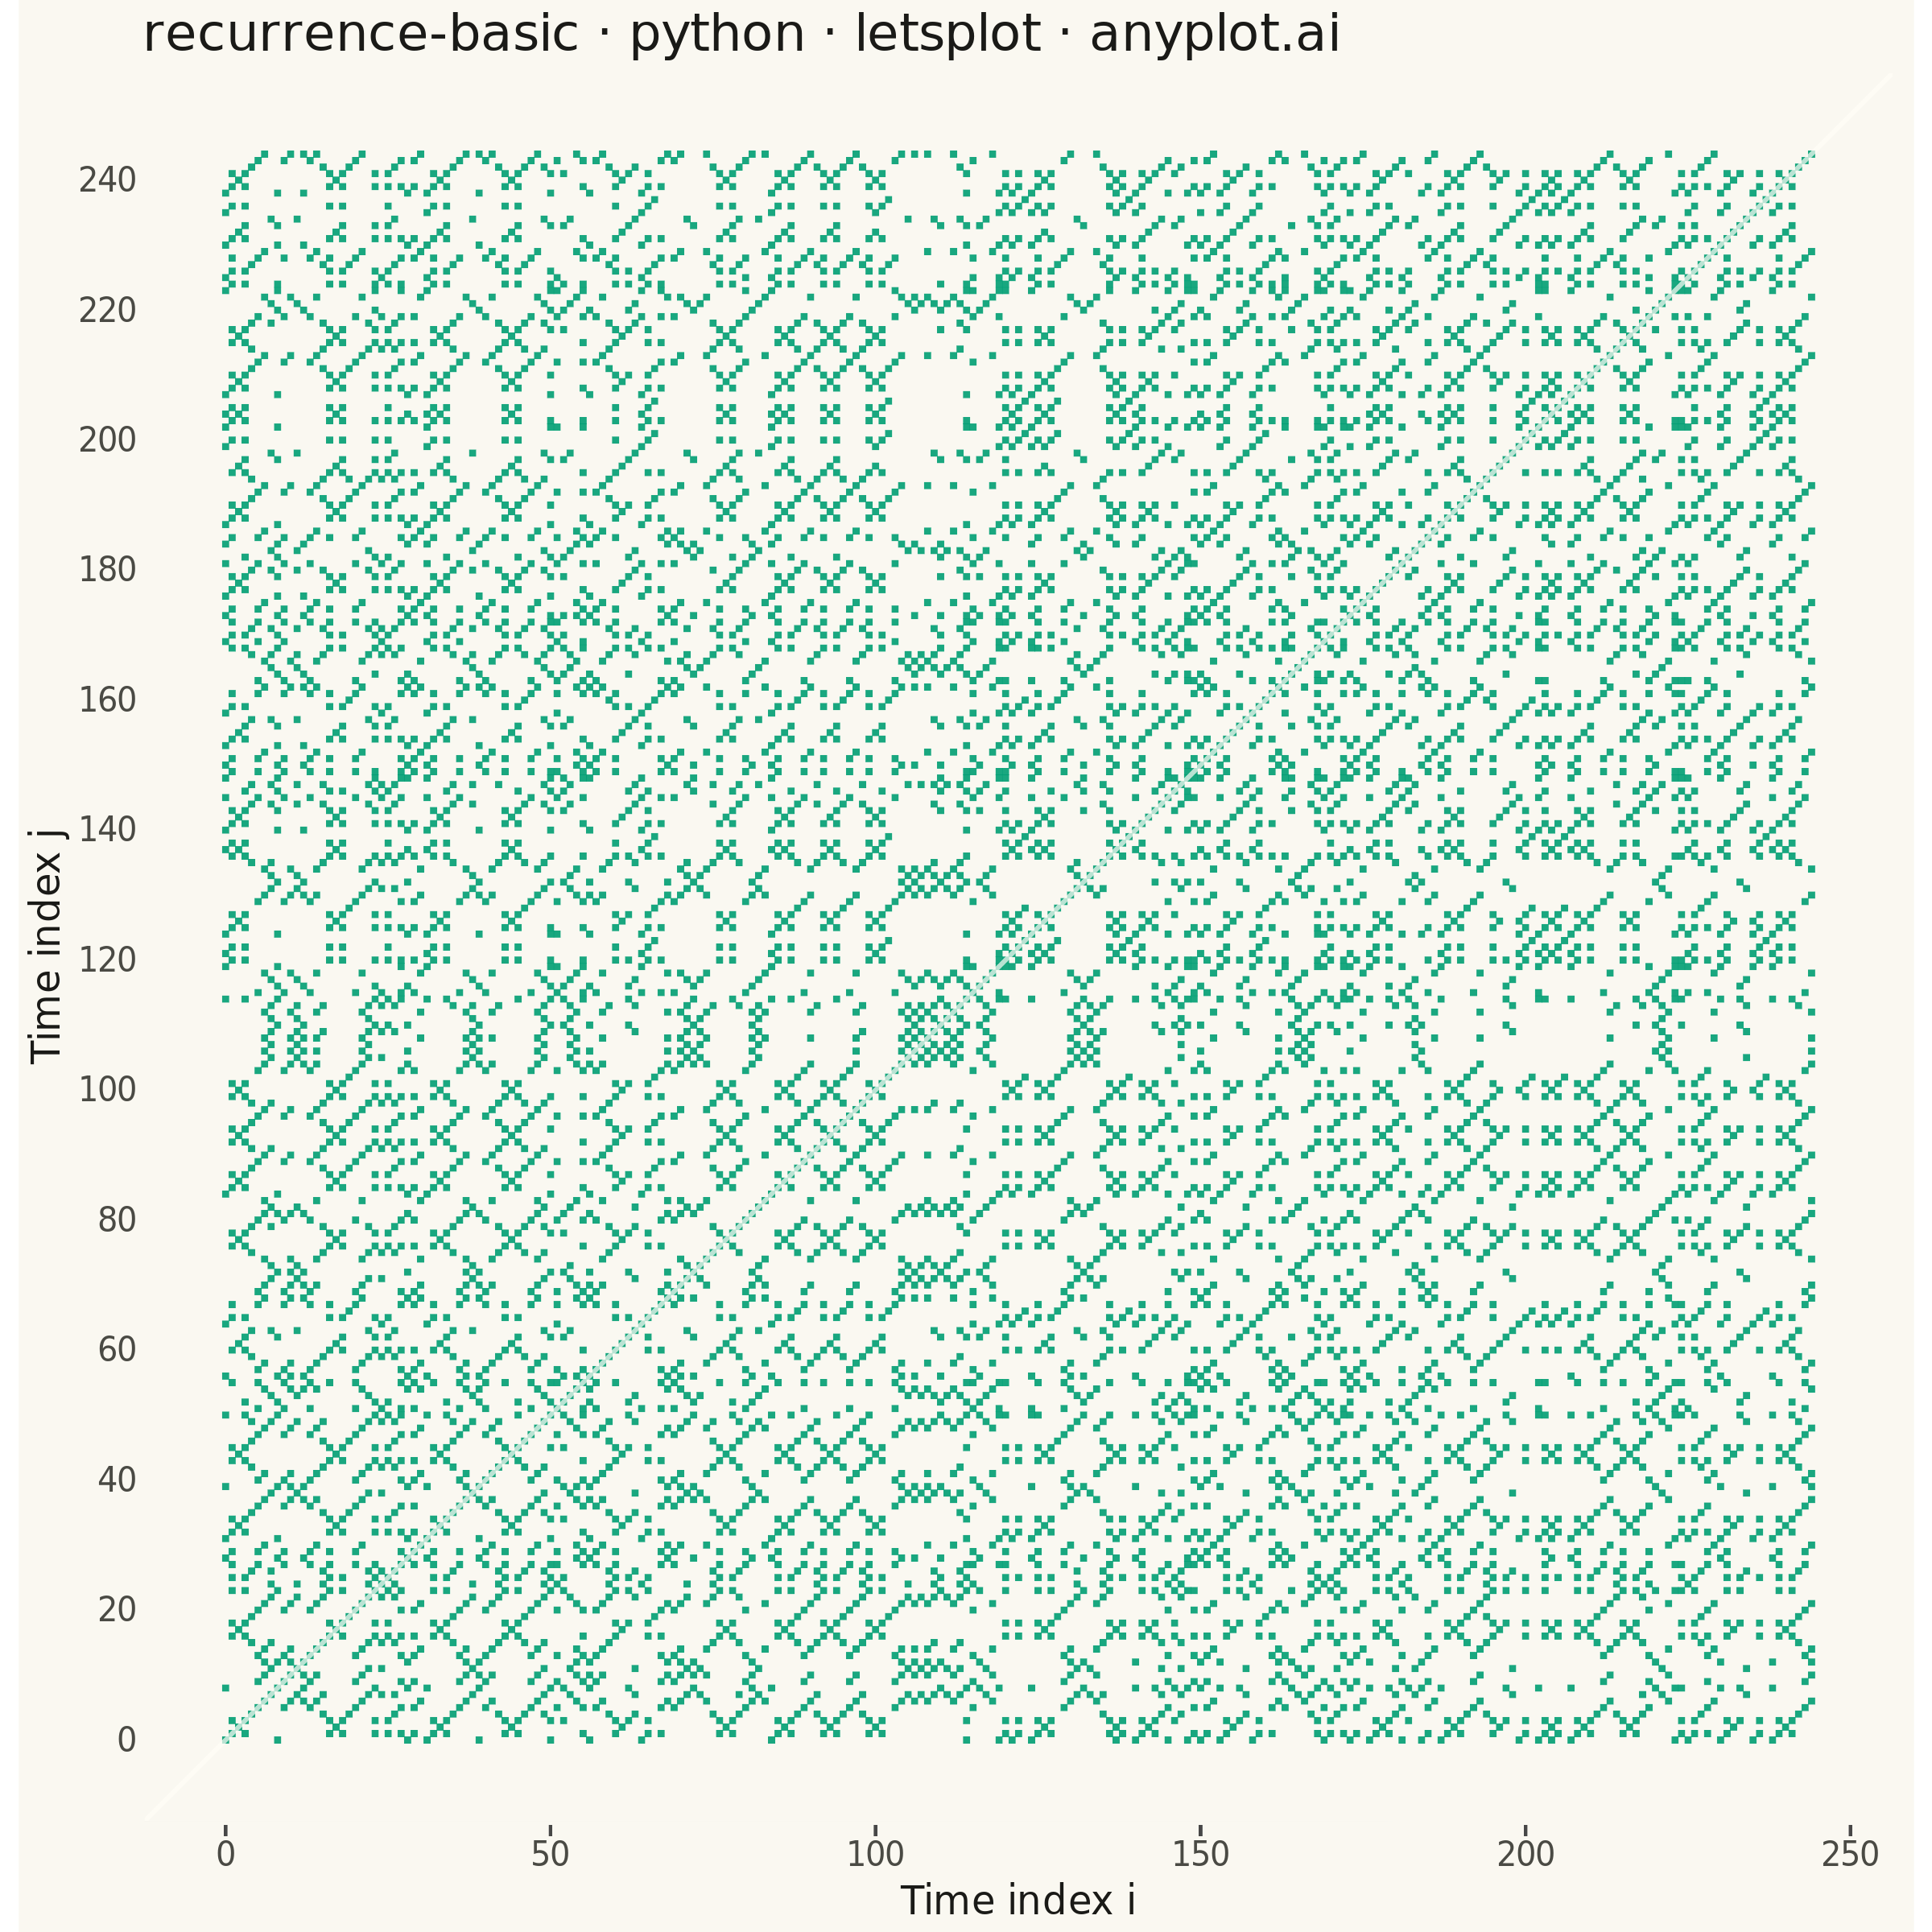
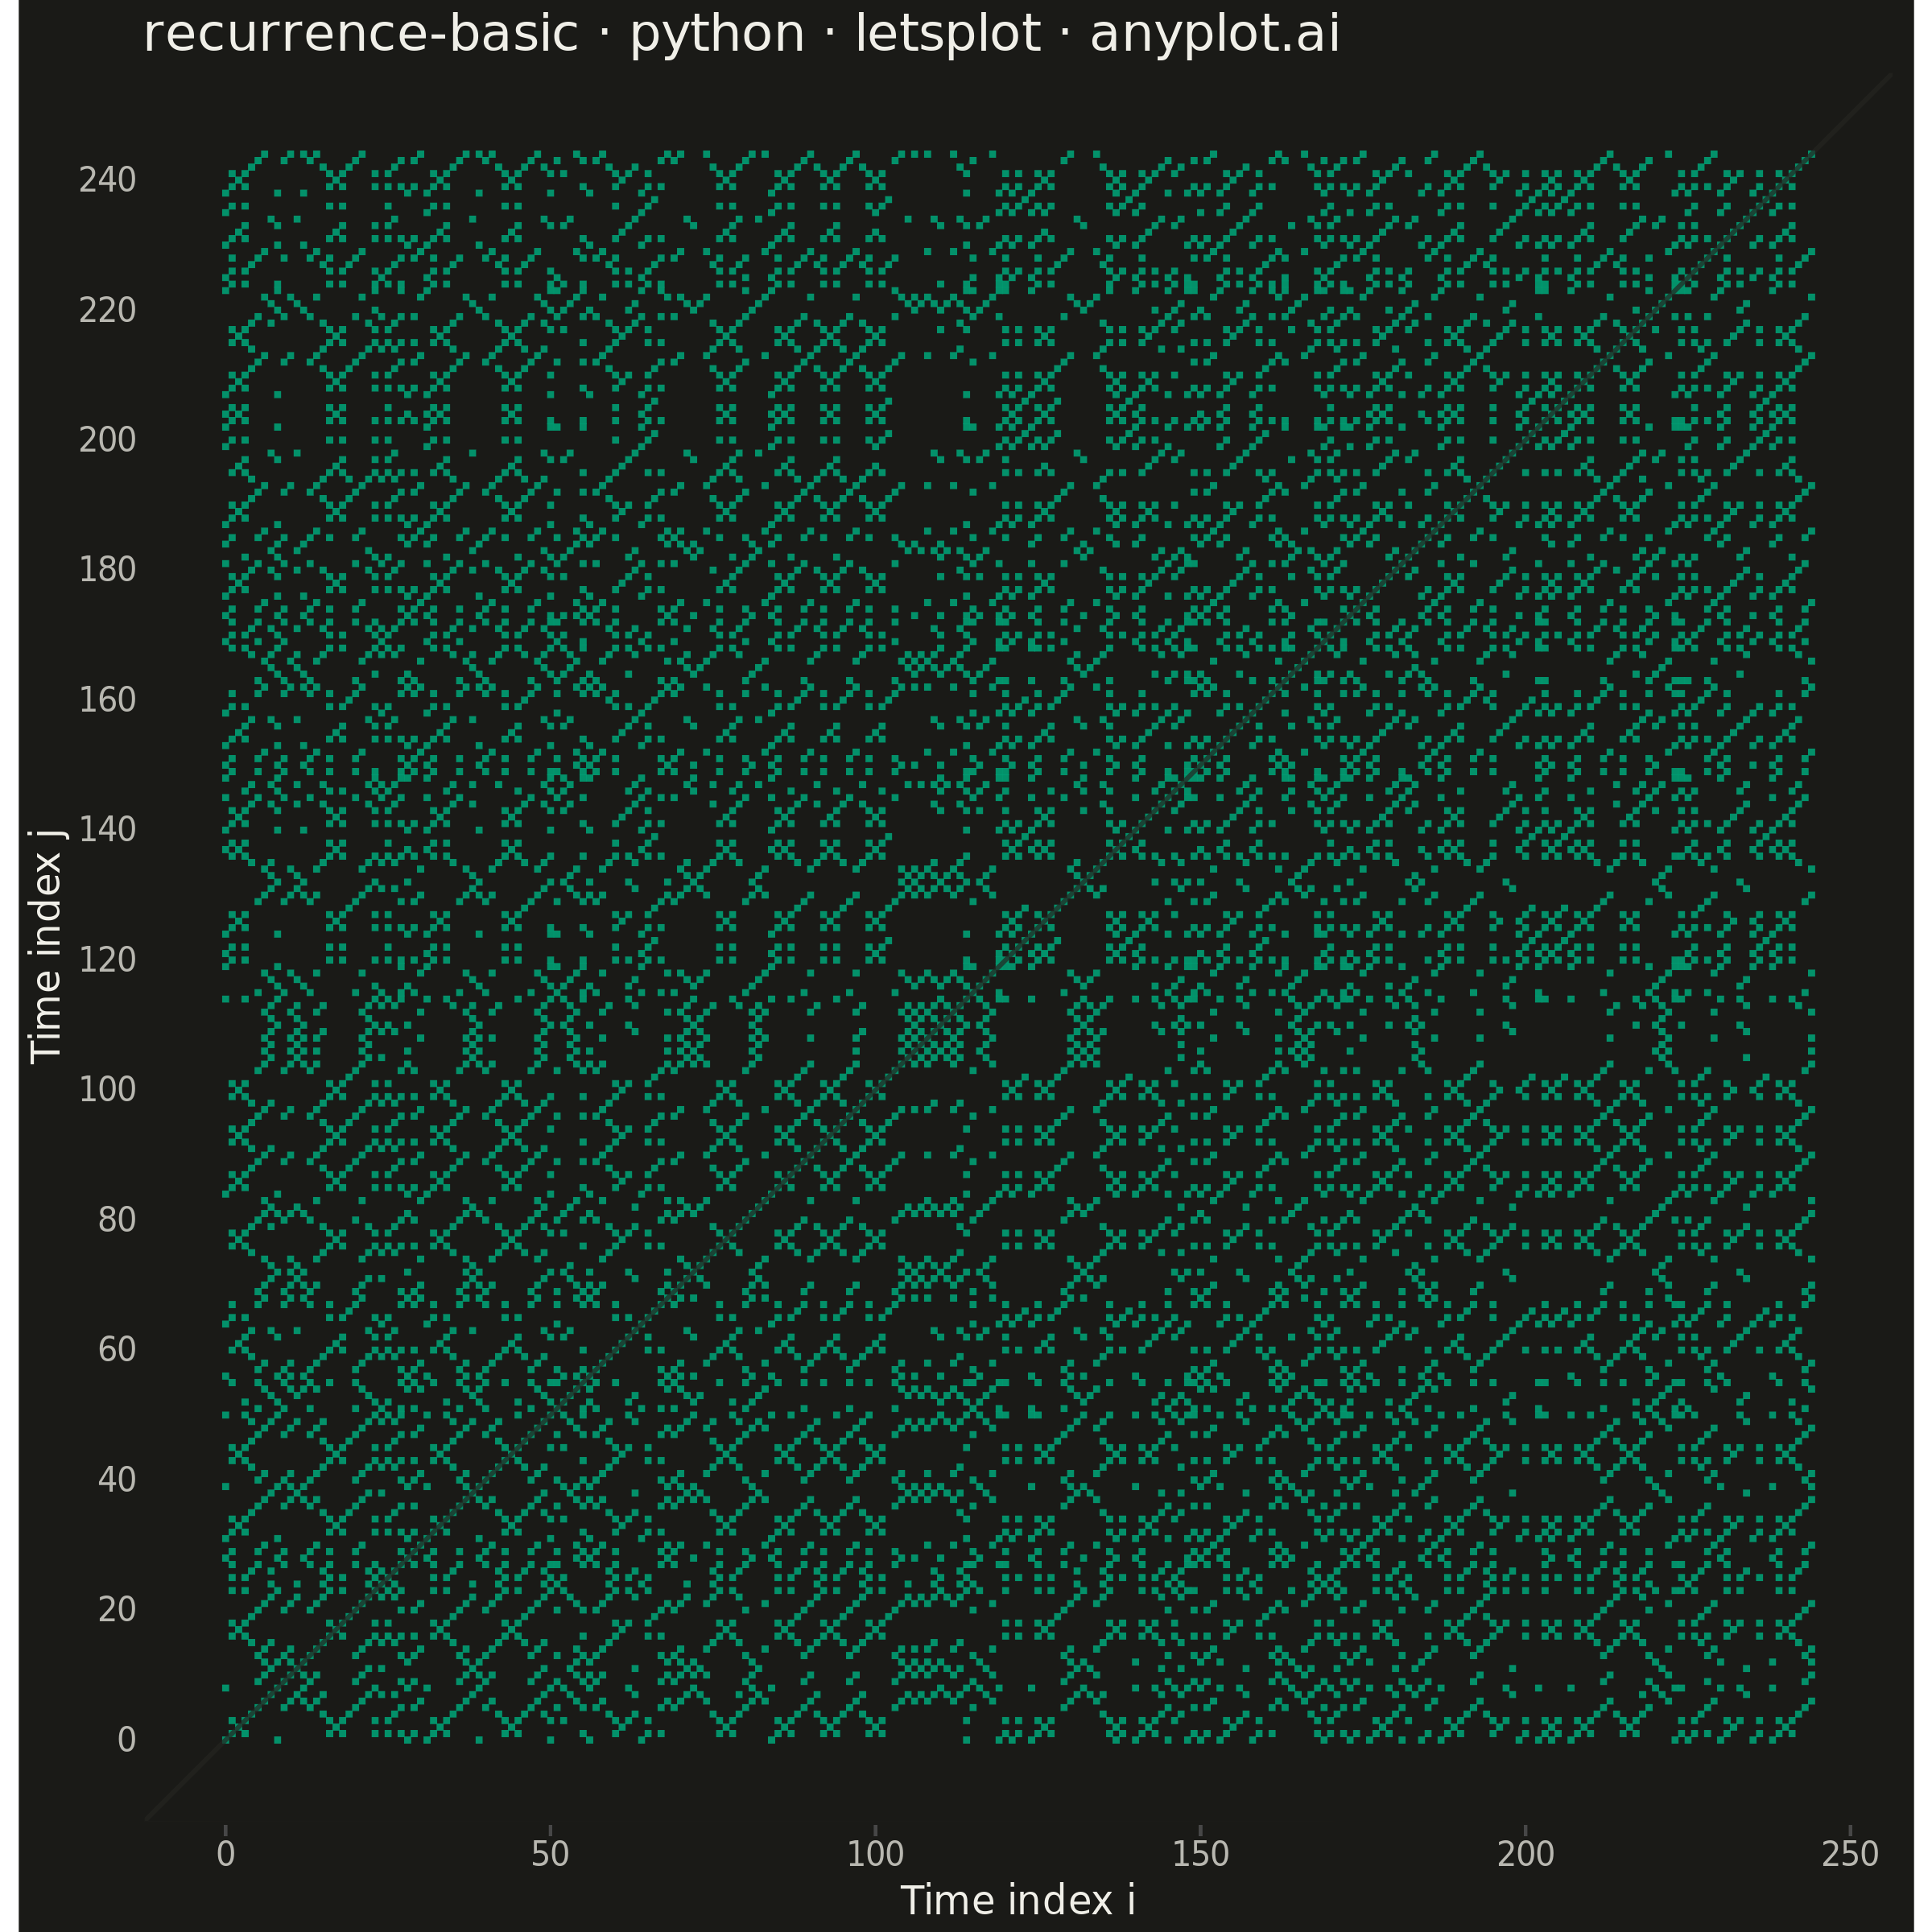
A recurrence plot is a binary or distance-based matrix visualization that reveals when states in a dynamical system recur over time. Both axes represent time indices, and a point is plotted at position (i, j) when the system state at time i is sufficiently similar to the state at time j (distance below a threshold). The resulting symmetric matrix exposes hidden structure in complex, nonlinear dynamics — diagonal lines indicate determinism, vertical/horizontal lines reveal laminar states, and block structures signal regime changes.
""" anyplot.ai
recurrence-basic: Recurrence Plot for Nonlinear Time Series
Library: letsplot 4.10.1 | Python 3.13.13
Quality: 88/100 | Created: 2026-06-10
"""

import os

import numpy as np
import pandas as pd
from lets_plot import *
from scipy.spatial.distance import cdist


LetsPlot.setup_html()

# Theme tokens
THEME = os.getenv("ANYPLOT_THEME", "light")
PAGE_BG = "#FAF8F1" if THEME == "light" else "#1A1A17"
ELEVATED_BG = "#FFFDF6" if THEME == "light" else "#242420"
INK = "#1A1A17" if THEME == "light" else "#F0EFE8"
INK_SOFT = "#4A4A44" if THEME == "light" else "#B8B7B0"
BRAND = "#009E73"  # Imprint palette position 1

# Data — logistic map in chaotic regime (r=3.8), transient discarded
np.random.seed(42)
N_total = 350
r = 3.8
x_all = np.zeros(N_total)
x_all[0] = 0.5
for i in range(1, N_total):
    x_all[i] = r * x_all[i - 1] * (1 - x_all[i - 1])
x_series = x_all[100:]  # 250 steps, transient removed

# Time-delay embedding (Takens' theorem): dimension=2, delay=5
dim = 2
delay = 5
M = len(x_series) - (dim - 1) * delay  # 245 embedded vectors
embedded = np.array([[x_series[i], x_series[i + delay]] for i in range(M)])

# Pairwise Euclidean distances (245 × 245)
dist_matrix = cdist(embedded, embedded, metric="euclidean")

# Threshold: 15th percentile of off-diagonal distances → ~15% recurrent
off_diag = dist_matrix[np.triu_indices(M, k=1)]
epsilon = np.percentile(off_diag, 15)

# Binary recurrence: 1 where states recur (distance ≤ ε)
recurrence = dist_matrix <= epsilon
rows, cols = np.where(recurrence)
df = pd.DataFrame({"time_i": rows, "time_j": cols})

# Title (49 chars — under 67-char baseline, no scaling needed)
title = "recurrence-basic · python · letsplot · anyplot.ai"

# Theme — color=PAGE_BG on panel_background hides the panel box, yielding an L-shaped frame
anyplot_theme = theme(
    plot_background=element_rect(fill=PAGE_BG, color=PAGE_BG),
    panel_background=element_rect(fill=PAGE_BG, color=PAGE_BG),
    panel_border=element_blank(),
    panel_grid_major=element_blank(),
    panel_grid_minor=element_blank(),
    axis_title=element_text(color=INK, size=12),
    axis_text=element_text(color=INK_SOFT, size=10),
    axis_line=element_line(color=INK_SOFT),
    plot_title=element_text(color=INK, size=16),
    legend_position="none",
)

# Plot — recurrent pairs as tiles; diagonal line marks Line of Identity (i=j)
plot = (
    ggplot(df, aes(x="time_i", y="time_j"))
    + geom_tile(fill=BRAND, alpha=0.9, tooltips=layer_tooltips(["time_i", "time_j"]))
    + geom_abline(slope=1, intercept=0, color=ELEVATED_BG, size=0.6, alpha=0.7)
    + labs(x="Time index i", y="Time index j", title=title)
    + anyplot_theme
    + ggsize(600, 600)
    + coord_fixed(ratio=1.0)
)

# Save
ggsave(plot, f"plot-{THEME}.png", path=".", scale=4)
ggsave(plot, f"plot-{THEME}.html", path=".")
Runnable source as JSON, for any HTTP client: https://api.anyplot.ai/specs/recurrence-basic/letsplot/code. Any spec id and library id listed in llms-full.txt fit the same URL shape; every URL below is complete and callable.
{
  "spec_id": "recurrence-basic",
  "language": "python",
  "library": "letsplot",
  "page": "https://anyplot.ai/recurrence-basic/python/letsplot",
  "hub": "https://anyplot.ai/recurrence-basic",
  "code_json": "https://api.anyplot.ai/specs/recurrence-basic/letsplot/code",
  "spec_json": "https://api.anyplot.ai/specs/recurrence-basic",
  "render_light_png": "https://storage.googleapis.com/anyplot-images/plots/recurrence-basic/python/letsplot/plot-light.png",
  "render_dark_png": "https://storage.googleapis.com/anyplot-images/plots/recurrence-basic/python/letsplot/plot-dark.png",
  "interactive_light_html": "https://storage.googleapis.com/anyplot-images/plots/recurrence-basic/python/letsplot/plot-light.html",
  "interactive_dark_html": "https://storage.googleapis.com/anyplot-images/plots/recurrence-basic/python/letsplot/plot-dark.html",
  "quality_score": 88.0,
  "license": "MIT",
  "guide": "https://anyplot.ai/llms.txt"
}
Part of Recurrence Plot for Nonlinear Time Series on anyplot.ai.