The same plot in 14 other libraries — JavaScript: Chart.js, D3.js, Apache ECharts, MUI X Charts; Python: Altair, Bokeh, lets-plot, Matplotlib, Plotly, plotnine, Pygal, Seaborn; R: ggplot2; Julia: Makie.jl. Compare all 15 side by side: Recurrence Plot for Nonlinear Time Series in Python, R, Julia and JavaScript.
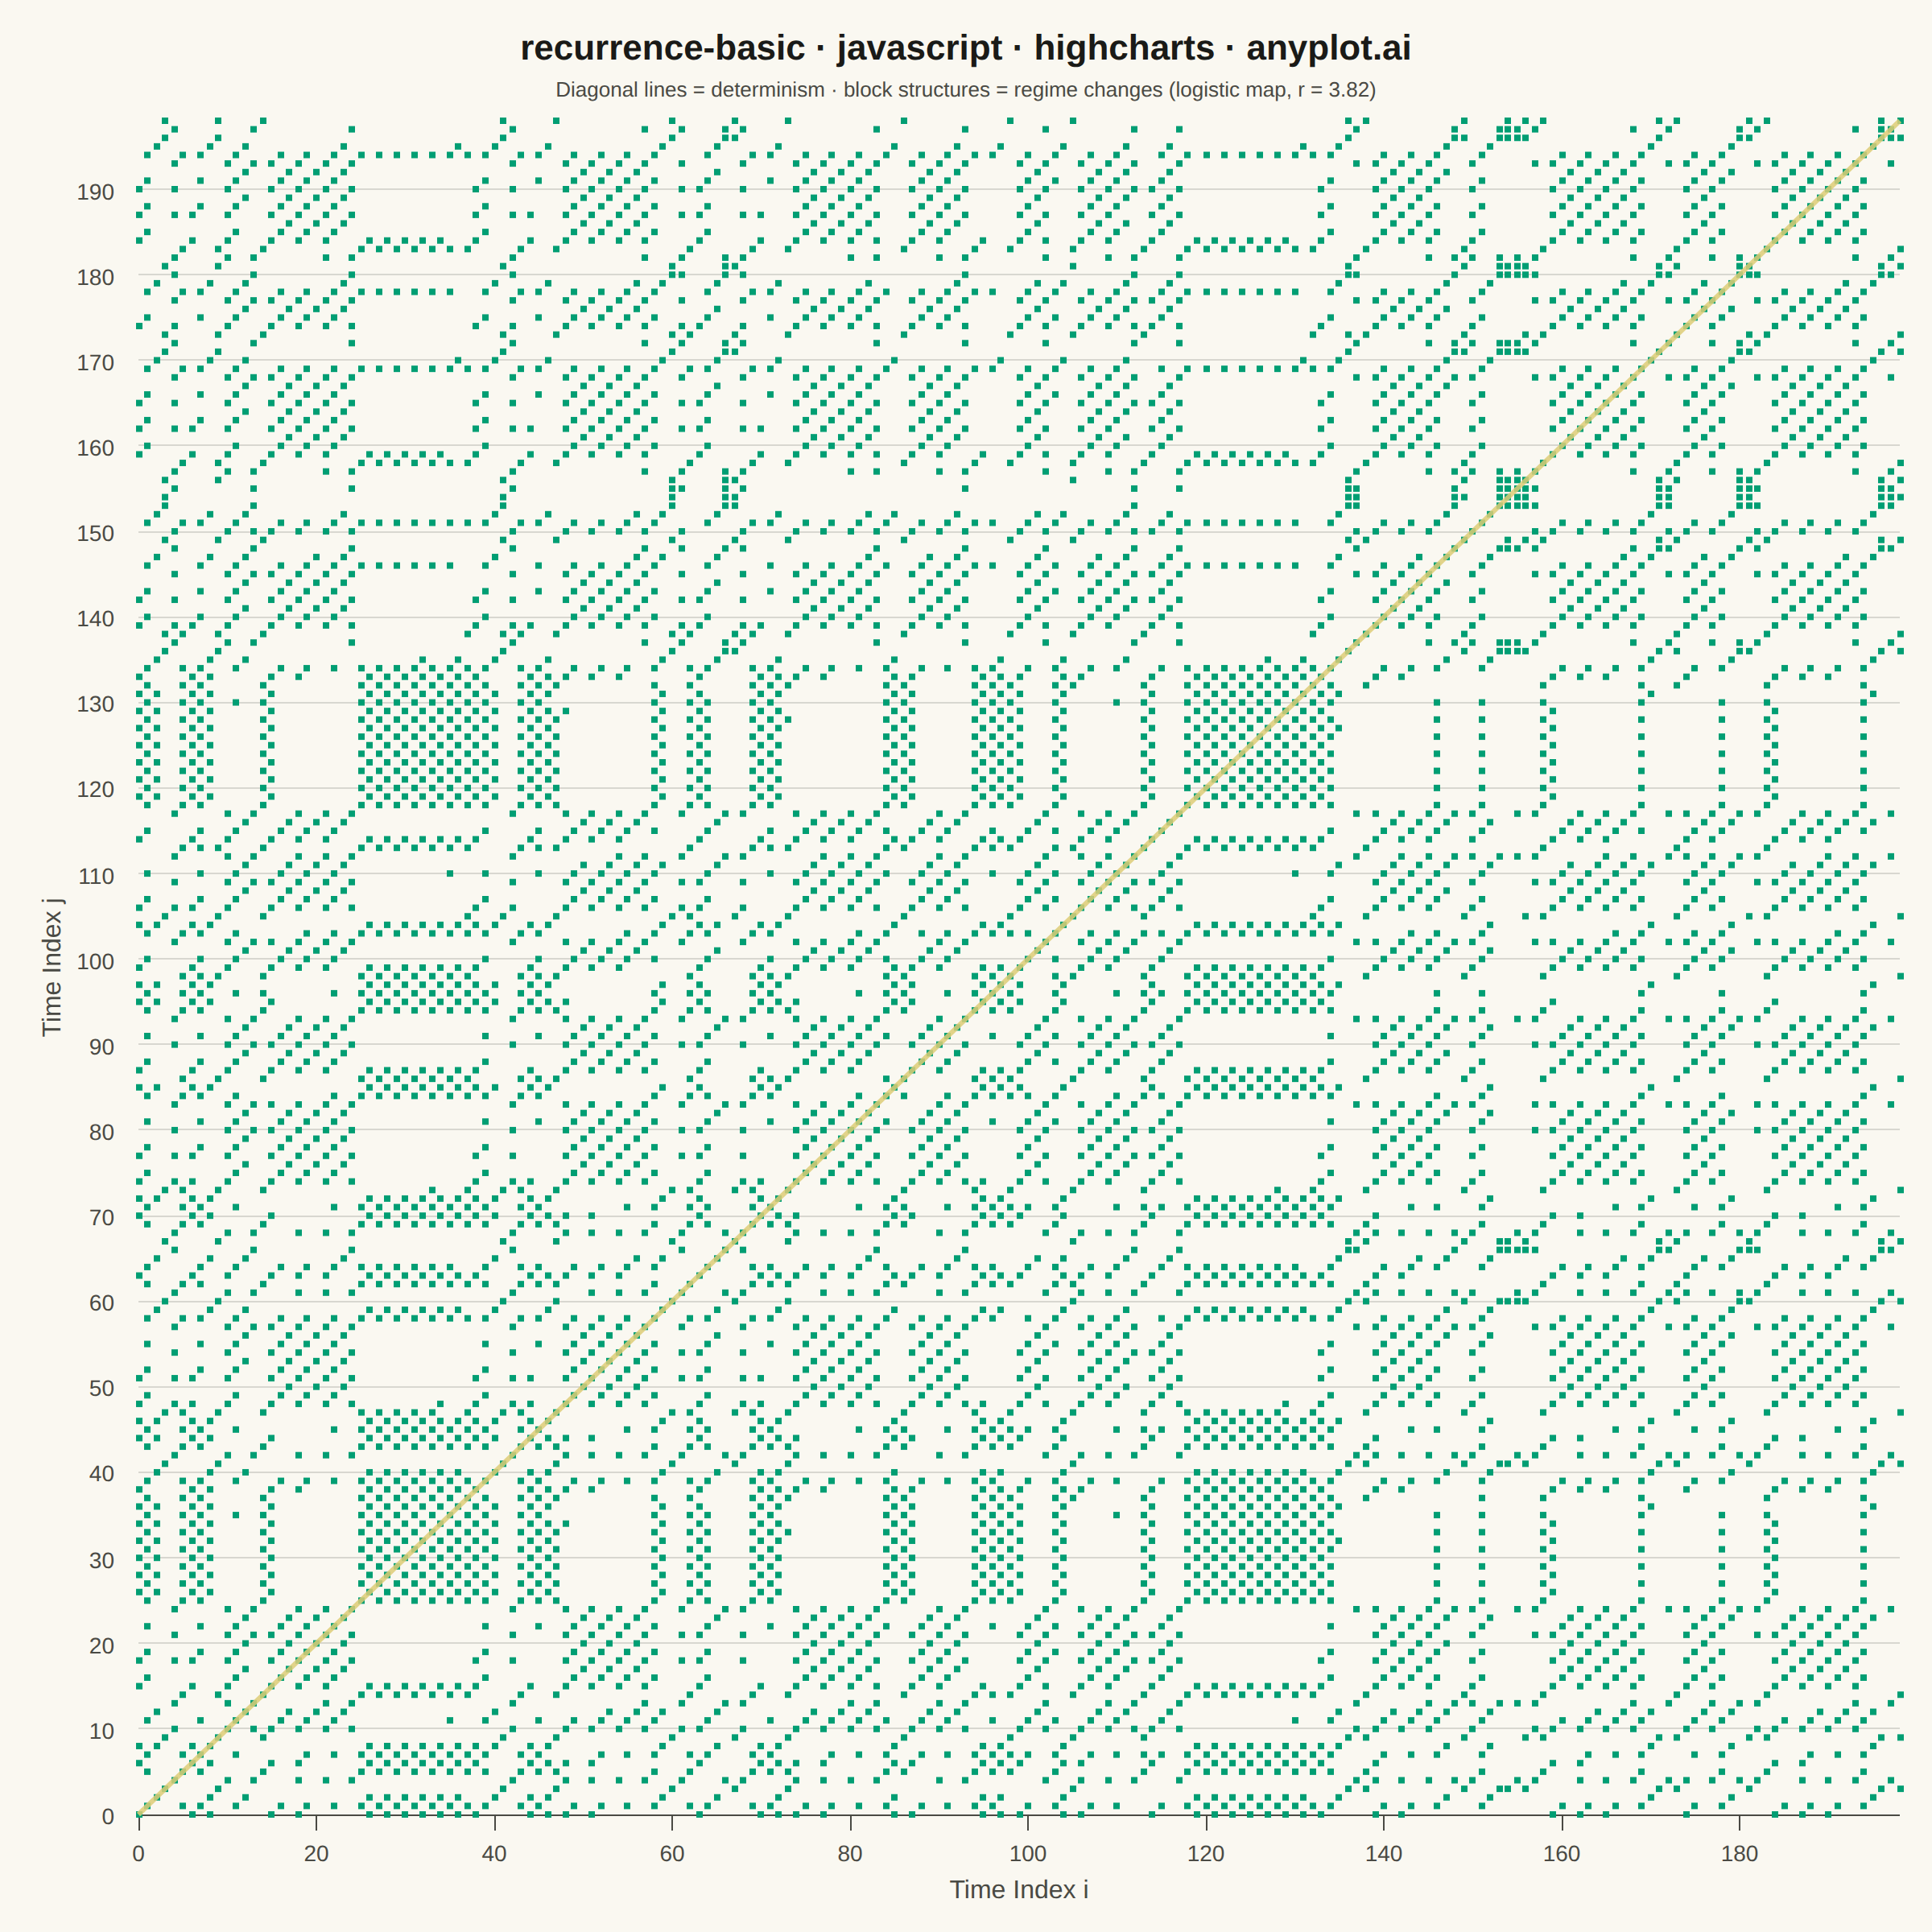
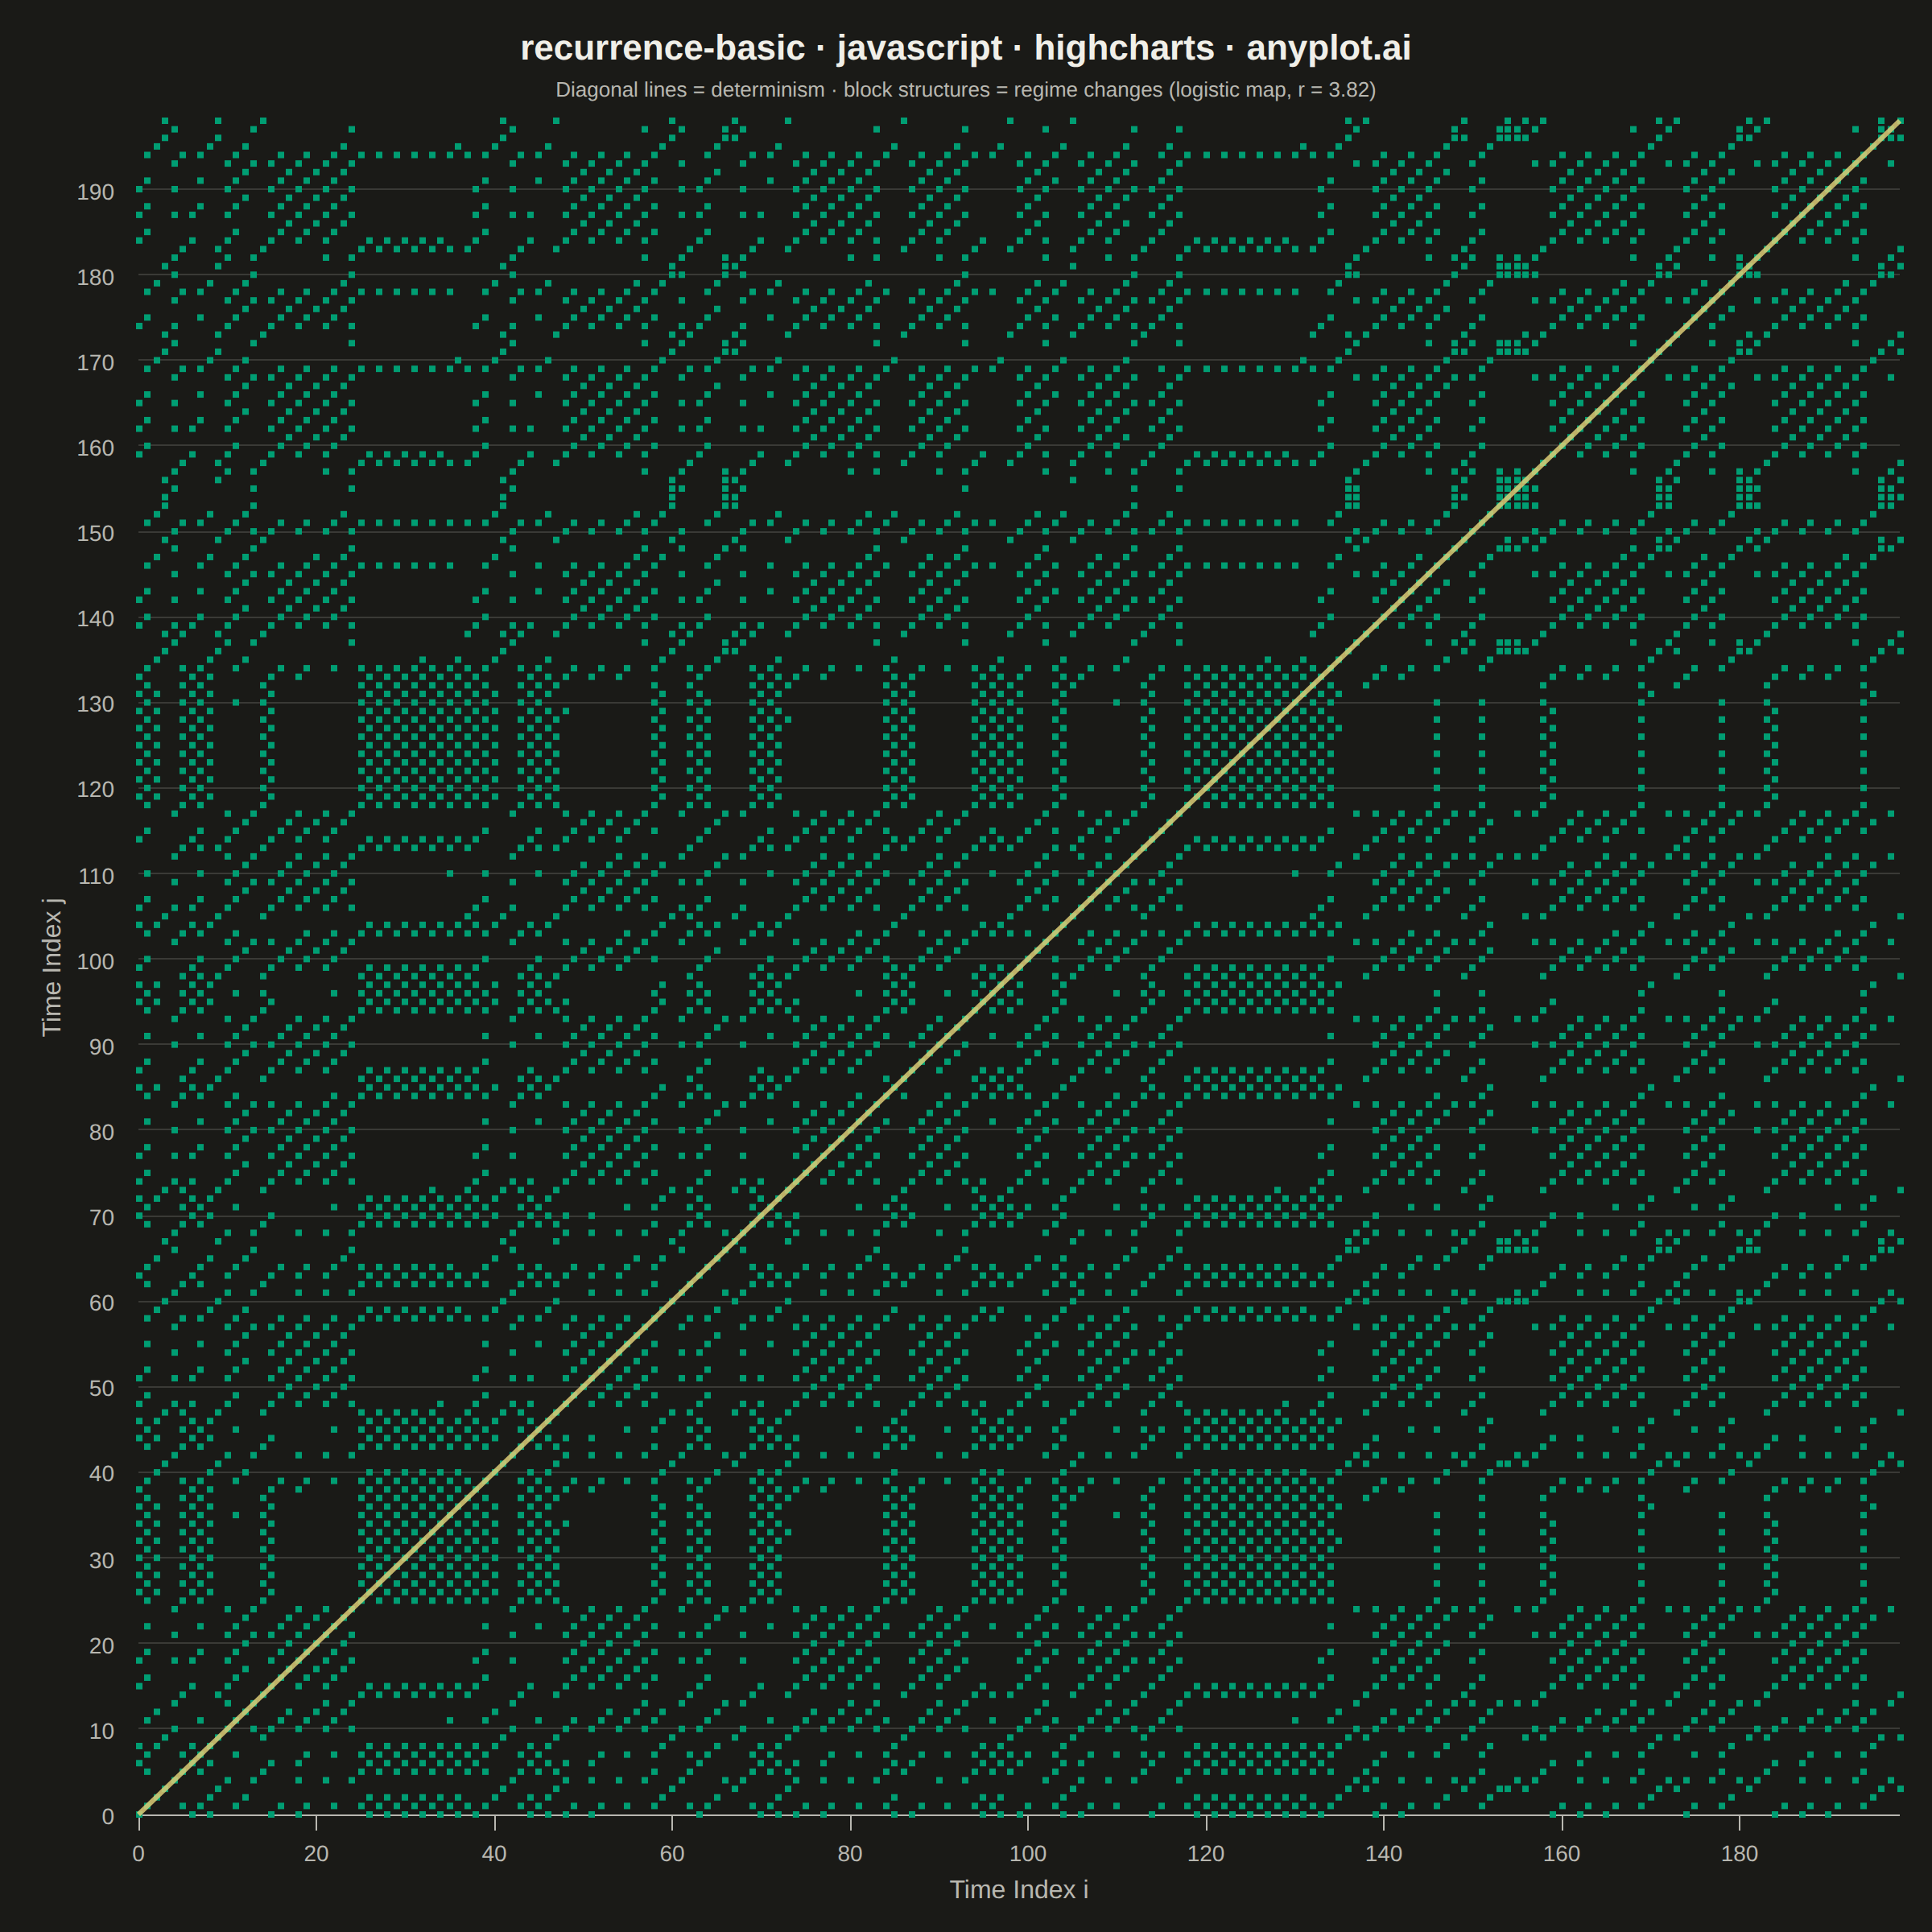
A recurrence plot is a binary or distance-based matrix visualization that reveals when states in a dynamical system recur over time. Both axes represent time indices, and a point is plotted at position (i, j) when the system state at time i is sufficiently similar to the state at time j (distance below a threshold). The resulting symmetric matrix exposes hidden structure in complex, nonlinear dynamics — diagonal lines indicate determinism, vertical/horizontal lines reveal laminar states, and block structures signal regime changes.
// anyplot.ai
// recurrence-basic: Recurrence Plot for Nonlinear Time Series
// Library: highcharts 12.6.0 | JavaScript 22.22.3
// Quality: 88/100 | Created: 2026-06-10

//# anyplot-orientation: square

const t = window.ANYPLOT_TOKENS;

// Logistic map in chaotic regime (r = 3.82, x0 = 0.4)
const N = 200;
const r = 3.82;
const ts = new Array(N);
ts[0] = 0.4;
for (let i = 1; i < N; i++) {
    ts[i] = r * ts[i - 1] * (1 - ts[i - 1]);
}

// Time-delay embedding: dimension d=2, delay tau=1
// Embedded vector at index i: [ts[i], ts[i+1]]
const M = N - 1;
const emb = new Array(M);
for (let i = 0; i < M; i++) {
    emb[i] = [ts[i], ts[i + 1]];
}

// Binary recurrence matrix: mark (i,j) where Euclidean distance < epsilon
const eps = 0.15;
const epsSq = eps * eps;
const recData = [];
for (let i = 0; i < M; i++) {
    for (let j = 0; j < M; j++) {
        const dx = emb[i][0] - emb[j][0];
        const dy = emb[i][1] - emb[j][1];
        if (dx * dx + dy * dy < epsSq) {
            recData.push([i, j]);
        }
    }
}

// Chart
const chart = Highcharts.chart("container", {
    chart: {
        type: "scatter",
        backgroundColor: "transparent",
        animation: false,
        style: { fontFamily: "inherit" },
        spacing: [20, 20, 20, 20],
        plotBorderWidth: 0
    },
    credits: { enabled: false },
    colors: t.palette,
    title: {
        text: "recurrence-basic · javascript · highcharts · anyplot.ai",
        style: { color: t.ink, fontSize: "22px", fontWeight: "600" }
    },
    subtitle: {
        text: "Diagonal lines = determinism · block structures = regime changes (logistic map, r = 3.82)",
        style: { color: t.inkSoft, fontSize: "13px" }
    },
    xAxis: {
        title: {
            text: "Time Index i",
            style: { color: t.inkSoft, fontSize: "16px" }
        },
        lineColor: t.inkSoft,
        tickColor: t.inkSoft,
        gridLineColor: t.grid,
        labels: { style: { color: t.inkSoft, fontSize: "14px" } },
        min: 0,
        max: M - 1,
        endOnTick: false
    },
    yAxis: {
        title: {
            text: "Time Index j",
            style: { color: t.inkSoft, fontSize: "16px" }
        },
        lineColor: t.inkSoft,
        tickColor: t.inkSoft,
        gridLineColor: t.grid,
        labels: { style: { color: t.inkSoft, fontSize: "14px" } },
        min: 0,
        max: M - 1,
        endOnTick: false
    },
    legend: { enabled: false },
    tooltip: { enabled: false },
    plotOptions: {
        series: { animation: false },
        scatter: {
            turboThreshold: 100000,
            marker: {
                radius: 2,
                symbol: "square",
                states: { hover: { enabled: false } }
            }
        }
    },
    series: [{
        name: "Recurrent",
        data: recData,
        color: t.palette[0]
    }]
});

// Overlay the main diagonal (i = j) using Highcharts SVG renderer.
// The self-recurrence line anchors the viewer and highlights deterministic structure.
const ax = chart.xAxis[0];
const ay = chart.yAxis[0];
chart.renderer.path([
    "M", ax.toPixels(0), ay.toPixels(0),
    "L", ax.toPixels(M - 1), ay.toPixels(M - 1)
]).attr({
    "stroke-width": 3,
    stroke: t.amber,
    opacity: 0.85,
    zIndex: 5
}).add(chart.seriesGroup);
Runnable source as JSON, for any HTTP client: https://api.anyplot.ai/specs/recurrence-basic/highcharts/code. Any spec id and library id listed in llms-full.txt fit the same URL shape; every URL below is complete and callable.
{
  "spec_id": "recurrence-basic",
  "language": "javascript",
  "library": "highcharts",
  "page": "https://anyplot.ai/recurrence-basic/javascript/highcharts",
  "hub": "https://anyplot.ai/recurrence-basic",
  "code_json": "https://api.anyplot.ai/specs/recurrence-basic/highcharts/code",
  "spec_json": "https://api.anyplot.ai/specs/recurrence-basic",
  "render_light_png": "https://storage.googleapis.com/anyplot-images/plots/recurrence-basic/javascript/highcharts/plot-light.png",
  "render_dark_png": "https://storage.googleapis.com/anyplot-images/plots/recurrence-basic/javascript/highcharts/plot-dark.png",
  "interactive_light_html": "https://storage.googleapis.com/anyplot-images/plots/recurrence-basic/javascript/highcharts/plot-light.html",
  "interactive_dark_html": "https://storage.googleapis.com/anyplot-images/plots/recurrence-basic/javascript/highcharts/plot-dark.html",
  "quality_score": 88.0,
  "license": "MIT",
  "guide": "https://anyplot.ai/llms.txt"
}
Part of Recurrence Plot for Nonlinear Time Series on anyplot.ai.