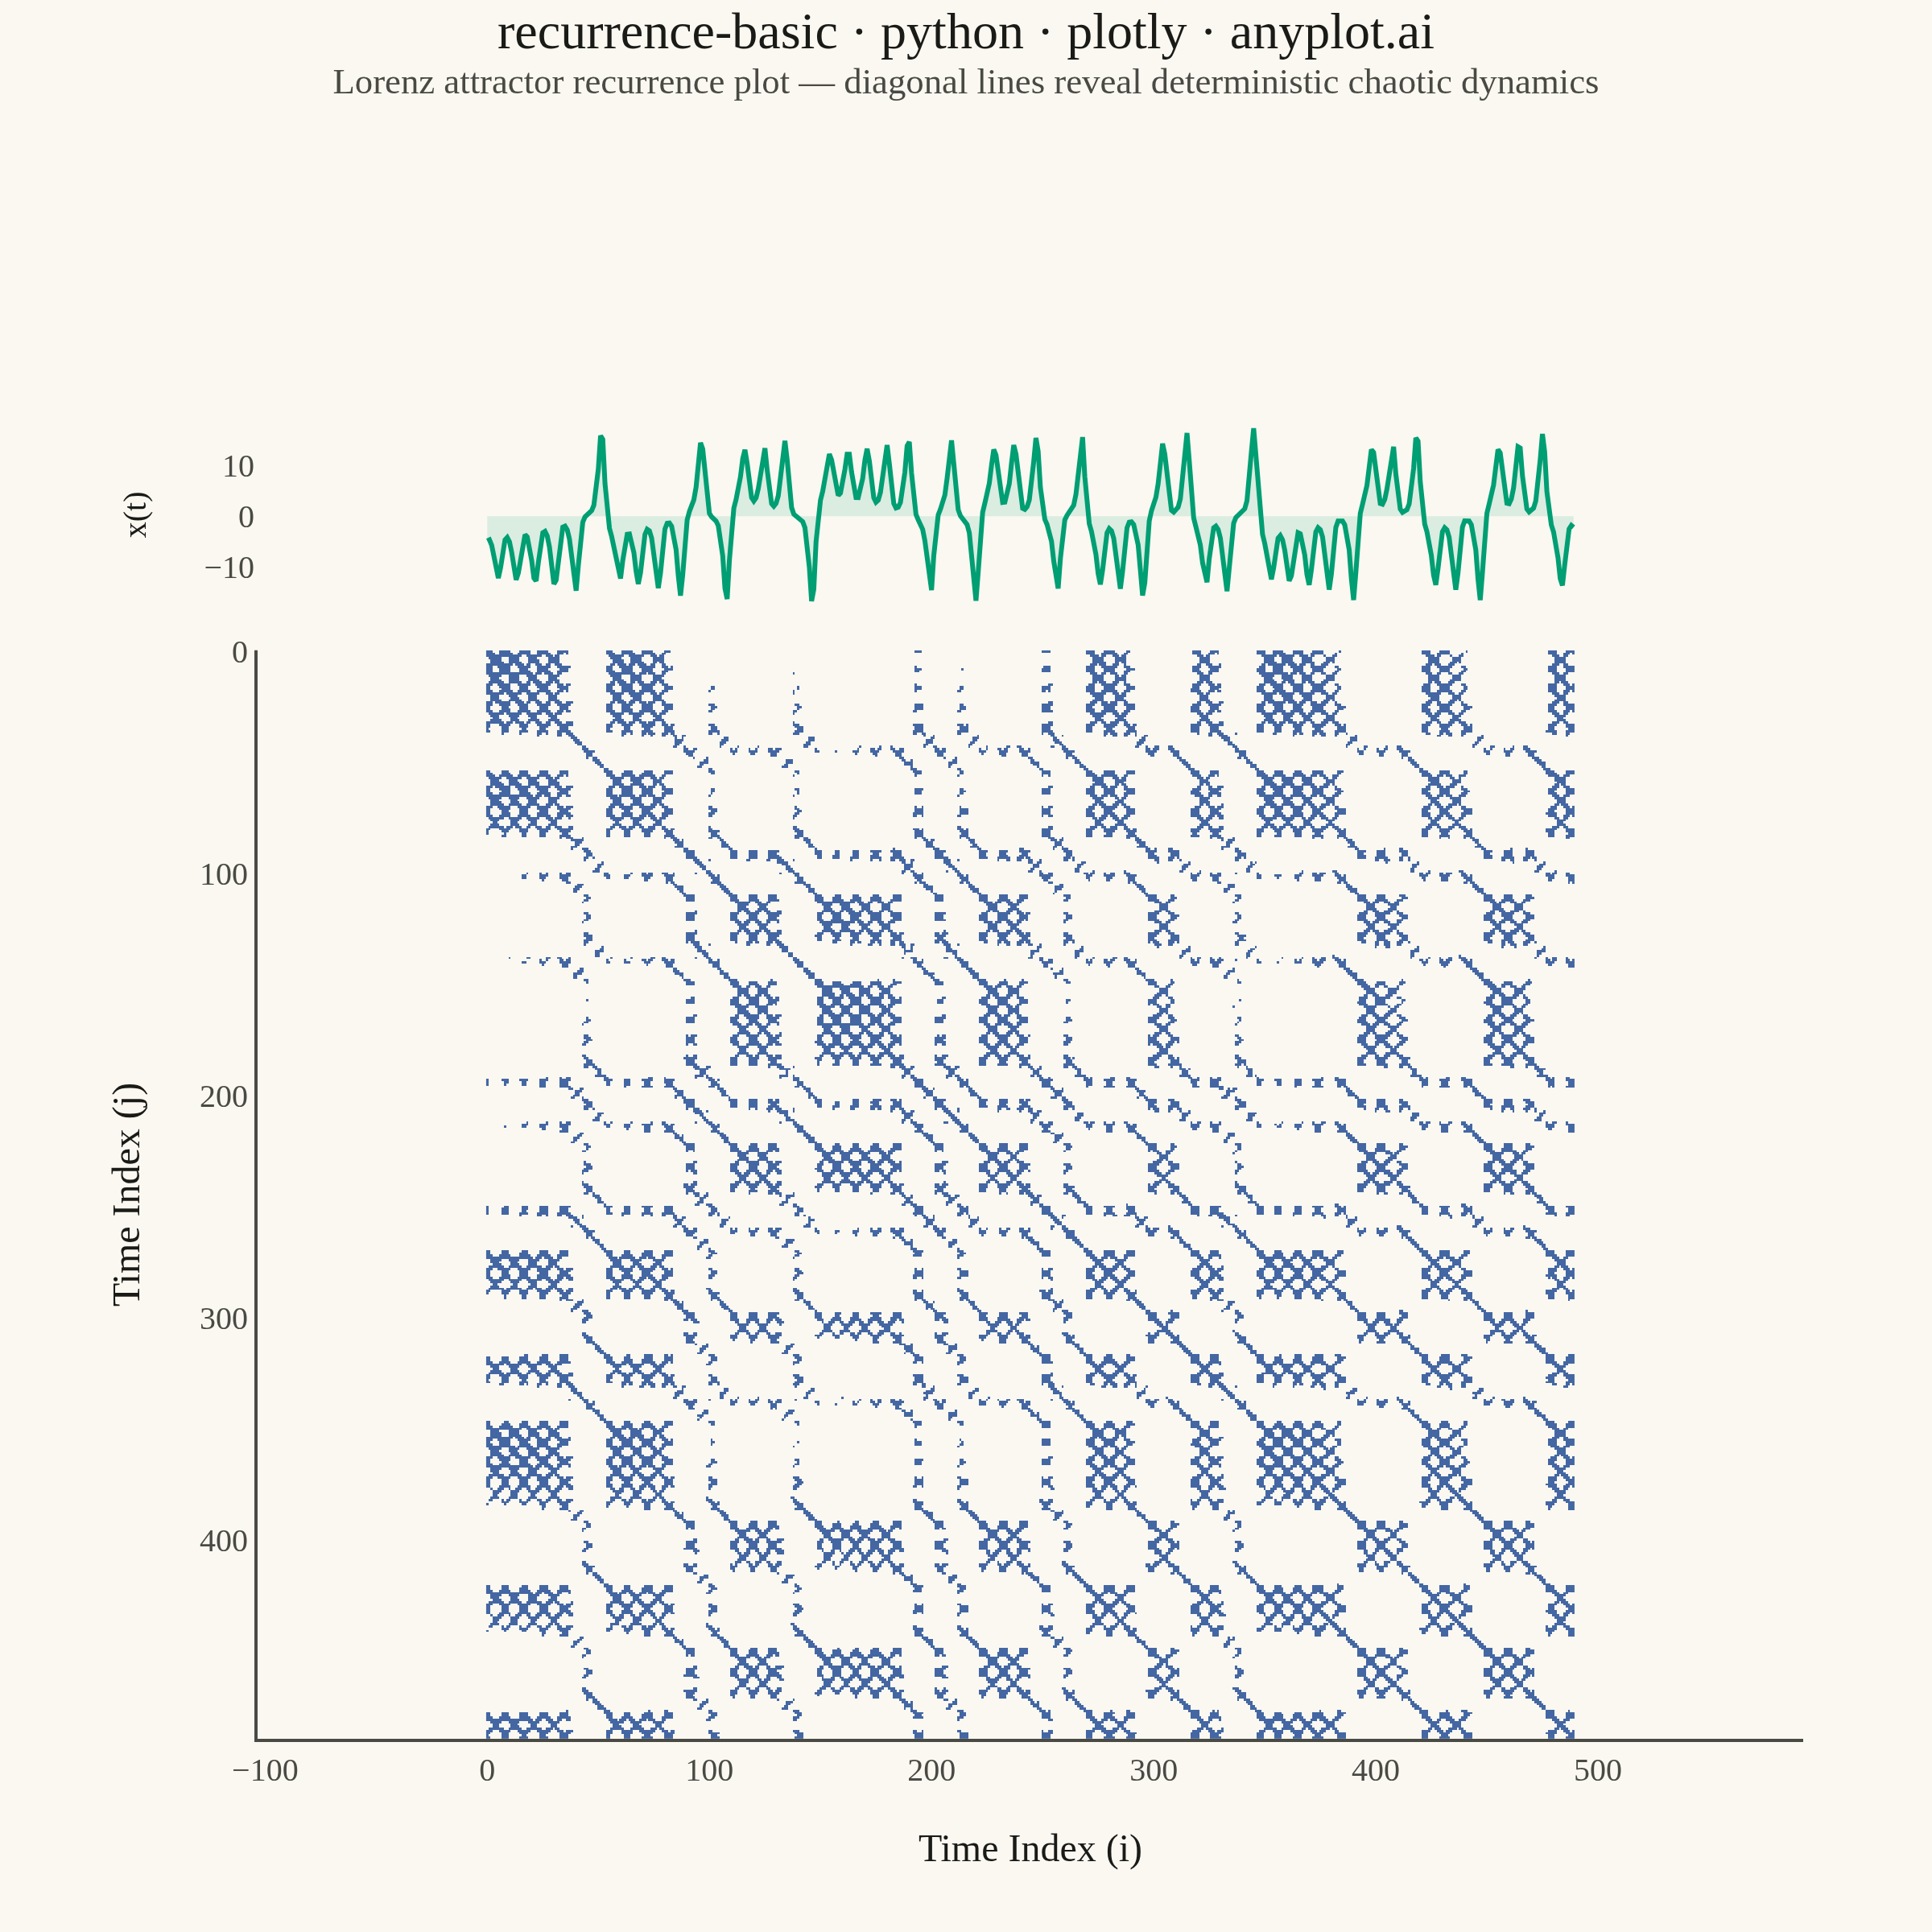
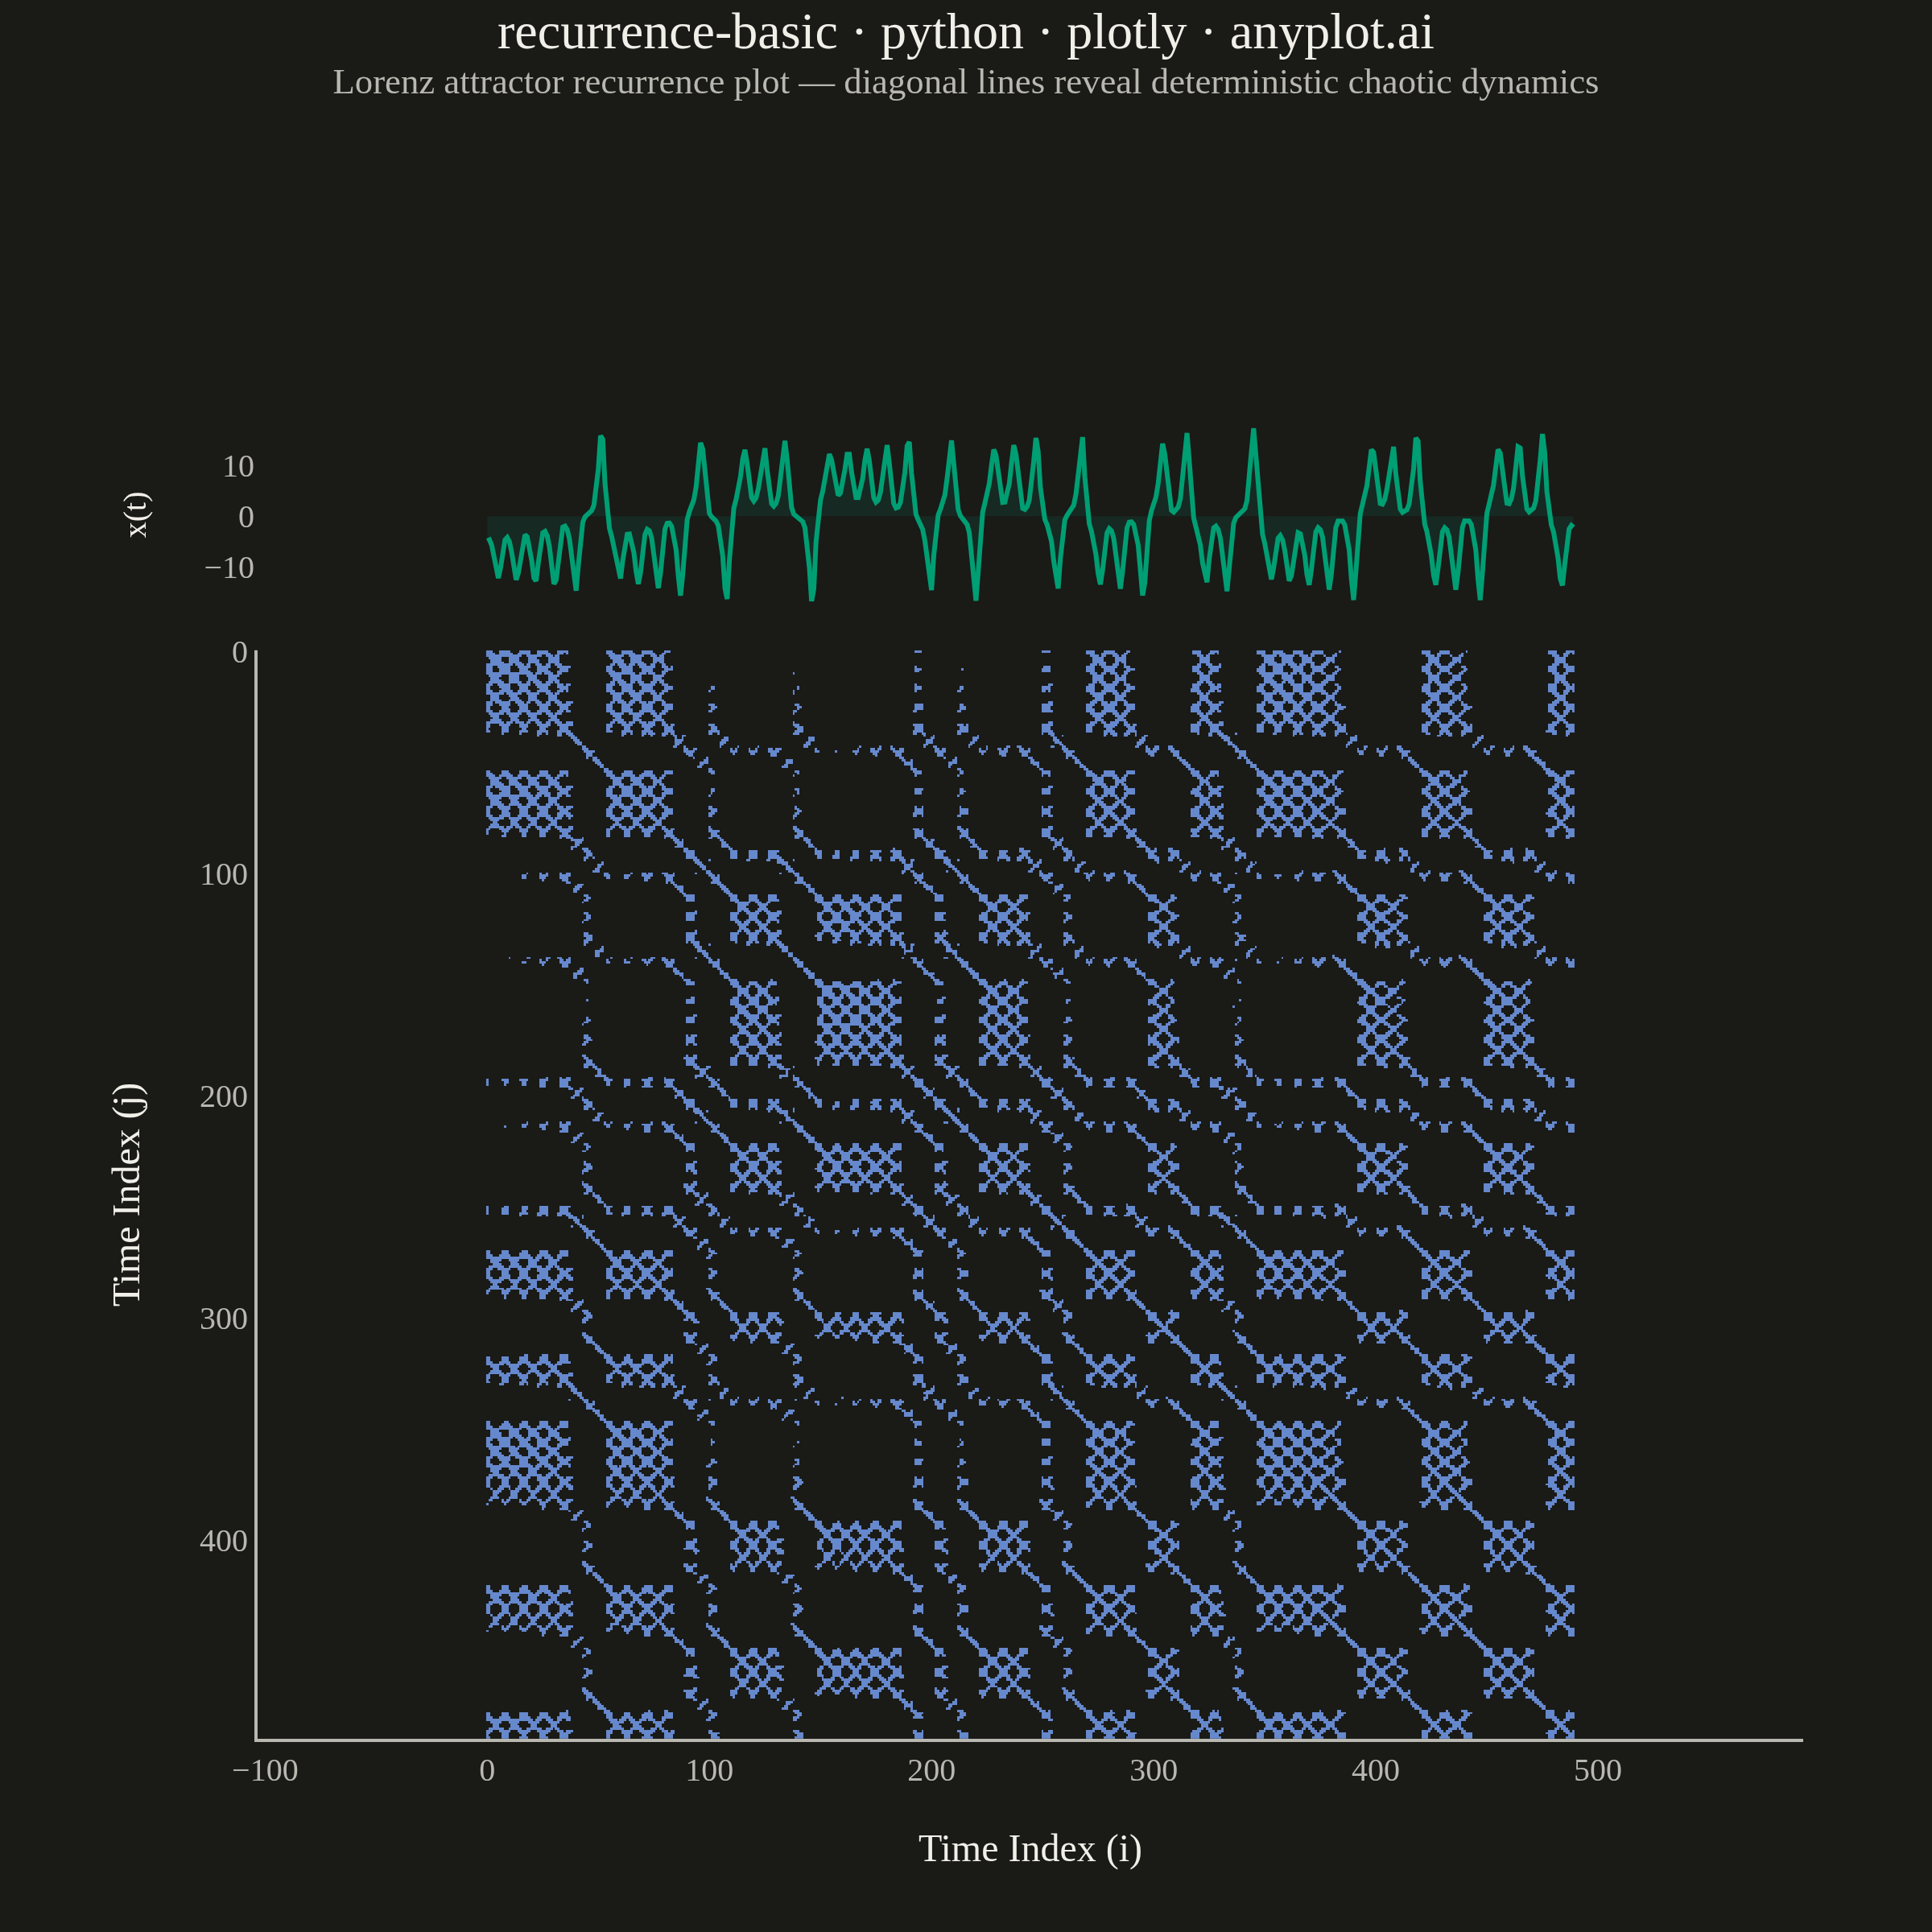
A recurrence plot is a binary or distance-based matrix visualization that reveals when states in a dynamical system recur over time. Both axes represent time indices, and a point is plotted at position (i, j) when the system state at time i is sufficiently similar to the state at time j (distance below a threshold). The resulting symmetric matrix exposes hidden structure in complex, nonlinear dynamics — diagonal lines indicate determinism, vertical/horizontal lines reveal laminar states, and block structures signal regime changes.
""" anyplot.ai
recurrence-basic: Recurrence Plot for Nonlinear Time Series
Library: plotly 6.8.0 | Python 3.13.13
Quality: 85/100 | Updated: 2026-06-10
"""

import os
import sys


# Remove this script's directory from sys.path so "plotly.py" doesn't shadow the installed package
_here = os.path.dirname(os.path.abspath(__file__))
sys.path = [p for p in sys.path if os.path.abspath(p) != _here]

import numpy as np
import plotly.graph_objects as go
from plotly.subplots import make_subplots
from scipy.integrate import solve_ivp
from scipy.spatial.distance import cdist


# Theme tokens (Imprint palette — see prompts/default-style-guide.md)
THEME = os.getenv("ANYPLOT_THEME", "light")
PAGE_BG = "#FAF8F1" if THEME == "light" else "#1A1A17"
ELEVATED_BG = "#FFFDF6" if THEME == "light" else "#242420"
INK = "#1A1A17" if THEME == "light" else "#F0EFE8"
INK_SOFT = "#4A4A44" if THEME == "light" else "#B8B7B0"

# Imprint categorical palette — position 1 (time series), position 3 (recurrent points)
BRAND = "#009E73"  # Imprint position 1 — ALWAYS first series
# Lightened in dark theme to maintain contrast on near-black background (~1.5:1 → ~3:1)
BLUE = "#4467A3" if THEME == "light" else "#6688CC"

# Data — Lorenz attractor x-component, transient removed (integrate from t=0, sample from t=10)
sol = solve_ivp(
    lambda t, s: [10 * (s[1] - s[0]), s[0] * (28 - s[2]) - s[1], s[0] * s[1] - (8 / 3) * s[2]],
    [0, 50],
    [1.0, 1.0, 1.0],
    dense_output=True,
    max_step=0.01,
)
t_eval = np.linspace(10, 50, 500)  # skip initial transient — attractor well-established by t=10
x_series = sol.sol(t_eval)[0]

# Time-delay embedding (Takens' theorem): embed scalar series into phase space
embedding_dim = 3
delay = 5
n_embedded = len(x_series) - (embedding_dim - 1) * delay
embedded = np.column_stack([x_series[i * delay : i * delay + n_embedded] for i in range(embedding_dim)])

# Binary recurrence matrix: 1 where distance ≤ threshold, 0 elsewhere
distance_matrix = cdist(embedded, embedded, metric="euclidean")
threshold = np.percentile(distance_matrix, 15)
recurrence_matrix = (distance_matrix <= threshold).astype(float)
time_indices = np.arange(n_embedded)

# Two-stop binary colorscale: non-recurrent → background, recurrent → Imprint blue
colorscale = [[0.0, PAGE_BG], [1.0, BLUE]]

# Figure with marginal time series panel for context
fig = make_subplots(rows=2, cols=1, row_heights=[0.15, 0.85], vertical_spacing=0.03, shared_xaxes=True)

# Top panel: Lorenz x(t) time series (provides temporal context)
fig.add_trace(
    go.Scatter(
        x=time_indices,
        y=x_series[:n_embedded],
        mode="lines",
        line={"color": BRAND, "width": 1.5},
        fill="tozeroy",
        fillcolor="rgba(0,158,115,0.12)",
        hovertemplate="t: %{x}<br>x(t): %{y:.2f}<extra></extra>",
        showlegend=False,
    ),
    row=1,
    col=1,
)

# Bottom panel: recurrence matrix heatmap
fig.add_trace(
    go.Heatmap(
        z=recurrence_matrix,
        x=time_indices,
        y=time_indices,
        colorscale=colorscale,
        zmin=0,
        zmax=1,
        showscale=False,
        hovertemplate="i: %{x}<br>j: %{y}<br>Recurrent: %{z}<extra></extra>",
        xgap=0,
        ygap=0,
    ),
    row=2,
    col=1,
)

title_text = "recurrence-basic · python · plotly · anyplot.ai"
fig.update_layout(
    autosize=False,
    width=600,
    height=600,
    paper_bgcolor=PAGE_BG,
    plot_bgcolor=PAGE_BG,
    font={"color": INK, "family": "Palatino, Georgia, serif"},
    title={
        "text": (
            title_text
            + "<br><sup style='color:"
            + INK_SOFT
            + "; font-size:12px;'>"
            + "Lorenz attractor recurrence plot — diagonal lines reveal deterministic chaotic dynamics"
            + "</sup>"
        ),
        "font": {"size": 16, "color": INK},
        "x": 0.5,
        "xanchor": "center",
        "y": 0.975,
        "yanchor": "top",
    },
    margin={"l": 80, "r": 40, "t": 130, "b": 60},
)

# Top subplot (time series) axis styling
fig.update_yaxes(
    title={"text": "x(t)", "font": {"size": 10, "color": INK}},
    tickfont={"size": 10, "color": INK_SOFT},
    showgrid=False,
    zeroline=False,
    row=1,
    col=1,
)
fig.update_xaxes(showticklabels=False, showgrid=False, zeroline=False, row=1, col=1)

# Bottom subplot (recurrence matrix) axis styling — constrained square aspect ratio
fig.update_xaxes(
    title={"text": "Time Index (i)", "font": {"size": 12, "color": INK}},
    tickfont={"size": 10, "color": INK_SOFT},
    showgrid=False,
    zeroline=False,
    linecolor=INK_SOFT,
    row=2,
    col=1,
)
fig.update_yaxes(
    title={"text": "Time Index (j)", "font": {"size": 12, "color": INK}},
    tickfont={"size": 10, "color": INK_SOFT},
    scaleanchor="x2",
    scaleratio=1,
    constrain="domain",
    autorange="reversed",
    showgrid=False,
    zeroline=False,
    linecolor=INK_SOFT,
    row=2,
    col=1,
)

# Save — theme-suffixed PNG + HTML (interactive)
fig.write_image(f"plot-{THEME}.png", width=600, height=600, scale=4)
fig.write_html(f"plot-{THEME}.html", include_plotlyjs="cdn")
Runnable source as JSON, for any HTTP client: https://api.anyplot.ai/specs/recurrence-basic/plotly/code. Any spec id and library id listed in llms-full.txt fit the same URL shape; every URL below is complete and callable.
{
  "spec_id": "recurrence-basic",
  "language": "python",
  "library": "plotly",
  "page": "https://anyplot.ai/recurrence-basic/python/plotly",
  "hub": "https://anyplot.ai/recurrence-basic",
  "code_json": "https://api.anyplot.ai/specs/recurrence-basic/plotly/code",
  "spec_json": "https://api.anyplot.ai/specs/recurrence-basic",
  "render_light_png": "https://storage.googleapis.com/anyplot-images/plots/recurrence-basic/python/plotly/plot-light.png",
  "render_dark_png": "https://storage.googleapis.com/anyplot-images/plots/recurrence-basic/python/plotly/plot-dark.png",
  "interactive_light_html": "https://storage.googleapis.com/anyplot-images/plots/recurrence-basic/python/plotly/plot-light.html",
  "interactive_dark_html": "https://storage.googleapis.com/anyplot-images/plots/recurrence-basic/python/plotly/plot-dark.html",
  "quality_score": 85.0,
  "license": "MIT",
  "guide": "https://anyplot.ai/llms.txt"
}
Part of Recurrence Plot for Nonlinear Time Series on anyplot.ai.