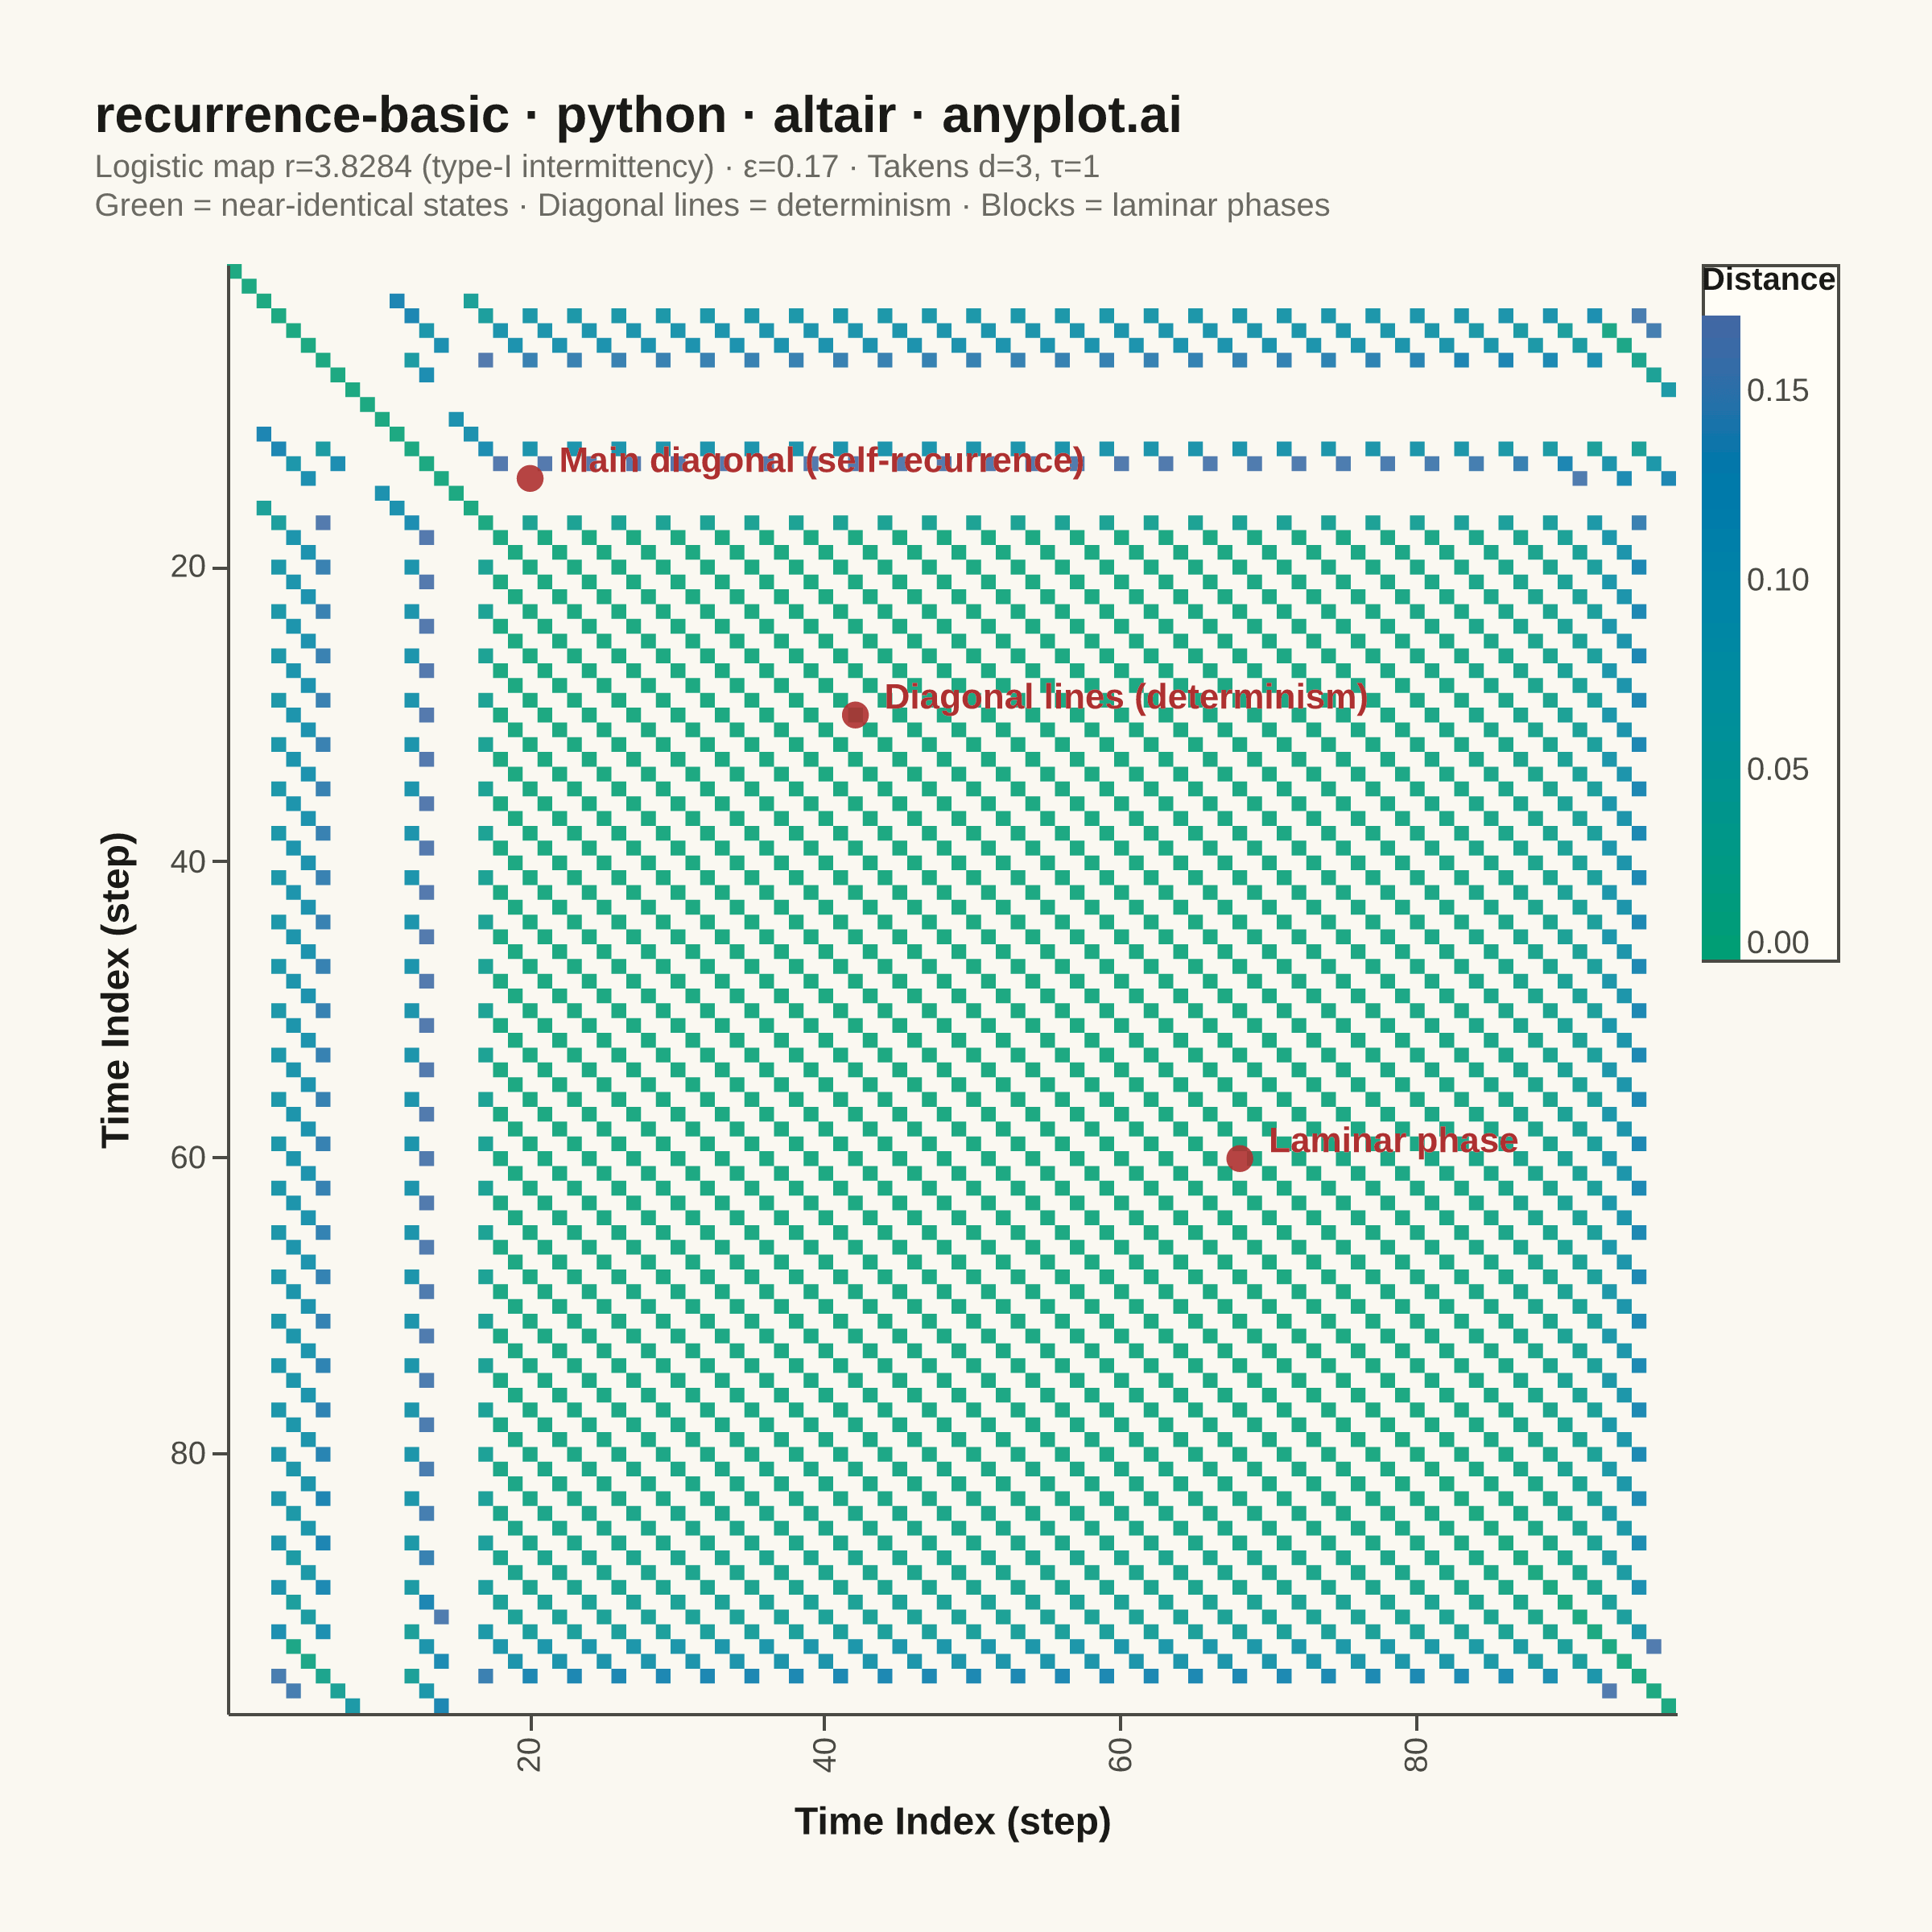
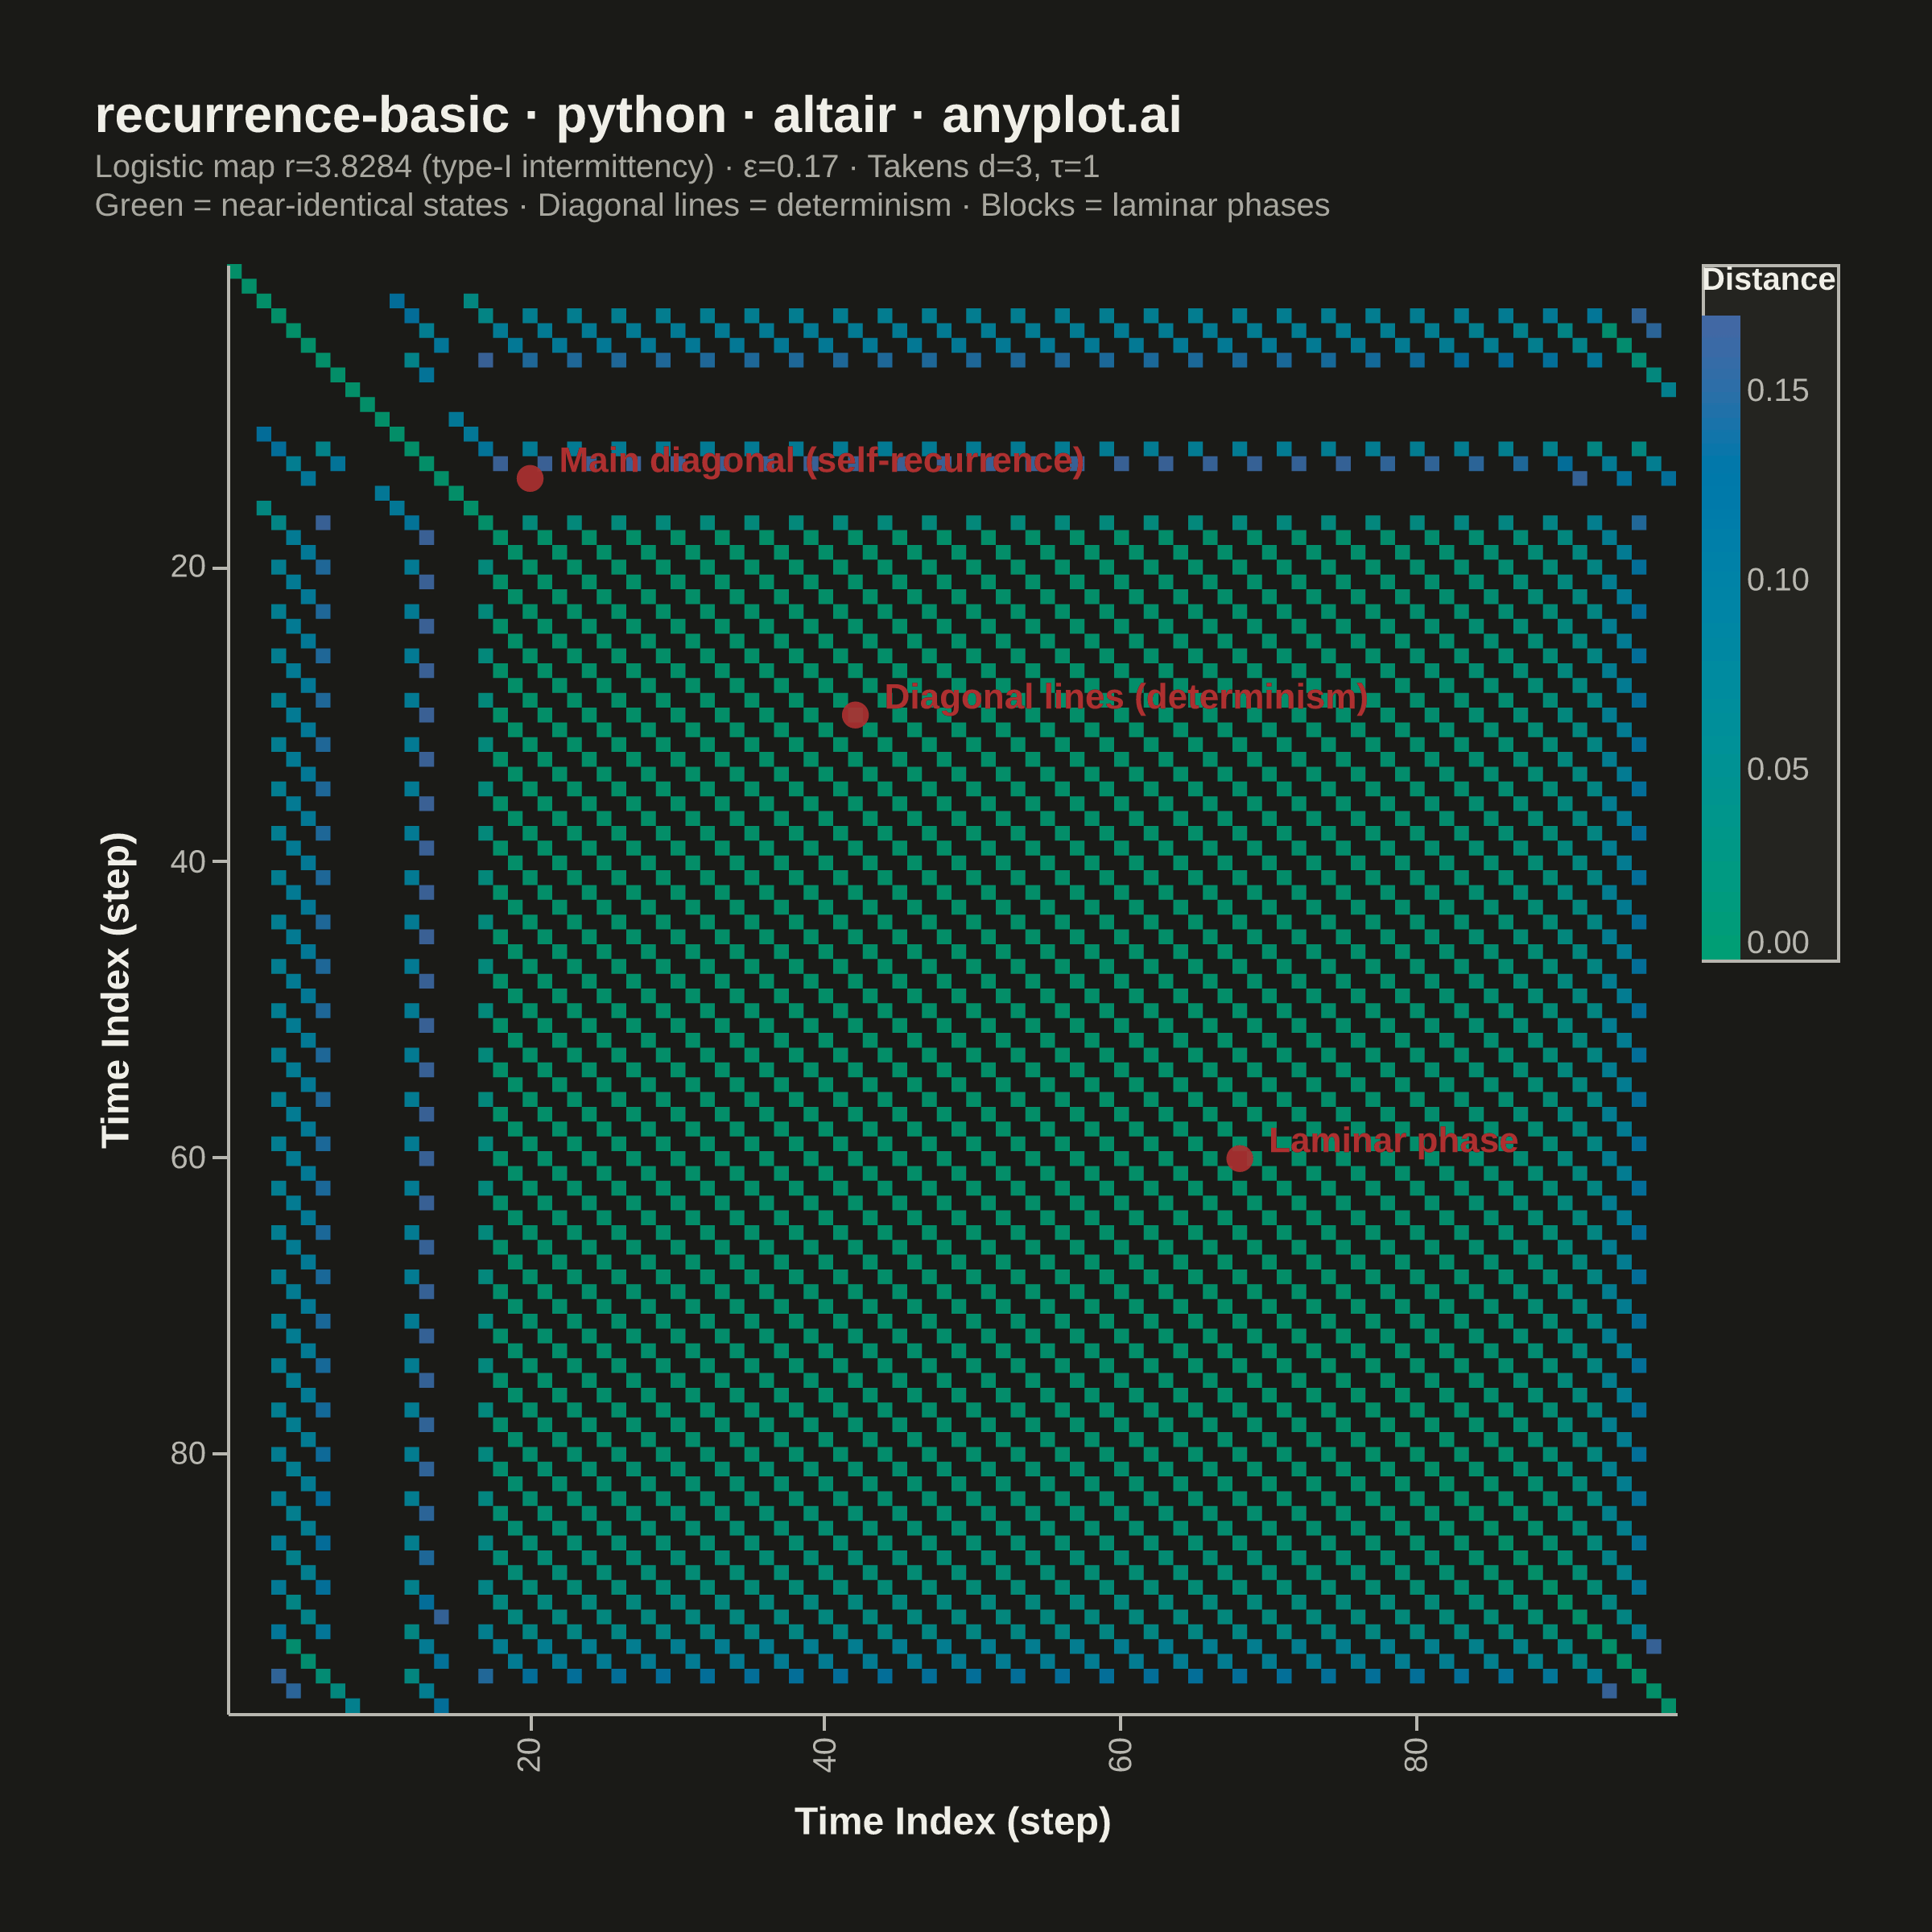
A recurrence plot is a binary or distance-based matrix visualization that reveals when states in a dynamical system recur over time. Both axes represent time indices, and a point is plotted at position (i, j) when the system state at time i is sufficiently similar to the state at time j (distance below a threshold). The resulting symmetric matrix exposes hidden structure in complex, nonlinear dynamics — diagonal lines indicate determinism, vertical/horizontal lines reveal laminar states, and block structures signal regime changes.
""" anyplot.ai
recurrence-basic: Recurrence Plot for Nonlinear Time Series
Library: altair 6.2.1 | Python 3.13.13
Quality: 90/100 | Updated: 2026-06-10
"""

import importlib
import os
import sys

from PIL import Image


# Drop script directory from sys.path so the `altair` package resolves, not this file
sys.path[:] = [p for p in sys.path if os.path.abspath(p or ".") != os.path.dirname(os.path.abspath(__file__))]
alt = importlib.import_module("altair")
np = importlib.import_module("numpy")
pd = importlib.import_module("pandas")

# Theme tokens — Imprint palette, theme-adaptive chrome
THEME = os.getenv("ANYPLOT_THEME", "light")
PAGE_BG = "#FAF8F1" if THEME == "light" else "#1A1A17"
ELEVATED_BG = "#FFFDF6" if THEME == "light" else "#242420"
INK = "#1A1A17" if THEME == "light" else "#F0EFE8"
INK_SOFT = "#4A4A44" if THEME == "light" else "#B8B7B0"
INK_MUTED = "#6B6A63" if THEME == "light" else "#A8A79F"

# Imprint sequential colormap for continuous single-polarity distances
SEQ_LOW = "#009E73"  # brand green — near-identical states (distance ≈ 0)
SEQ_HIGH = "#4467A3"  # blue — close to threshold

# Data — logistic map near type-I intermittency (r = 3.8284)
# 100 steps (reduced from 152) for larger cells; ε=0.17 (raised) for more V/H structure
np.random.seed(42)
n_steps = 100
r = 3.8284
x = np.zeros(n_steps)
x[0] = 0.1
for i in range(1, n_steps):
    x[i] = r * x[i - 1] * (1 - x[i - 1])

# Time-delay embedding (dimension=3, delay=1) per Takens' theorem
embedding_dim = 3
delay = 1
n_embedded = n_steps - (embedding_dim - 1) * delay
embedded = np.column_stack([x[d * delay : d * delay + n_embedded] for d in range(embedding_dim)])

# Pairwise Euclidean distance matrix + threshold
diff = embedded[:, np.newaxis, :] - embedded[np.newaxis, :, :]
distance_matrix = np.sqrt(np.sum(diff**2, axis=2))
threshold = 0.17
recurrence_matrix = distance_matrix < threshold

# Sparse encoding: recurrent points only (absent cells render as PAGE_BG background)
rows, cols = np.where(recurrence_matrix)
distances = distance_matrix[rows, cols]
df = pd.DataFrame({"time_i": rows, "time_j": cols, "distance": distances})

# Interactive hover selection for cross-highlighting
hover = alt.selection_point(on="pointerover", fields=["time_i"], nearest=True, empty=False)

# Imprint sequential scale: distance=0 (self-recurrence) → green; near-threshold → blue
color_scale = alt.Scale(domain=[0, threshold], range=[SEQ_LOW, SEQ_HIGH])

# Recurrence heatmap
heatmap = (
    alt.Chart(df)
    .mark_rect(stroke=None)
    .encode(
        x=alt.X(
            "time_i:O",
            title="Time Index (step)",
            axis=alt.Axis(
                labelFontSize=10,
                titleFontSize=12,
                titlePadding=10,
                values=list(range(0, n_embedded, 20)),
                grid=False,
                domainColor=INK_SOFT,
                tickColor=INK_SOFT,
                labelColor=INK_SOFT,
                titleColor=INK,
            ),
            scale=alt.Scale(paddingInner=0, paddingOuter=0),
        ),
        y=alt.Y(
            "time_j:O",
            title="Time Index (step)",
            axis=alt.Axis(
                labelFontSize=10,
                titleFontSize=12,
                titlePadding=10,
                values=list(range(0, n_embedded, 20)),
                grid=False,
                domainColor=INK_SOFT,
                tickColor=INK_SOFT,
                labelColor=INK_SOFT,
                titleColor=INK,
            ),
            scale=alt.Scale(paddingInner=0, paddingOuter=0),
        ),
        color=alt.Color(
            "distance:Q",
            title="Distance",
            scale=color_scale,
            legend=alt.Legend(
                titleFontSize=10,
                labelFontSize=10,
                orient="right",
                direction="vertical",
                gradientLength=200,
                gradientThickness=12,
                titlePadding=6,
                offset=8,
                labelColor=INK_SOFT,
                titleColor=INK,
            ),
        ),
        opacity=alt.condition(hover, alt.value(1.0), alt.value(0.88)),
        tooltip=[
            alt.Tooltip("time_i:Q", title="Time i"),
            alt.Tooltip("time_j:Q", title="Time j"),
            alt.Tooltip("distance:Q", title="Distance", format=".4f"),
        ],
    )
    .add_params(hover)
)

# Annotation markers for key structural features
annotations_data = pd.DataFrame(
    {
        "label": ["Main diagonal (self-recurrence)", "Laminar phase", "Diagonal lines (determinism)"],
        "x": [20, 68, 42],
        "y": [14, 60, 30],
    }
)

annotation_shadow = (
    alt.Chart(annotations_data)
    .mark_text(fontSize=11, fontWeight="bold", color=PAGE_BG, align="left", dx=9, dy=-5, strokeWidth=3)
    .encode(x=alt.X("x:O"), y=alt.Y("y:O"), text="label:N")
)

annotation_marks = (
    alt.Chart(annotations_data)
    .mark_text(fontSize=11, fontWeight="bold", color="#AE3030", align="left", dx=9, dy=-5)
    .encode(x=alt.X("x:O"), y=alt.Y("y:O"), text="label:N")
)

annotation_dots = (
    alt.Chart(annotations_data)
    .mark_point(size=70, color="#AE3030", filled=True, opacity=0.9)
    .encode(x=alt.X("x:O"), y=alt.Y("y:O"))
)

# Chart assembly — square target 2400 × 2400; inner view 450 × 450 + scale 4.0
title_str = "recurrence-basic · python · altair · anyplot.ai"
chart = (
    alt.layer(heatmap, annotation_dots, annotation_shadow, annotation_marks)
    .properties(
        width=450,
        height=450,
        background=PAGE_BG,
        title=alt.Title(
            title_str,
            subtitle=[
                "Logistic map r=3.8284 (type-I intermittency) · ε=0.17 · Takens d=3, τ=1",
                "Green = near-identical states · Diagonal lines = determinism · Blocks = laminar phases",
            ],
            fontSize=16,
            subtitleFontSize=10,
            subtitleColor=INK_MUTED,
            anchor="start",
            offset=12,
            color=INK,
        ),
        padding={"left": 10, "right": 10, "top": 10, "bottom": 10},
    )
    .configure_axis(grid=False)
    .configure_title(color=INK)
    .configure_view(strokeWidth=0, fill=PAGE_BG)
    .configure_legend(fillColor=ELEVATED_BG, strokeColor=INK_SOFT, labelColor=INK_SOFT, titleColor=INK)
)

# Save PNG then pad to exact 2400 × 2400 (square target)
TW, TH = 2400, 2400
chart.save(f"plot-{THEME}.png", scale_factor=4.0)
_img = Image.open(f"plot-{THEME}.png").convert("RGB")
_w, _h = _img.size
if _w > TW or _h > TH:
    raise SystemExit(
        f"altair vl-convert produced {_w}×{_h}, exceeds target {TW}×{TH}. "
        f"Shrink chart .properties(width=, height=) values and re-render."
    )
if _w < TW or _h < TH:
    _canvas = Image.new("RGB", (TW, TH), PAGE_BG)
    _canvas.paste(_img, ((TW - _w) // 2, (TH - _h) // 2))
    _canvas.save(f"plot-{THEME}.png")

# Save HTML (interactive view)
chart.save(f"plot-{THEME}.html")
Runnable source as JSON, for any HTTP client: https://api.anyplot.ai/specs/recurrence-basic/altair/code. Any spec id and library id listed in llms-full.txt fit the same URL shape; every URL below is complete and callable.
{
  "spec_id": "recurrence-basic",
  "language": "python",
  "library": "altair",
  "page": "https://anyplot.ai/recurrence-basic/python/altair",
  "hub": "https://anyplot.ai/recurrence-basic",
  "code_json": "https://api.anyplot.ai/specs/recurrence-basic/altair/code",
  "spec_json": "https://api.anyplot.ai/specs/recurrence-basic",
  "render_light_png": "https://storage.googleapis.com/anyplot-images/plots/recurrence-basic/python/altair/plot-light.png",
  "render_dark_png": "https://storage.googleapis.com/anyplot-images/plots/recurrence-basic/python/altair/plot-dark.png",
  "interactive_light_html": "https://storage.googleapis.com/anyplot-images/plots/recurrence-basic/python/altair/plot-light.html",
  "interactive_dark_html": "https://storage.googleapis.com/anyplot-images/plots/recurrence-basic/python/altair/plot-dark.html",
  "quality_score": 90.0,
  "license": "MIT",
  "guide": "https://anyplot.ai/llms.txt"
}
Part of Recurrence Plot for Nonlinear Time Series on anyplot.ai.