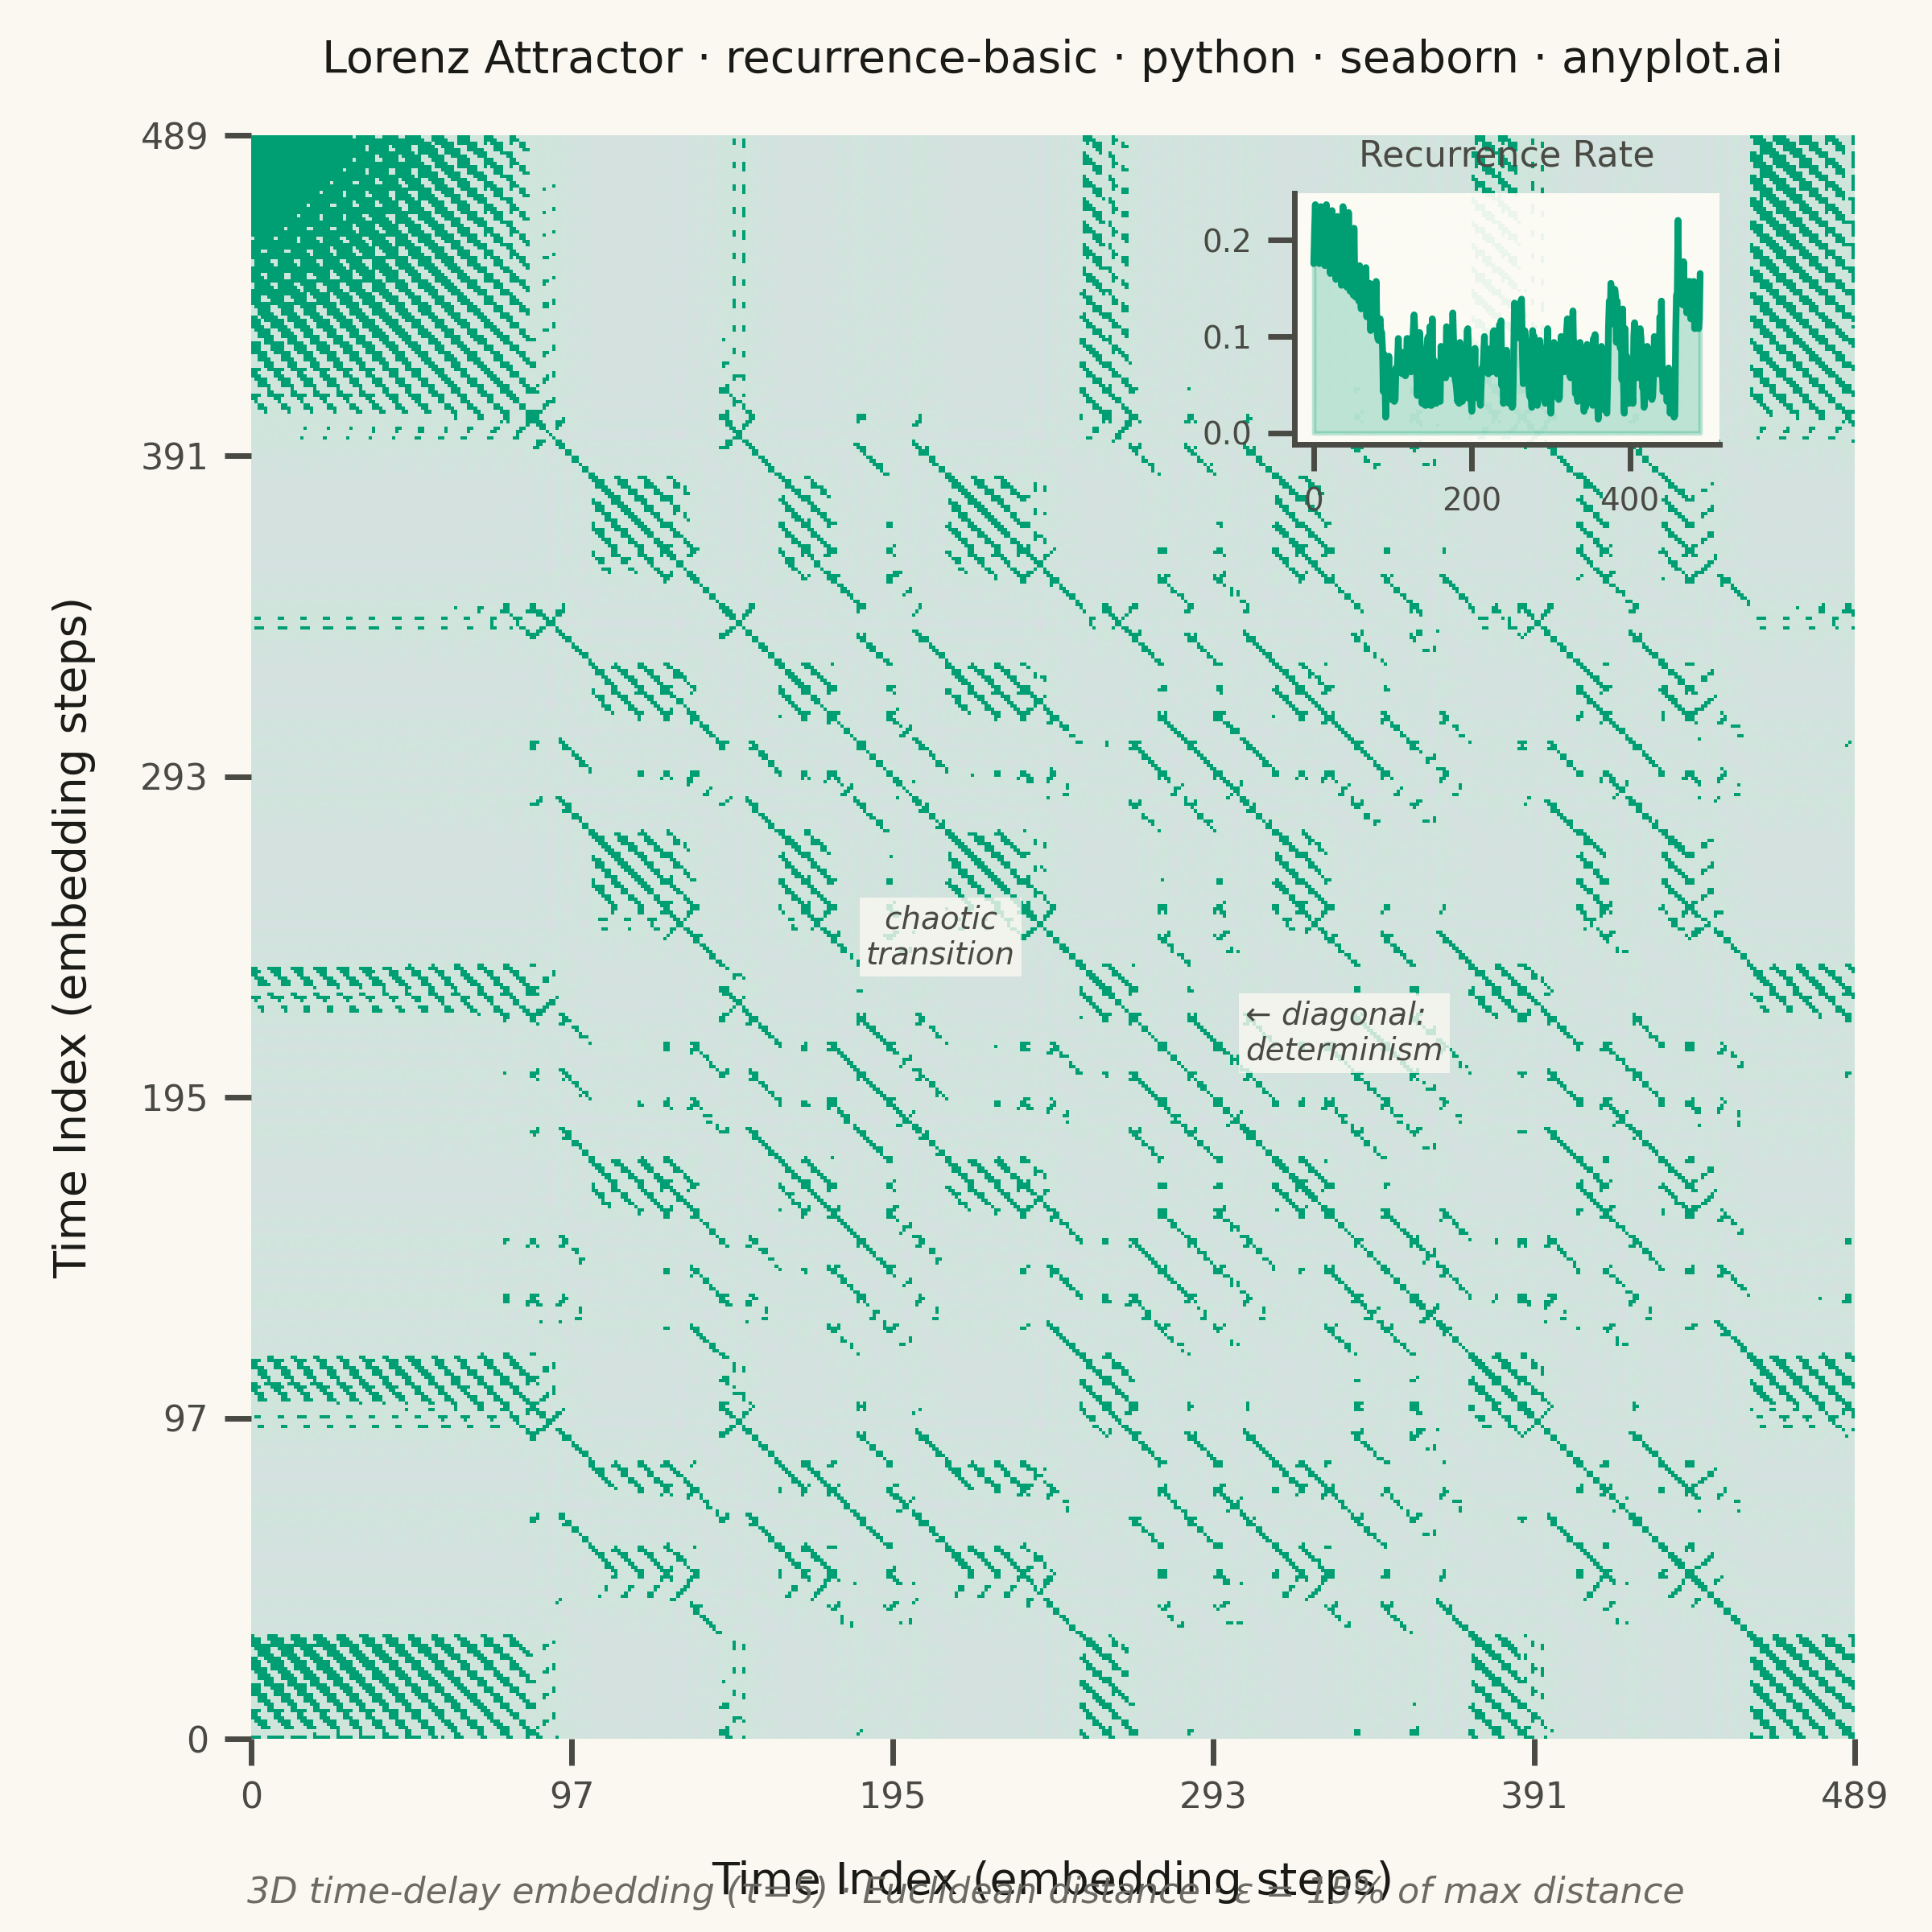
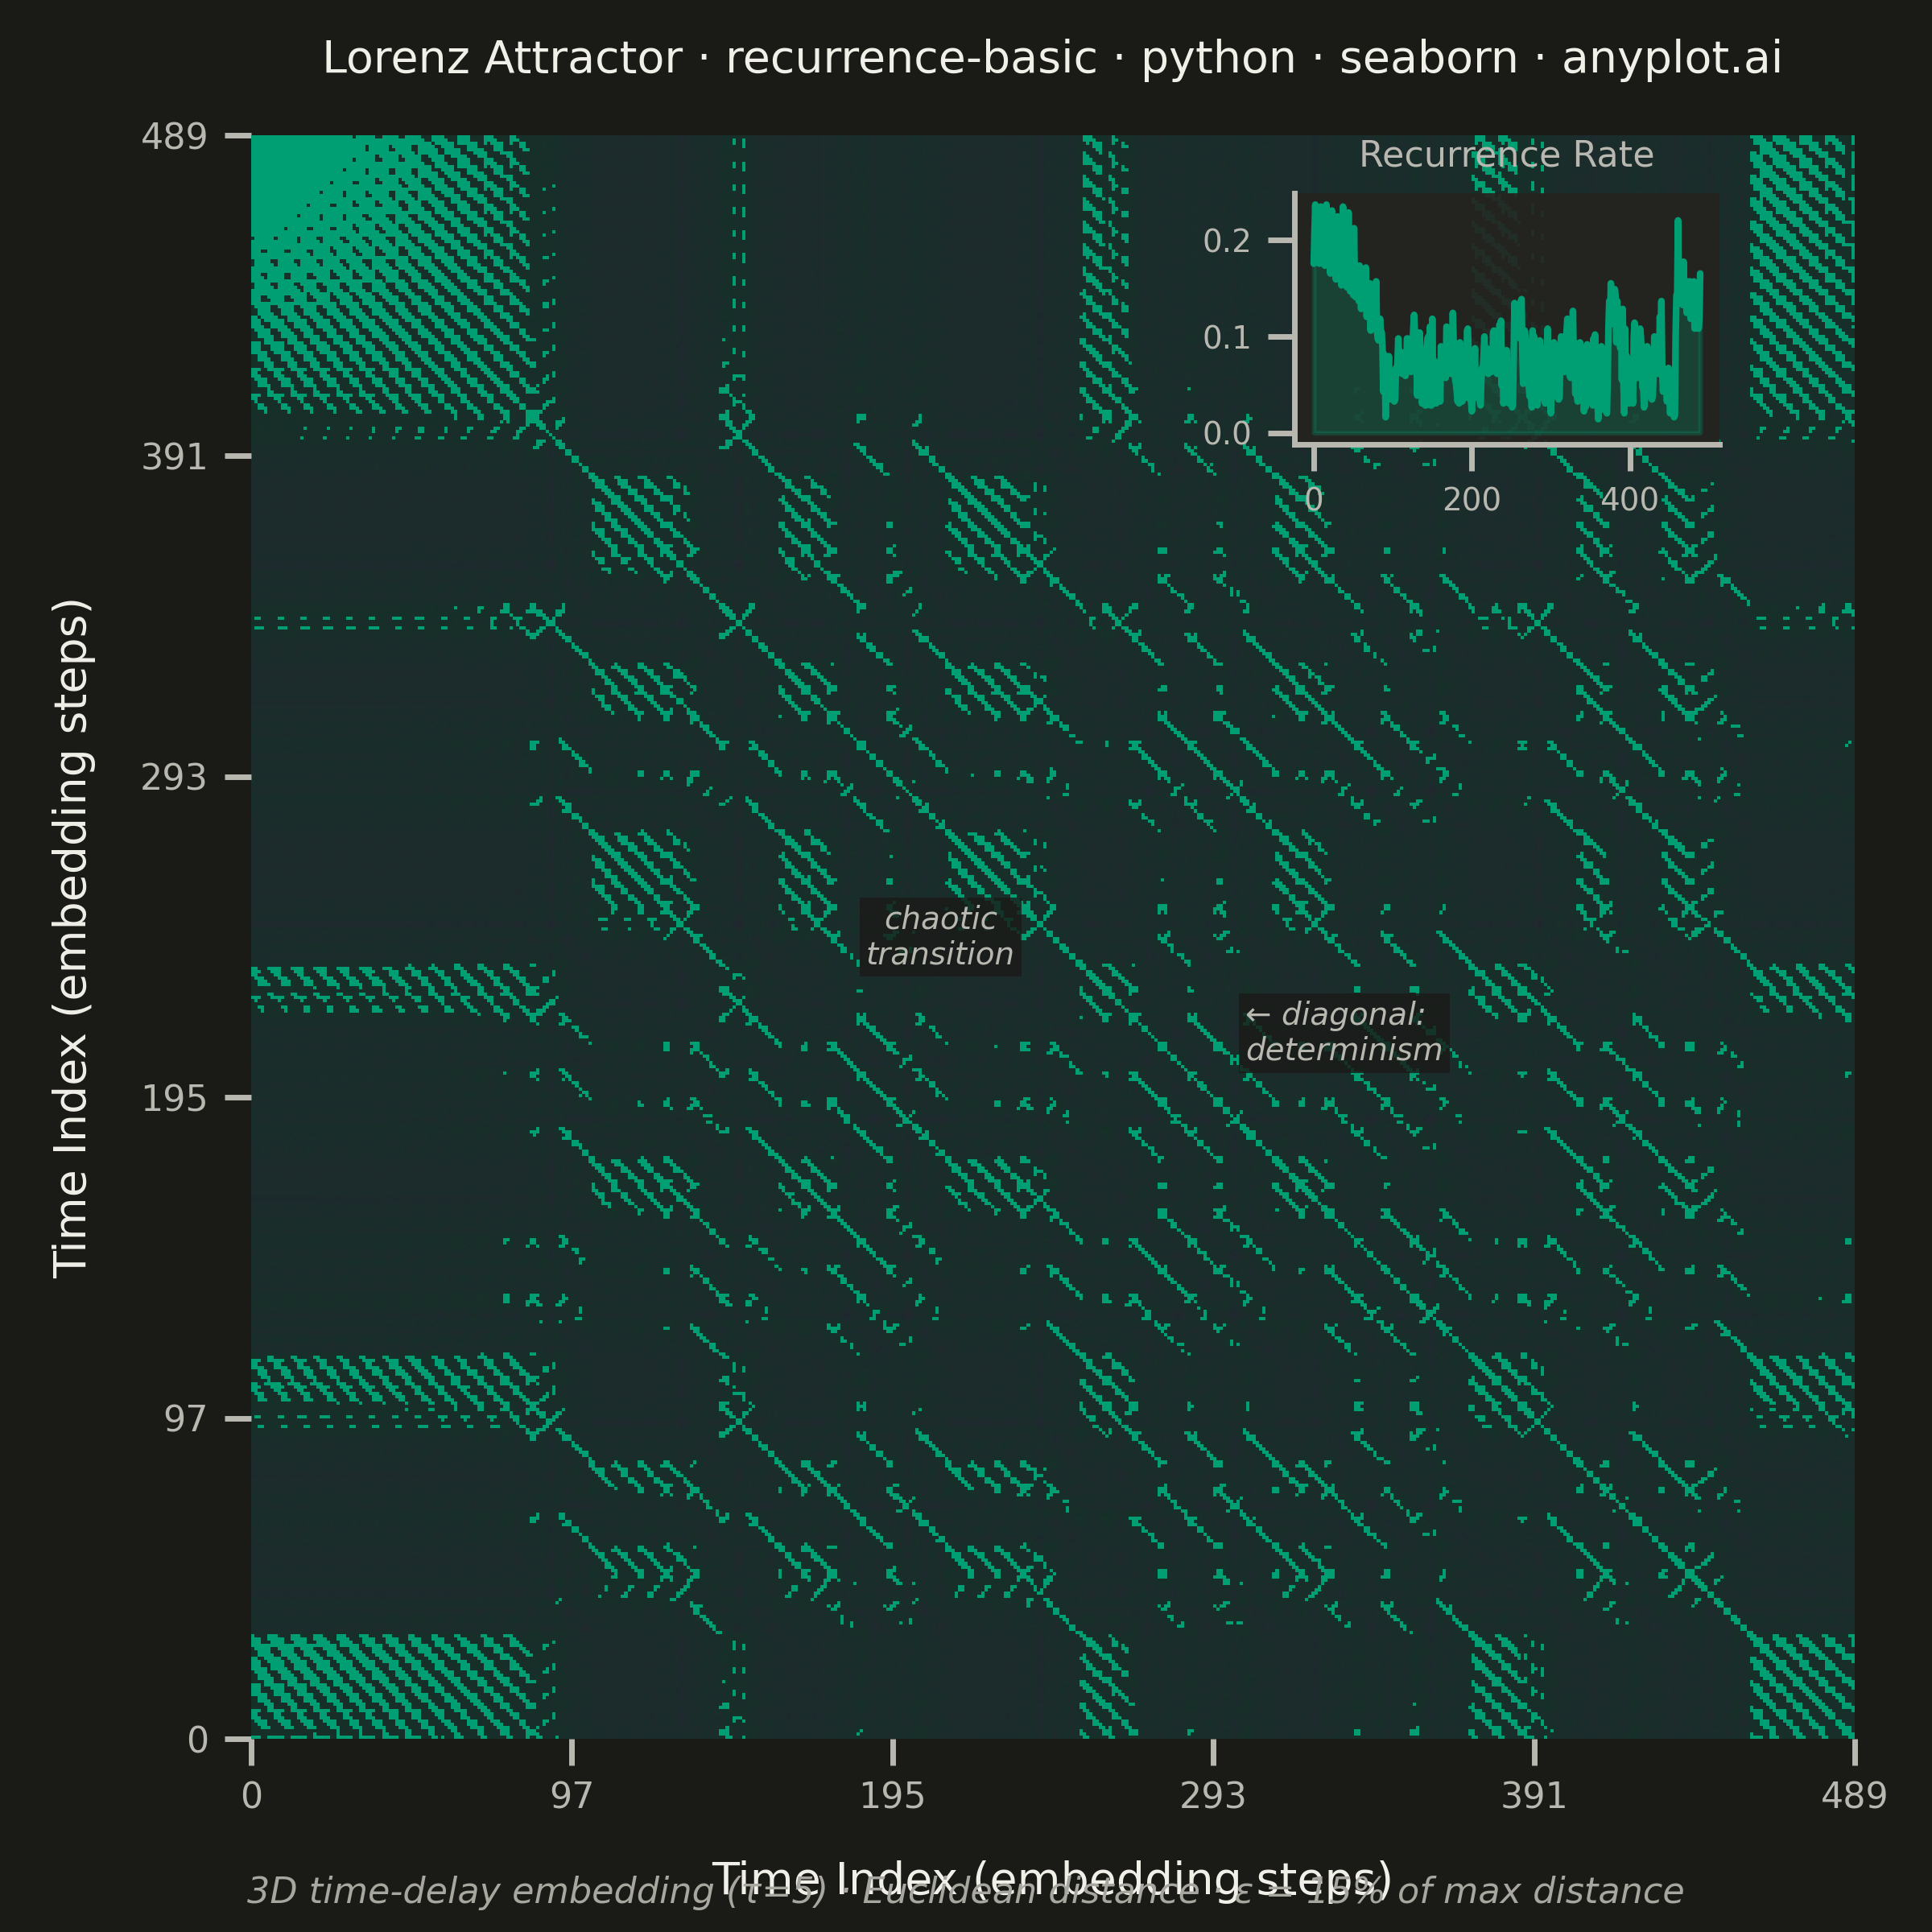
A recurrence plot is a binary or distance-based matrix visualization that reveals when states in a dynamical system recur over time. Both axes represent time indices, and a point is plotted at position (i, j) when the system state at time i is sufficiently similar to the state at time j (distance below a threshold). The resulting symmetric matrix exposes hidden structure in complex, nonlinear dynamics — diagonal lines indicate determinism, vertical/horizontal lines reveal laminar states, and block structures signal regime changes.
""" anyplot.ai
recurrence-basic: Recurrence Plot for Nonlinear Time Series
Library: seaborn 0.13.2 | Python 3.13.13
Quality: 87/100 | Updated: 2026-06-10
"""

import os

import matplotlib.pyplot as plt
import numpy as np
import pandas as pd
import seaborn as sns
from matplotlib.colors import LinearSegmentedColormap, ListedColormap
from scipy.integrate import solve_ivp
from scipy.spatial.distance import cdist


THEME = os.getenv("ANYPLOT_THEME", "light")
PAGE_BG = "#FAF8F1" if THEME == "light" else "#1A1A17"
ELEVATED_BG = "#FFFDF6" if THEME == "light" else "#242420"
INK = "#1A1A17" if THEME == "light" else "#F0EFE8"
INK_SOFT = "#4A4A44" if THEME == "light" else "#B8B7B0"
INK_MUTED = "#6B6A63" if THEME == "light" else "#A8A79F"

# Imprint palette — first series always #009E73
IMPRINT_PALETTE = ["#009E73", "#C475FD", "#4467A3", "#BD8233", "#AE3030", "#2ABCCD", "#954477", "#99B314"]
BRAND = IMPRINT_PALETTE[0]

# Imprint continuous cmap — sequential for single-polarity distance data
imprint_seq = LinearSegmentedColormap.from_list("imprint_seq", ["#009E73", "#4467A3"])

sns.set_theme(
    style="ticks",
    rc={
        "figure.facecolor": PAGE_BG,
        "axes.facecolor": PAGE_BG,
        "axes.edgecolor": INK_SOFT,
        "axes.labelcolor": INK,
        "text.color": INK,
        "xtick.color": INK_SOFT,
        "ytick.color": INK_SOFT,
        "grid.color": INK,
        "grid.alpha": 0.15,
        "legend.facecolor": ELEVATED_BG,
        "legend.edgecolor": INK_SOFT,
    },
)

# Data — Lorenz attractor x-component with 3D time-delay embedding
sol = solve_ivp(
    lambda t, s: [10.0 * (s[1] - s[0]), s[0] * (28.0 - s[2]) - s[1], s[0] * s[1] - 8.0 / 3.0 * s[2]],
    [0, 50],
    [1.0, 1.0, 1.0],
    max_step=0.05,
    dense_output=True,
)
t_eval = np.linspace(5, 50, 500)
x_series = sol.sol(t_eval)[0]

embedding_dim = 3
delay = 5
n_embedded = len(x_series) - (embedding_dim - 1) * delay
embedded = np.column_stack([x_series[i * delay : i * delay + n_embedded] for i in range(embedding_dim)])

distance_matrix = cdist(embedded, embedded, metric="euclidean")
threshold = 0.15 * np.max(distance_matrix)
recurrence_matrix = (distance_matrix <= threshold).astype(int)
norm_distances = distance_matrix / np.max(distance_matrix)

# Square canvas for the symmetric recurrence matrix
fig, ax = plt.subplots(figsize=(6, 6), dpi=400)
fig.patch.set_facecolor(PAGE_BG)
ax.set_facecolor(PAGE_BG)

# Layer 1: Distance background — imprint_seq (sequential, single-polarity)
sns.heatmap(
    norm_distances, cmap=imprint_seq, cbar=False, square=True, xticklabels=False, yticklabels=False, linewidths=0, ax=ax
)
ax.collections[-1].set_alpha(0.18)

# Layer 2: Binary recurrence overlay — seaborn heatmap with mask (seaborn-native)
rec_cmap = ListedColormap([BRAND])
rec_cmap.set_bad(color=(0, 0, 0, 0))  # transparent for non-recurrent cells
sns.heatmap(
    recurrence_matrix.astype(float),
    mask=(recurrence_matrix == 0),
    cmap=rec_cmap,
    cbar=False,
    square=True,
    xticklabels=False,
    yticklabels=False,
    linewidths=0,
    ax=ax,
    vmin=0,
    vmax=1,
)

# Spines
ax.spines["top"].set_visible(False)
ax.spines["right"].set_visible(False)
ax.spines["left"].set_color(INK_SOFT)
ax.spines["bottom"].set_color(INK_SOFT)

# Tick labels at 6 evenly-spaced positions
n_ticks = 6
tick_pos = np.linspace(0, n_embedded, n_ticks)
tick_lab = [f"{int(v)}" for v in np.linspace(0, n_embedded - 1, n_ticks)]
ax.set_xticks(tick_pos)
ax.set_xticklabels(tick_lab, fontsize=8, color=INK_SOFT)
ax.set_yticks(tick_pos)
ax.set_yticklabels(tick_lab[::-1], fontsize=8, color=INK_SOFT, rotation=0)

ax.set_xlabel("Time Index (embedding steps)", fontsize=10, color=INK, labelpad=10)
ax.set_ylabel("Time Index (embedding steps)", fontsize=10, color=INK, labelpad=10)
title = "Lorenz Attractor · recurrence-basic · python · seaborn · anyplot.ai"
ax.set_title(title, fontsize=10, fontweight="medium", color=INK, pad=14)

# Story annotations — guide viewer to key structural features
_ann = {
    "fontsize": 7,
    "color": INK_SOFT,
    "style": "italic",
    "bbox": {"facecolor": PAGE_BG, "edgecolor": "none", "alpha": 0.80, "pad": 1.5},
}
ax.text(n_embedded * 0.62, n_embedded * 0.56, "← diagonal:\ndeterminism", ha="left", va="center", **_ann)
ax.text(n_embedded * 0.43, n_embedded * 0.50, "chaotic\ntransition", ha="center", va="center", **_ann)

# Inset: recurrence rate over time — seaborn lineplot (repositioned upper-right)
recurrence_rate = recurrence_matrix.sum(axis=1) / n_embedded
ax_inset = fig.add_axes([0.67, 0.77, 0.22, 0.13])
ax_inset.set_facecolor(ELEVATED_BG)
ax_inset.patch.set_alpha(0.93)
rate_df = pd.DataFrame({"Time": np.arange(n_embedded), "Rate": recurrence_rate})
sns.lineplot(data=rate_df, x="Time", y="Rate", color=BRAND, linewidth=1.5, ax=ax_inset)
ax_inset.fill_between(rate_df["Time"], rate_df["Rate"], alpha=0.25, color=BRAND)
ax_inset.set_title("Recurrence Rate", fontsize=8, color=INK_SOFT)
ax_inset.set_xlabel("")
ax_inset.set_ylabel("")
ax_inset.tick_params(labelsize=7, colors=INK_SOFT)
sns.despine(ax=ax_inset)
ax_inset.spines["left"].set_color(INK_SOFT)
ax_inset.spines["bottom"].set_color(INK_SOFT)

# Footnote
fig.text(
    0.5,
    0.015,
    "3D time-delay embedding (τ=5) · Euclidean distance · ε = 15% of max distance",
    ha="center",
    fontsize=8,
    color=INK_MUTED,
    style="italic",
)

fig.subplots_adjust(bottom=0.09, left=0.13, right=0.96, top=0.94)
plt.savefig(f"plot-{THEME}.png", dpi=400, facecolor=PAGE_BG)
Runnable source as JSON, for any HTTP client: https://api.anyplot.ai/specs/recurrence-basic/seaborn/code. Any spec id and library id listed in llms-full.txt fit the same URL shape; every URL below is complete and callable.
{
  "spec_id": "recurrence-basic",
  "language": "python",
  "library": "seaborn",
  "page": "https://anyplot.ai/recurrence-basic/python/seaborn",
  "hub": "https://anyplot.ai/recurrence-basic",
  "code_json": "https://api.anyplot.ai/specs/recurrence-basic/seaborn/code",
  "spec_json": "https://api.anyplot.ai/specs/recurrence-basic",
  "render_light_png": "https://storage.googleapis.com/anyplot-images/plots/recurrence-basic/python/seaborn/plot-light.png",
  "render_dark_png": "https://storage.googleapis.com/anyplot-images/plots/recurrence-basic/python/seaborn/plot-dark.png",
  "quality_score": 87.0,
  "license": "MIT",
  "guide": "https://anyplot.ai/llms.txt"
}
Part of Recurrence Plot for Nonlinear Time Series on anyplot.ai.