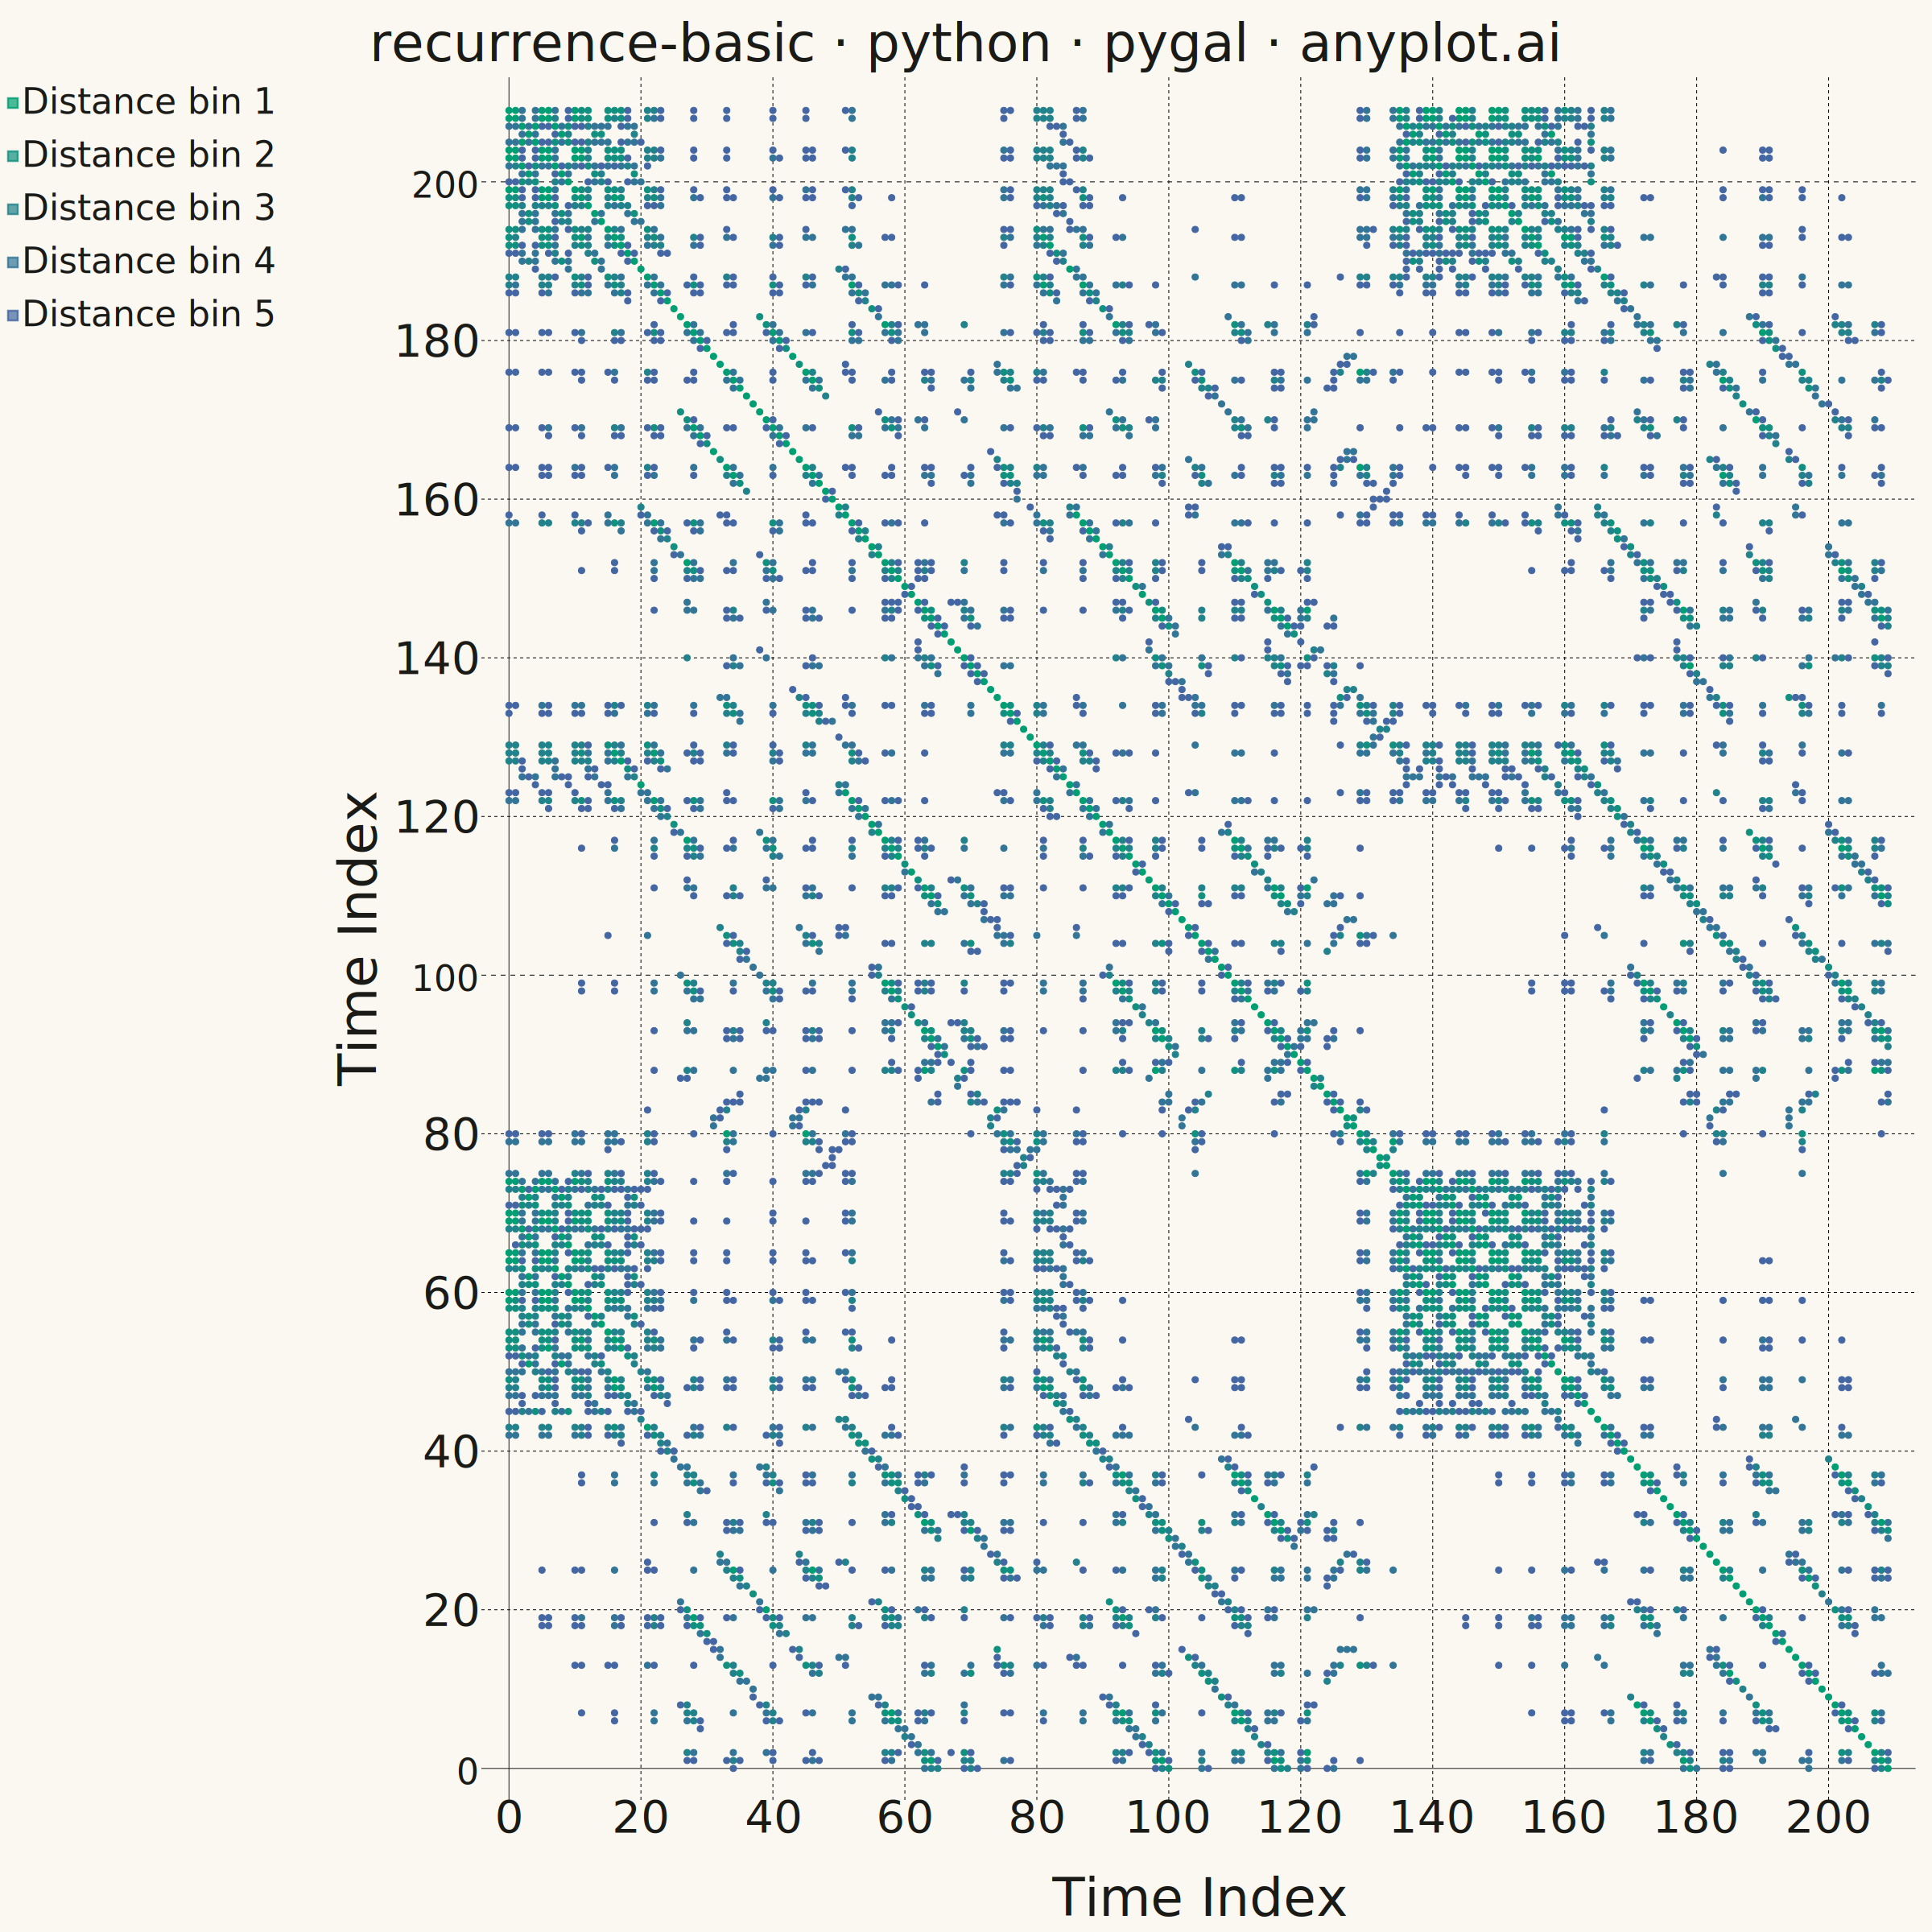
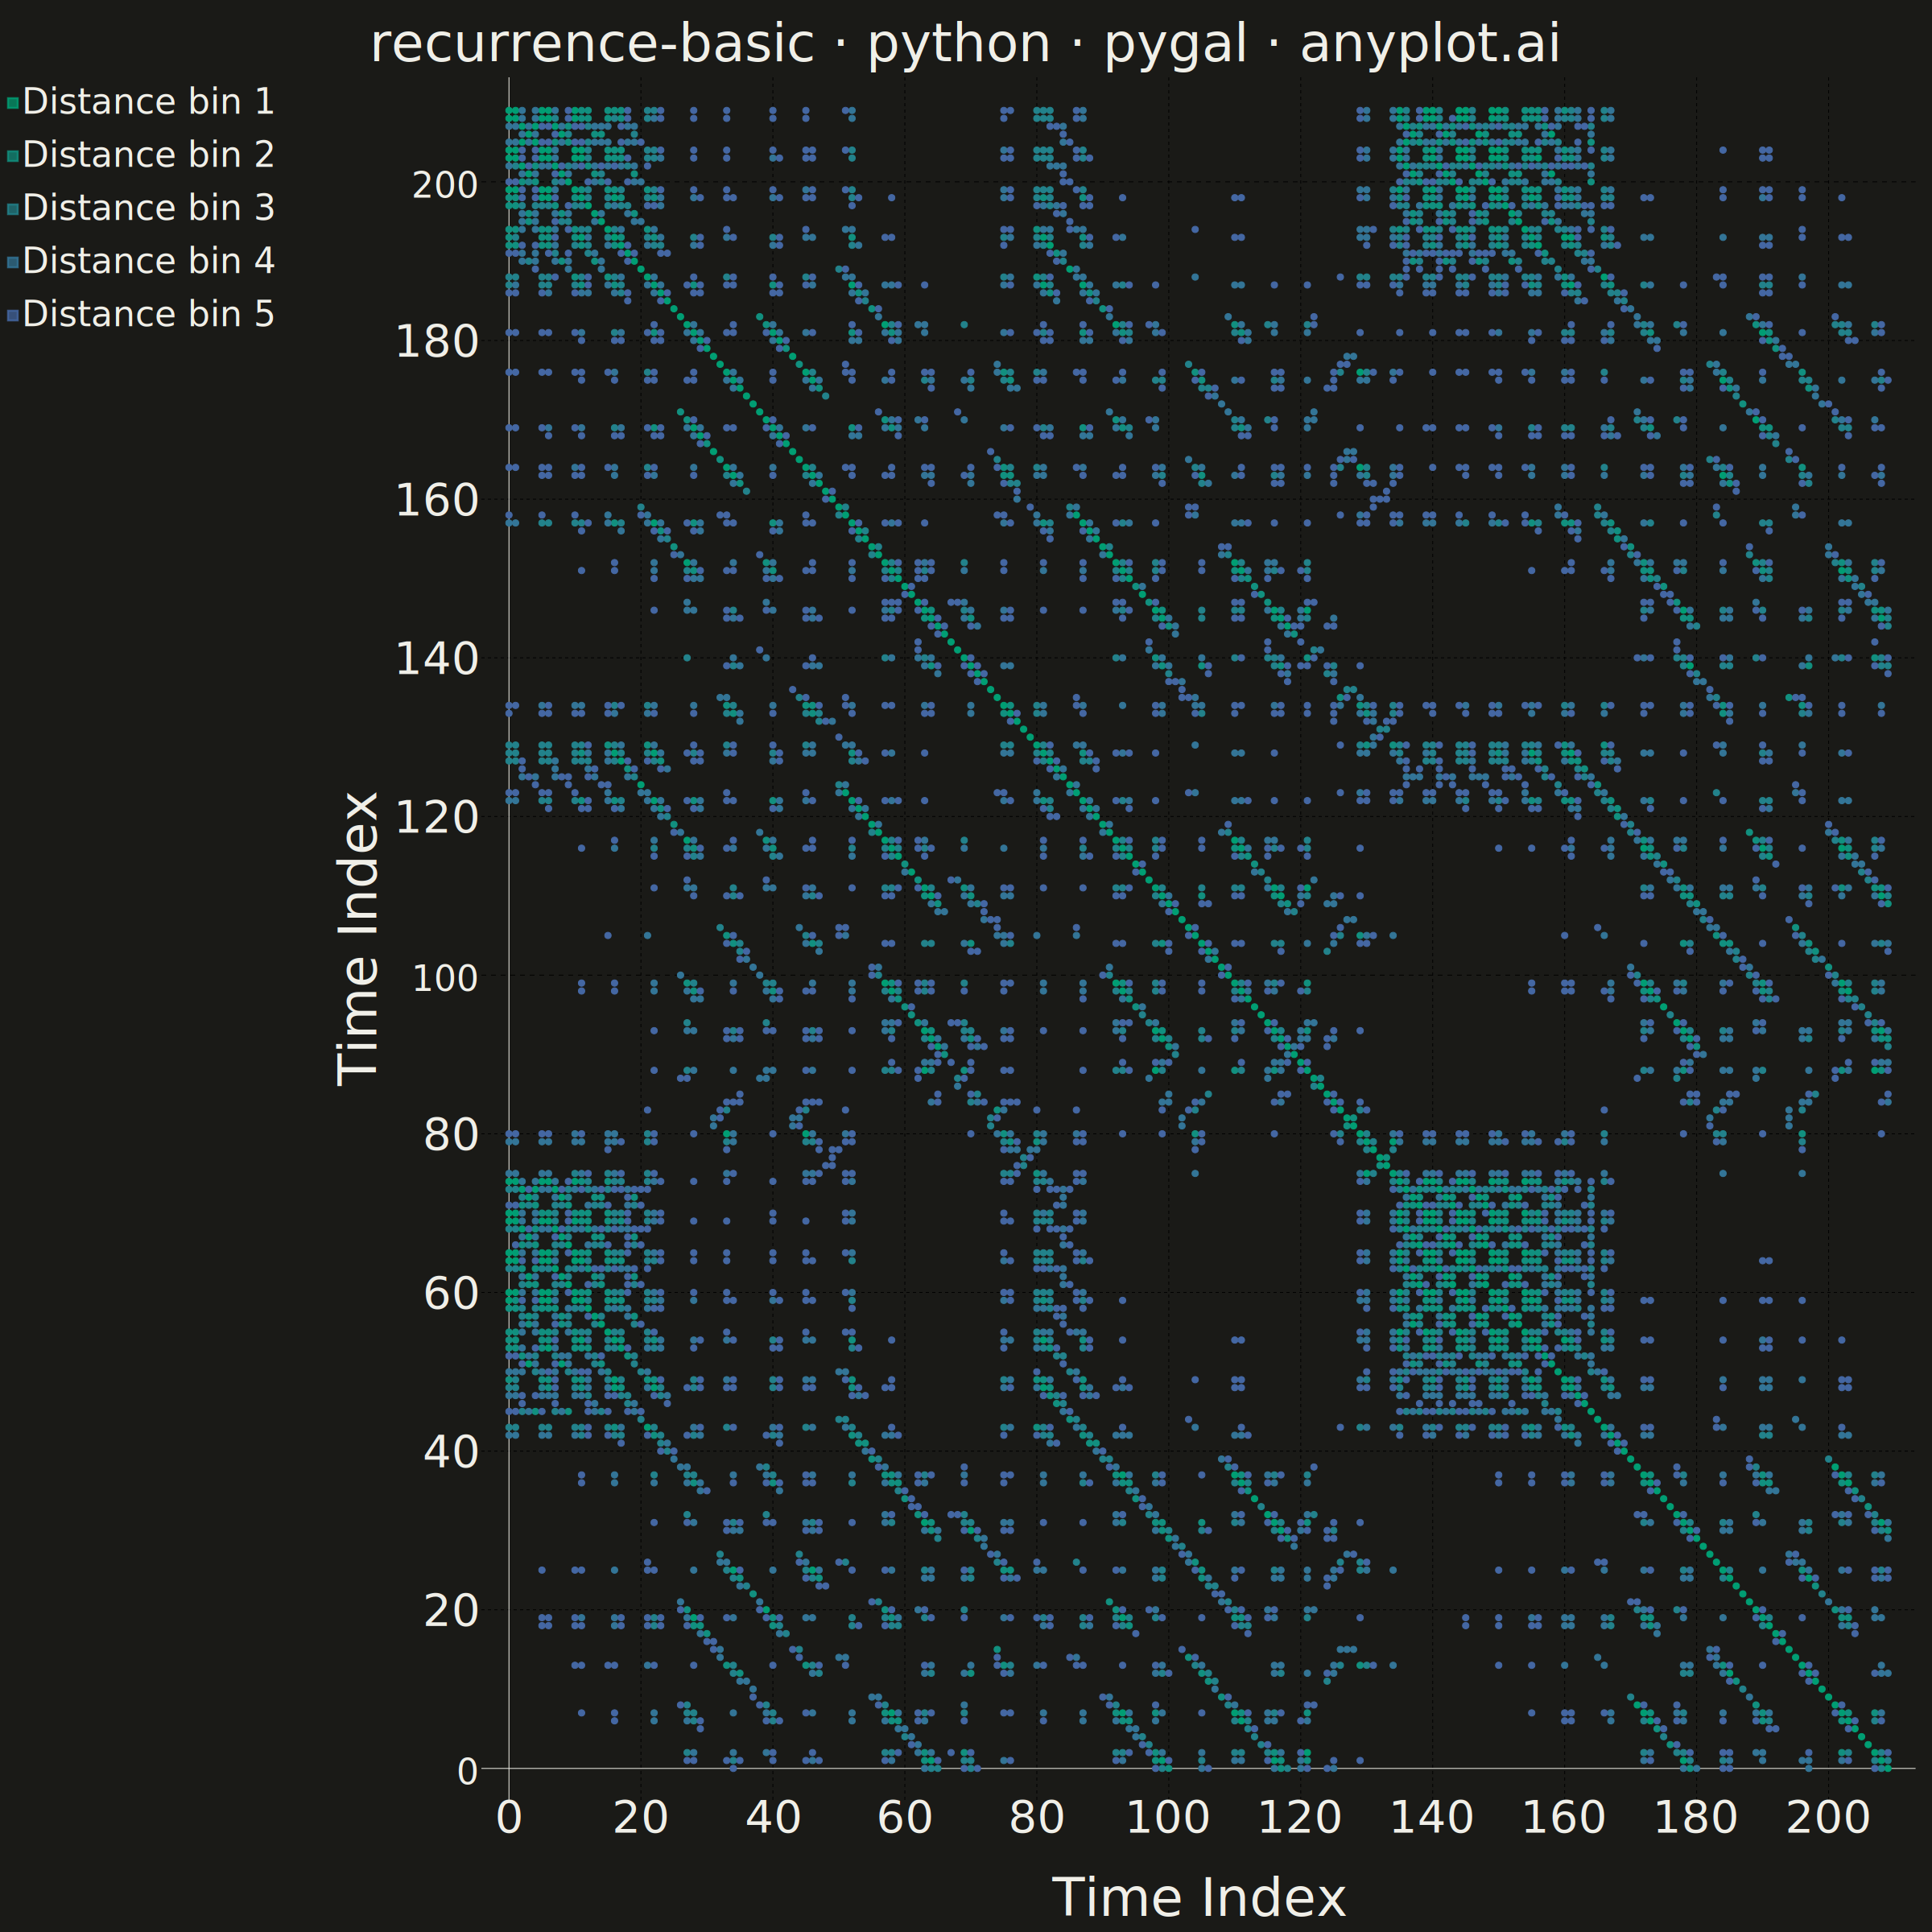
A recurrence plot is a binary or distance-based matrix visualization that reveals when states in a dynamical system recur over time. Both axes represent time indices, and a point is plotted at position (i, j) when the system state at time i is sufficiently similar to the state at time j (distance below a threshold). The resulting symmetric matrix exposes hidden structure in complex, nonlinear dynamics — diagonal lines indicate determinism, vertical/horizontal lines reveal laminar states, and block structures signal regime changes.
""" anyplot.ai
recurrence-basic: Recurrence Plot for Nonlinear Time Series
Library: pygal 3.1.0 | Python 3.13.13
Quality: 86/100 | Updated: 2026-06-10
"""

import os
import sys
from pathlib import Path

import numpy as np
from scipy.integrate import solve_ivp
from scipy.spatial.distance import cdist


# File is named pygal.py — remove local dir so Python finds the installed package
_local = str(Path(__file__).parent)
if _local in sys.path:
    sys.path.remove(_local)

import pygal
from pygal.style import Style


# Theme tokens (Imprint palette + adaptive chrome)
THEME = os.getenv("ANYPLOT_THEME", "light")
PAGE_BG = "#FAF8F1" if THEME == "light" else "#1A1A17"
INK = "#1A1A17" if THEME == "light" else "#F0EFE8"
INK_MUTED = "#6B6A63" if THEME == "light" else "#A8A79F"

# Imprint sequential colormap: brand green (#009E73) → blue (#4467A3), 5 stops
# Bin 0 = nearest recurrent states (dark green), Bin 4 = farthest (blue)
N_BINS = 5
SEQ_COLORS = tuple(
    "#{:02X}{:02X}{:02X}".format(
        round(0x00 + (0x44 - 0x00) * i / (N_BINS - 1)),
        round(0x9E + (0x67 - 0x9E) * i / (N_BINS - 1)),
        round(0x73 + (0xA3 - 0x73) * i / (N_BINS - 1)),
    )
    for i in range(N_BINS)
)

# Data: Lorenz attractor x-component with time-delay embedding
np.random.seed(42)
sol = solve_ivp(
    lambda t, s: [10.0 * (s[1] - s[0]), s[0] * (28.0 - s[2]) - s[1], s[0] * s[1] - (8.0 / 3.0) * s[2]],
    [0, 40],
    [1.0, 1.0, 1.0],
    t_eval=np.linspace(0, 40, 4000),
    method="RK45",
)
x_raw = sol.y[0, 1000:]
stride = max(1, len(x_raw) // 220)
x_series = x_raw[::stride][:220]

emb_dim, emb_delay = 3, 5
n_pts = len(x_series) - (emb_dim - 1) * emb_delay
embedded = np.array([[x_series[k + d * emb_delay] for d in range(emb_dim)] for k in range(n_pts)])
dist_matrix = cdist(embedded, embedded, metric="euclidean")

# Threshold giving ~15% recurrence rate
sorted_dists = np.sort(dist_matrix.ravel())
epsilon = sorted_dists[int(0.15 * len(sorted_dists))]

# Group recurrent pairs into distance bins; flip y so time-0 appears at top-left
bin_data = [[] for _ in range(N_BINS)]
for i in range(n_pts):
    for j in range(n_pts):
        d = dist_matrix[i, j]
        if d <= epsilon:
            b = min(int(d / epsilon * N_BINS), N_BINS - 1)
            bin_data[b].append({"value": (j, n_pts - 1 - i), "label": f"t{j}–t{i}"})

# Plot
title = "recurrence-basic · python · pygal · anyplot.ai"

custom_style = Style(
    background=PAGE_BG,
    plot_background=PAGE_BG,
    foreground=INK,
    foreground_strong=INK,
    foreground_subtle=INK_MUTED,
    colors=SEQ_COLORS,
    title_font_size=66,
    label_font_size=56,
    major_label_font_size=44,
    legend_font_size=44,
    value_font_size=36,
    stroke_width=2.5,
    font_family="sans-serif",
)

chart = pygal.XY(
    width=2400,
    height=2400,
    style=custom_style,
    title=title,
    x_title="Time Index",
    y_title="Time Index",
    stroke=False,
    dots_size=4,
    show_legend=True,
    show_x_guides=True,
    show_y_guides=True,
)

for b in range(N_BINS):
    chart.add(f"Distance bin {b + 1}", bin_data[b])

# Save
chart.render_to_png(f"plot-{THEME}.png")

with open(f"plot-{THEME}.html", "wb") as f:
    f.write(chart.render())
Runnable source as JSON, for any HTTP client: https://api.anyplot.ai/specs/recurrence-basic/pygal/code. Any spec id and library id listed in llms-full.txt fit the same URL shape; every URL below is complete and callable.
{
  "spec_id": "recurrence-basic",
  "language": "python",
  "library": "pygal",
  "page": "https://anyplot.ai/recurrence-basic/python/pygal",
  "hub": "https://anyplot.ai/recurrence-basic",
  "code_json": "https://api.anyplot.ai/specs/recurrence-basic/pygal/code",
  "spec_json": "https://api.anyplot.ai/specs/recurrence-basic",
  "render_light_png": "https://storage.googleapis.com/anyplot-images/plots/recurrence-basic/python/pygal/plot-light.png",
  "render_dark_png": "https://storage.googleapis.com/anyplot-images/plots/recurrence-basic/python/pygal/plot-dark.png",
  "interactive_light_html": "https://storage.googleapis.com/anyplot-images/plots/recurrence-basic/python/pygal/plot-light.html",
  "interactive_dark_html": "https://storage.googleapis.com/anyplot-images/plots/recurrence-basic/python/pygal/plot-dark.html",
  "quality_score": 86.0,
  "license": "MIT",
  "guide": "https://anyplot.ai/llms.txt"
}
Part of Recurrence Plot for Nonlinear Time Series on anyplot.ai.