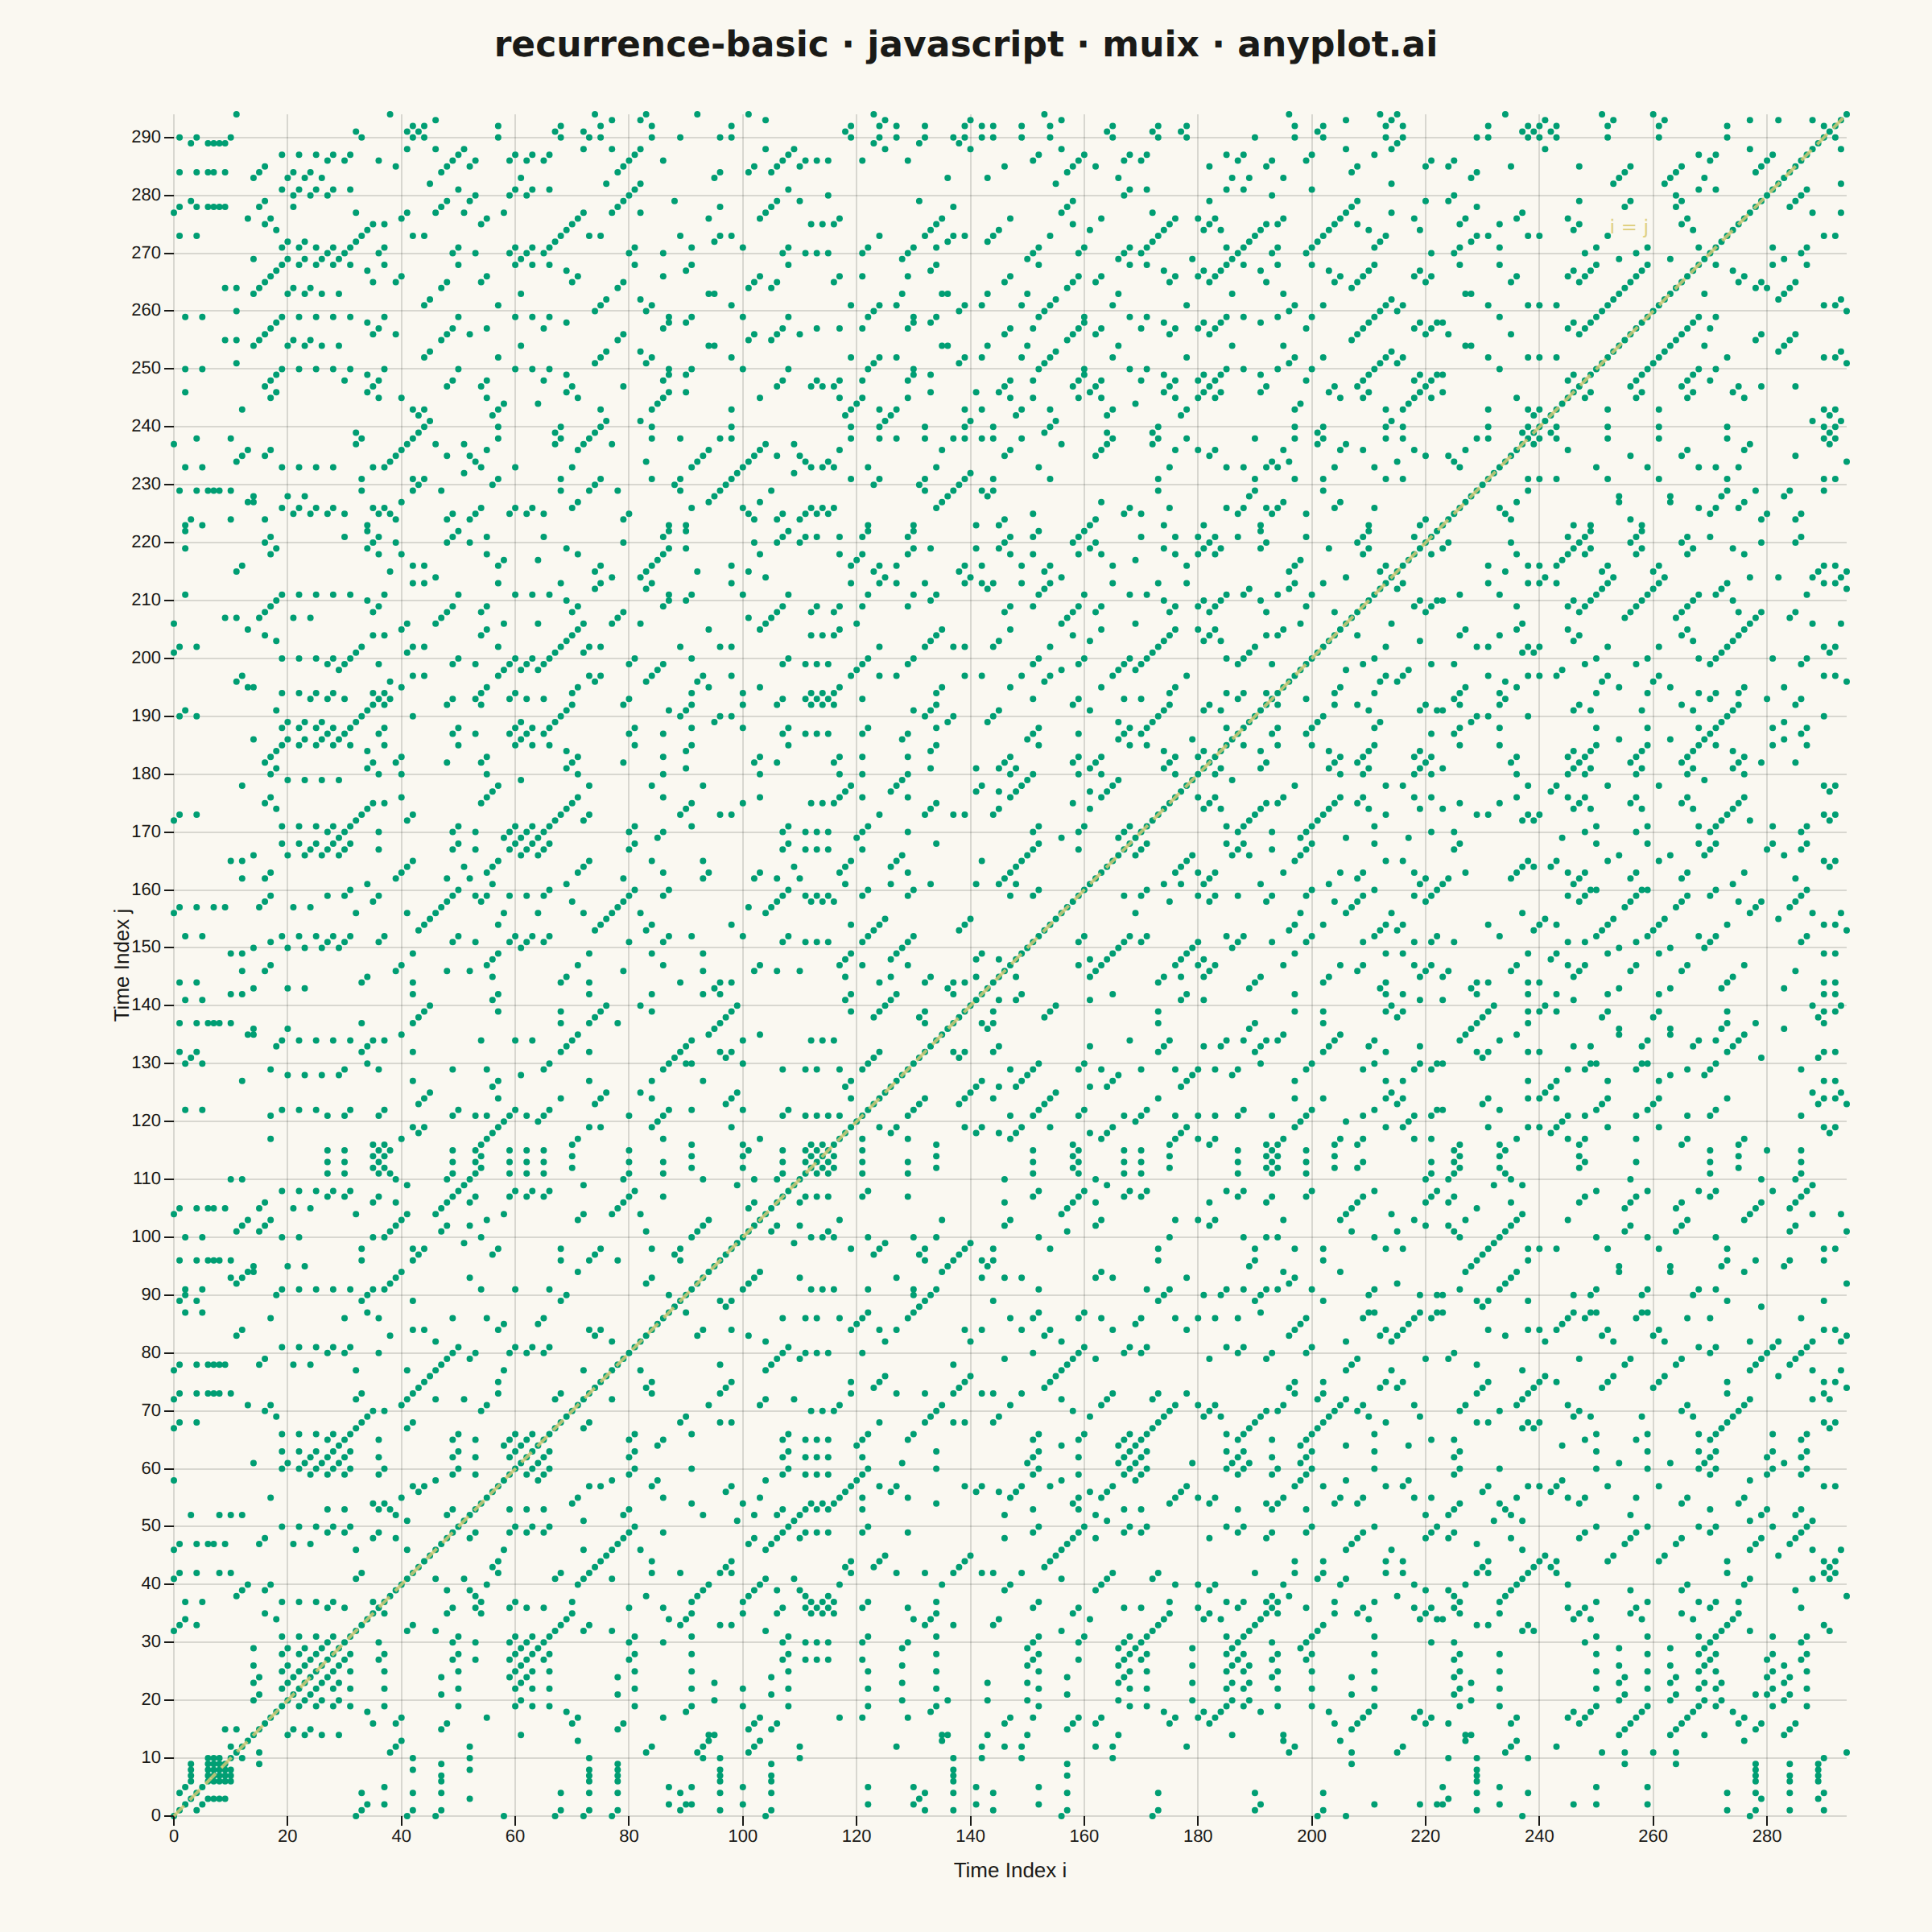
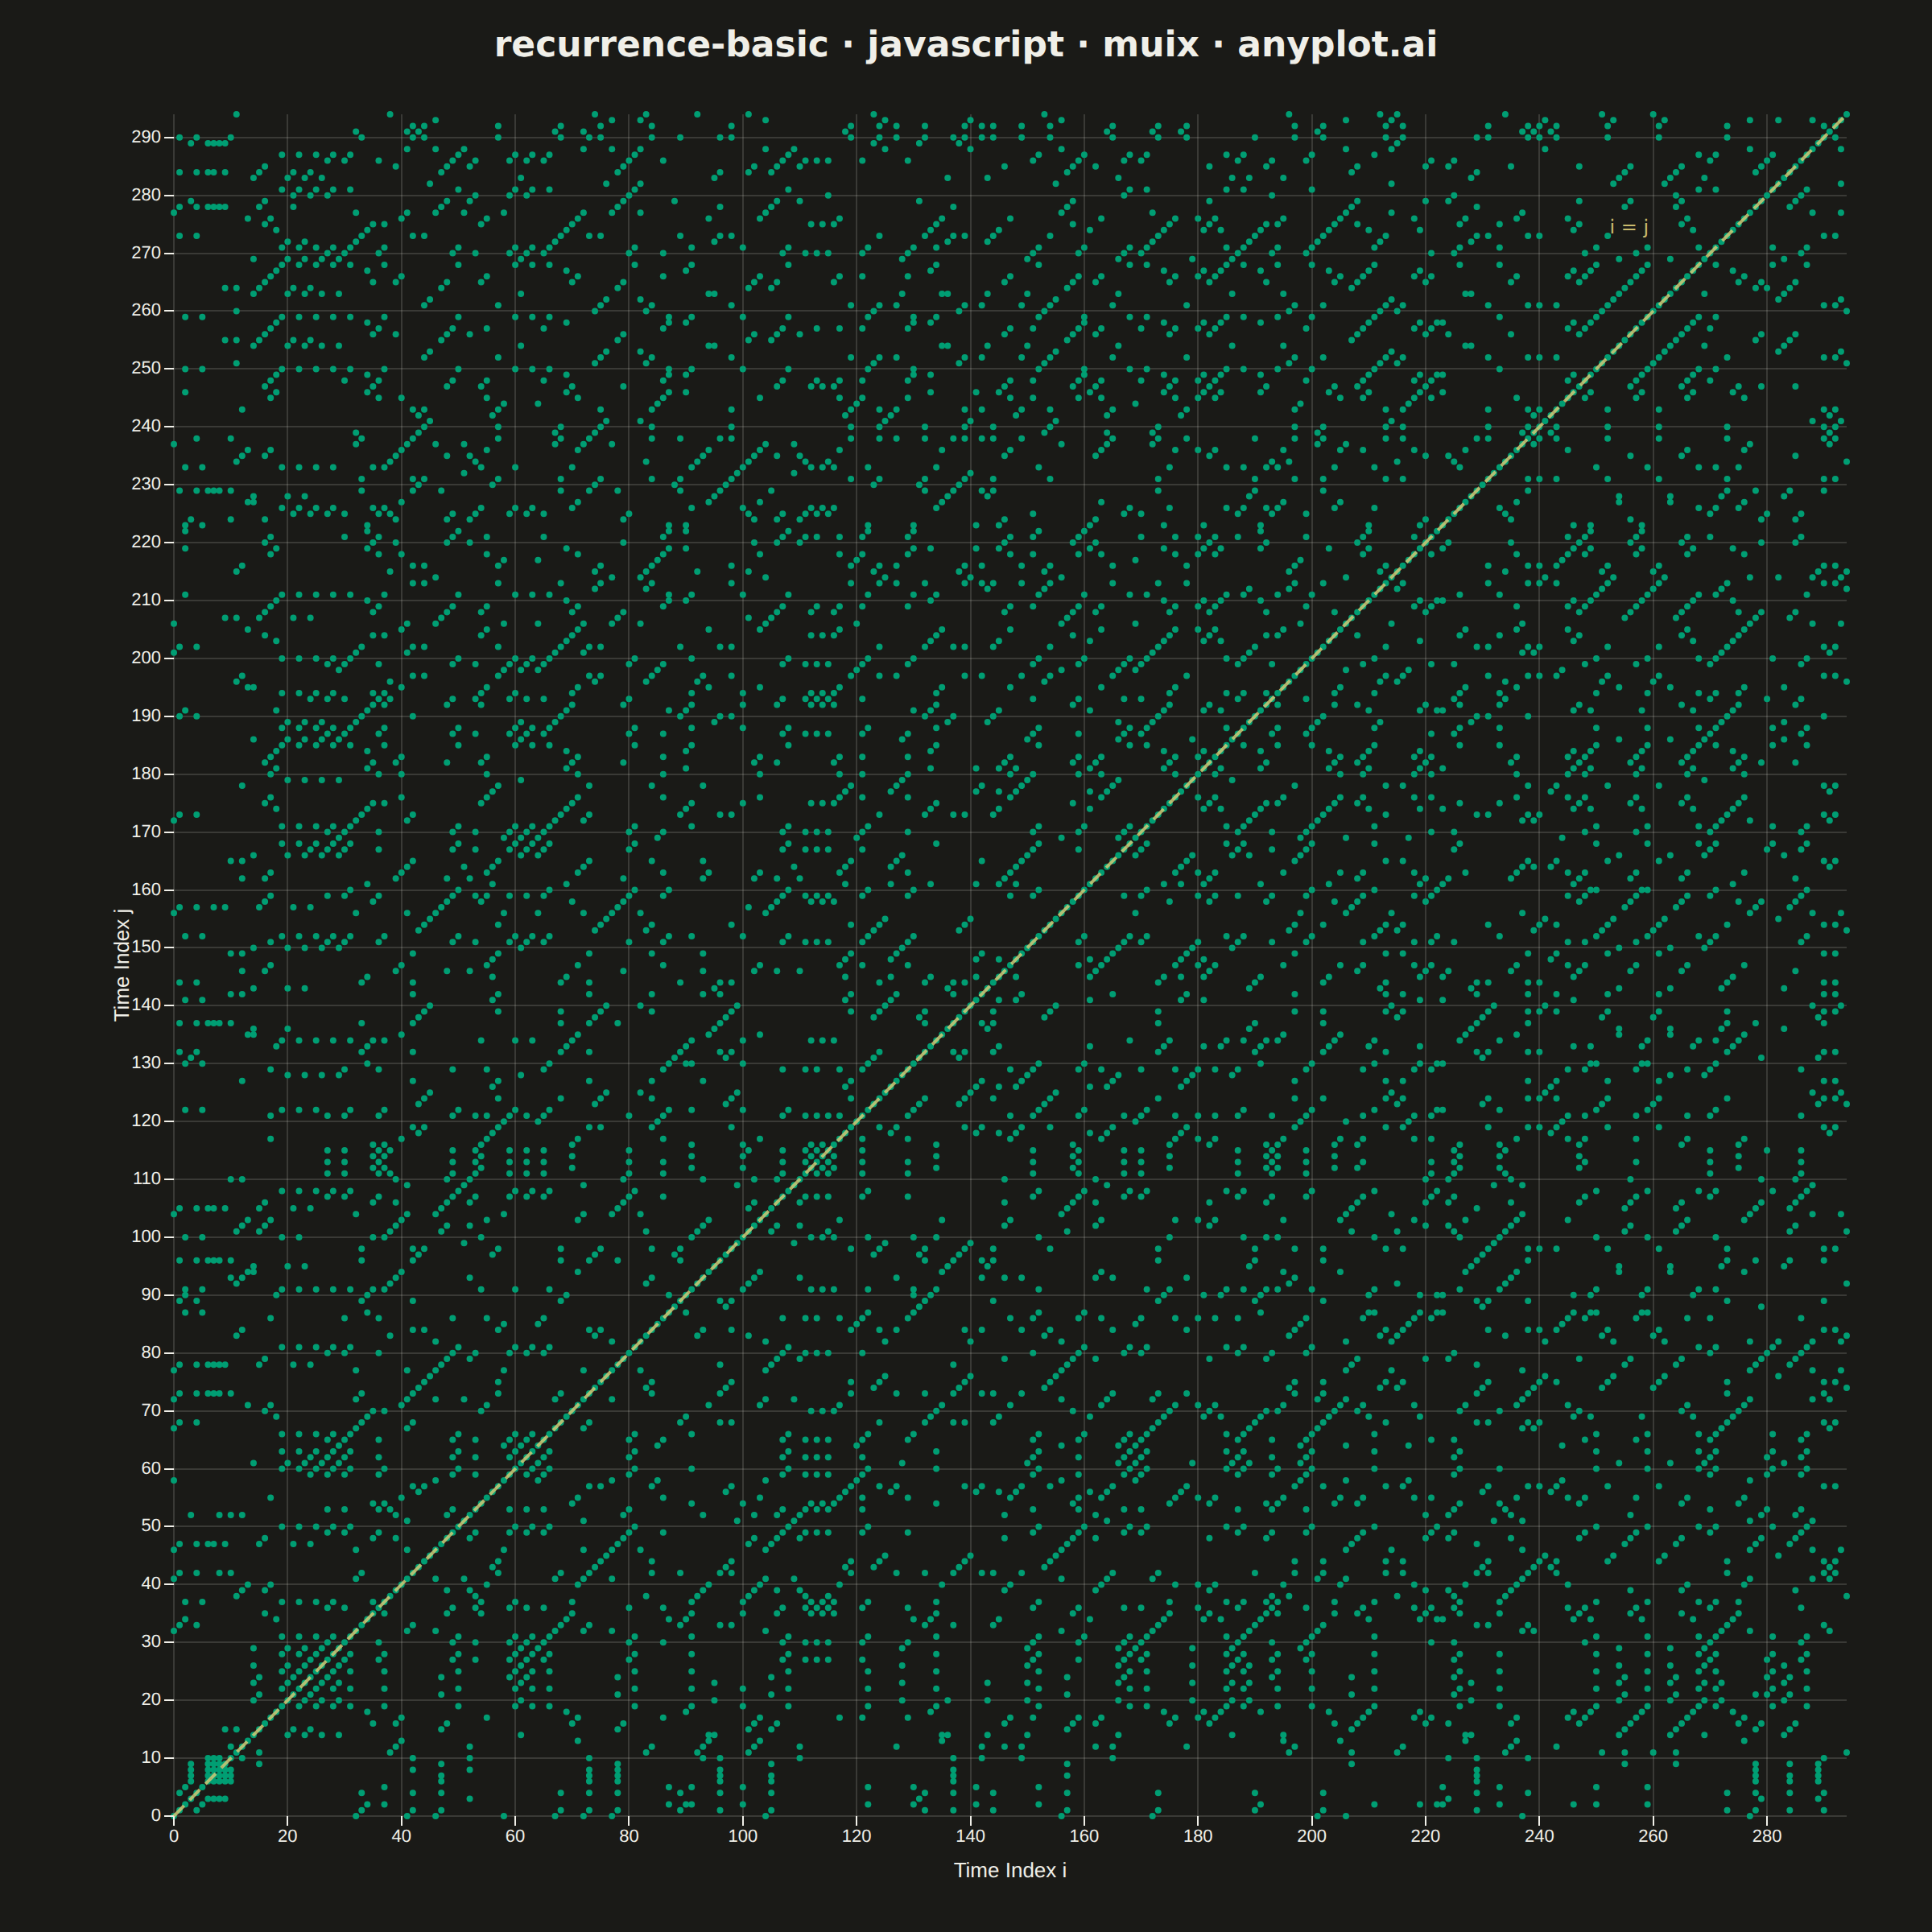
The same plot in 14 other libraries — JavaScript: Chart.js, D3.js, Apache ECharts, Highcharts; Python: Altair, Bokeh, lets-plot, Matplotlib, Plotly, plotnine, Pygal, Seaborn; R: ggplot2; Julia: Makie.jl. Compare all 15 side by side: Recurrence Plot for Nonlinear Time Series in Python, R, Julia and JavaScript.
A recurrence plot is a binary or distance-based matrix visualization that reveals when states in a dynamical system recur over time. Both axes represent time indices, and a point is plotted at position (i, j) when the system state at time i is sufficiently similar to the state at time j (distance below a threshold). The resulting symmetric matrix exposes hidden structure in complex, nonlinear dynamics — diagonal lines indicate determinism, vertical/horizontal lines reveal laminar states, and block structures signal regime changes.
// anyplot.ai
// recurrence-basic: Recurrence Plot for Nonlinear Time Series
// Library: muix 9.16.0 | JavaScript 22.23.3
// Quality: 84/100 | Updated: 2026-10-23
//# anyplot-orientation: square

import { ChartsContainer } from "@mui/x-charts/ChartsContainer";
import { ScatterPlot } from "@mui/x-charts/ScatterChart";
import { ChartsXAxis } from "@mui/x-charts/ChartsXAxis";
import { ChartsYAxis } from "@mui/x-charts/ChartsYAxis";
import { ChartsGrid } from "@mui/x-charts/ChartsGrid";

const t = window.ANYPLOT_TOKENS;

// Constants
const THRESHOLD = 0.15;
const DELAY_TAU = 5;

// Columns: set these to your data's column names
const TIME = "Time Index"; // role: time
const VALUE = "Signal Value"; // role: value

// Data: replace this block with your own records, one object per row
const data = (() => {
  const n = 300;
  const r = 3.95;
  const ts: number[] = [0.4];
  for (let i = 1; i < n; i++) {
    ts.push(r * ts[i - 1] * (1 - ts[i - 1]));
  }
  return ts.map((v, i) => ({ [TIME]: i, [VALUE]: v }));
})();

// Plot: reads only data and the constants above
const M = data.length - DELAY_TAU;
const states = Array.from({ length: M }, (_, i) => [
  data[i][VALUE],
  data[i + DELAY_TAU][VALUE],
]);

const recPts: { x: number; y: number; id: number }[] = [];
let ptId = 0;
for (let i = 0; i < M; i++) {
  for (let j = 0; j < M; j++) {
    const dx = states[i][0] - states[j][0];
    const dy = states[i][1] - states[j][1];
    if (dx * dx + dy * dy < THRESHOLD * THRESHOLD) {
      recPts.push({ x: data[i][TIME], y: data[j][TIME], id: ptId++ });
    }
  }
}

const minTime = data[0][TIME];
const maxTime = data[M - 1][TIME];
const TITLE_H = 56;

export default function Chart() {
  const W = window.ANYPLOT_SIZE.width;
  const H = window.ANYPLOT_SIZE.height;
  const side = H - TITLE_H;

  return (
    <div
      style={{
        width: W,
        height: H,
        background: t.pageBg,
        fontFamily: "Inter, system-ui, sans-serif",
        display: "flex",
        flexDirection: "column",
        alignItems: "center",
      }}
    >
      <div
        style={{
          height: TITLE_H,
          display: "flex",
          alignItems: "center",
          justifyContent: "center",
        }}
      >
        <span style={{ fontSize: 22, fontWeight: 600, color: t.ink }}>
          recurrence-basic · javascript · muix · anyplot.ai
        </span>
      </div>
      <ChartsContainer
        width={side}
        height={side}
        skipAnimation
        colors={[t.palette[0]]}
        margin={{ top: 24, bottom: 24, left: 20, right: 28 }}
        series={[
          {
            type: "scatter",
            data: recPts,
            markerSize: 2,
            label: "Recurrent",
          },
        ]}
        xAxis={[
          {
            min: minTime,
            max: maxTime,
            height: 72,
            label: `${TIME} i`,
            tickLabelStyle: { fontSize: 15, fill: t.inkSoft },
            labelStyle: { fontSize: 15, fill: t.ink },
          },
        ]}
        yAxis={[
          {
            min: minTime,
            max: maxTime,
            width: 72,
            label: `${TIME} j`,
            tickLabelStyle: { fontSize: 15, fill: t.inkSoft },
            labelStyle: { fontSize: 15, fill: t.ink },
          },
        ]}
        sx={{
          "& .MuiChartsAxis-line": { stroke: t.inkSoft },
          "& .MuiChartsAxis-tick": { stroke: t.inkSoft },
          "& .MuiChartsGrid-line": { stroke: t.grid, strokeWidth: 1 },
        }}
      >
        <ChartsGrid vertical horizontal />
        <ScatterPlot />
        <ChartsXAxis />
        <ChartsYAxis />
      </ChartsContainer>
    </div>
  );
}
Runnable source as JSON, for any HTTP client: https://api.anyplot.ai/specs/recurrence-basic/muix/code. Any spec id and library id listed in llms-full.txt fit the same URL shape; every URL below is complete and callable.
{
  "spec_id": "recurrence-basic",
  "language": "javascript",
  "library": "muix",
  "page": "https://anyplot.ai/recurrence-basic/javascript/muix",
  "hub": "https://anyplot.ai/recurrence-basic",
  "code_json": "https://api.anyplot.ai/specs/recurrence-basic/muix/code",
  "spec_json": "https://api.anyplot.ai/specs/recurrence-basic",
  "render_light_png": "https://storage.googleapis.com/anyplot-images/plots/recurrence-basic/javascript/muix/plot-light.png",
  "render_dark_png": "https://storage.googleapis.com/anyplot-images/plots/recurrence-basic/javascript/muix/plot-dark.png",
  "interactive_light_html": "https://storage.googleapis.com/anyplot-images/plots/recurrence-basic/javascript/muix/plot-light.html",
  "interactive_dark_html": "https://storage.googleapis.com/anyplot-images/plots/recurrence-basic/javascript/muix/plot-dark.html",
  "quality_score": 84.0,
  "license": "MIT",
  "guide": "https://anyplot.ai/llms.txt"
}
Part of Recurrence Plot for Nonlinear Time Series on anyplot.ai.