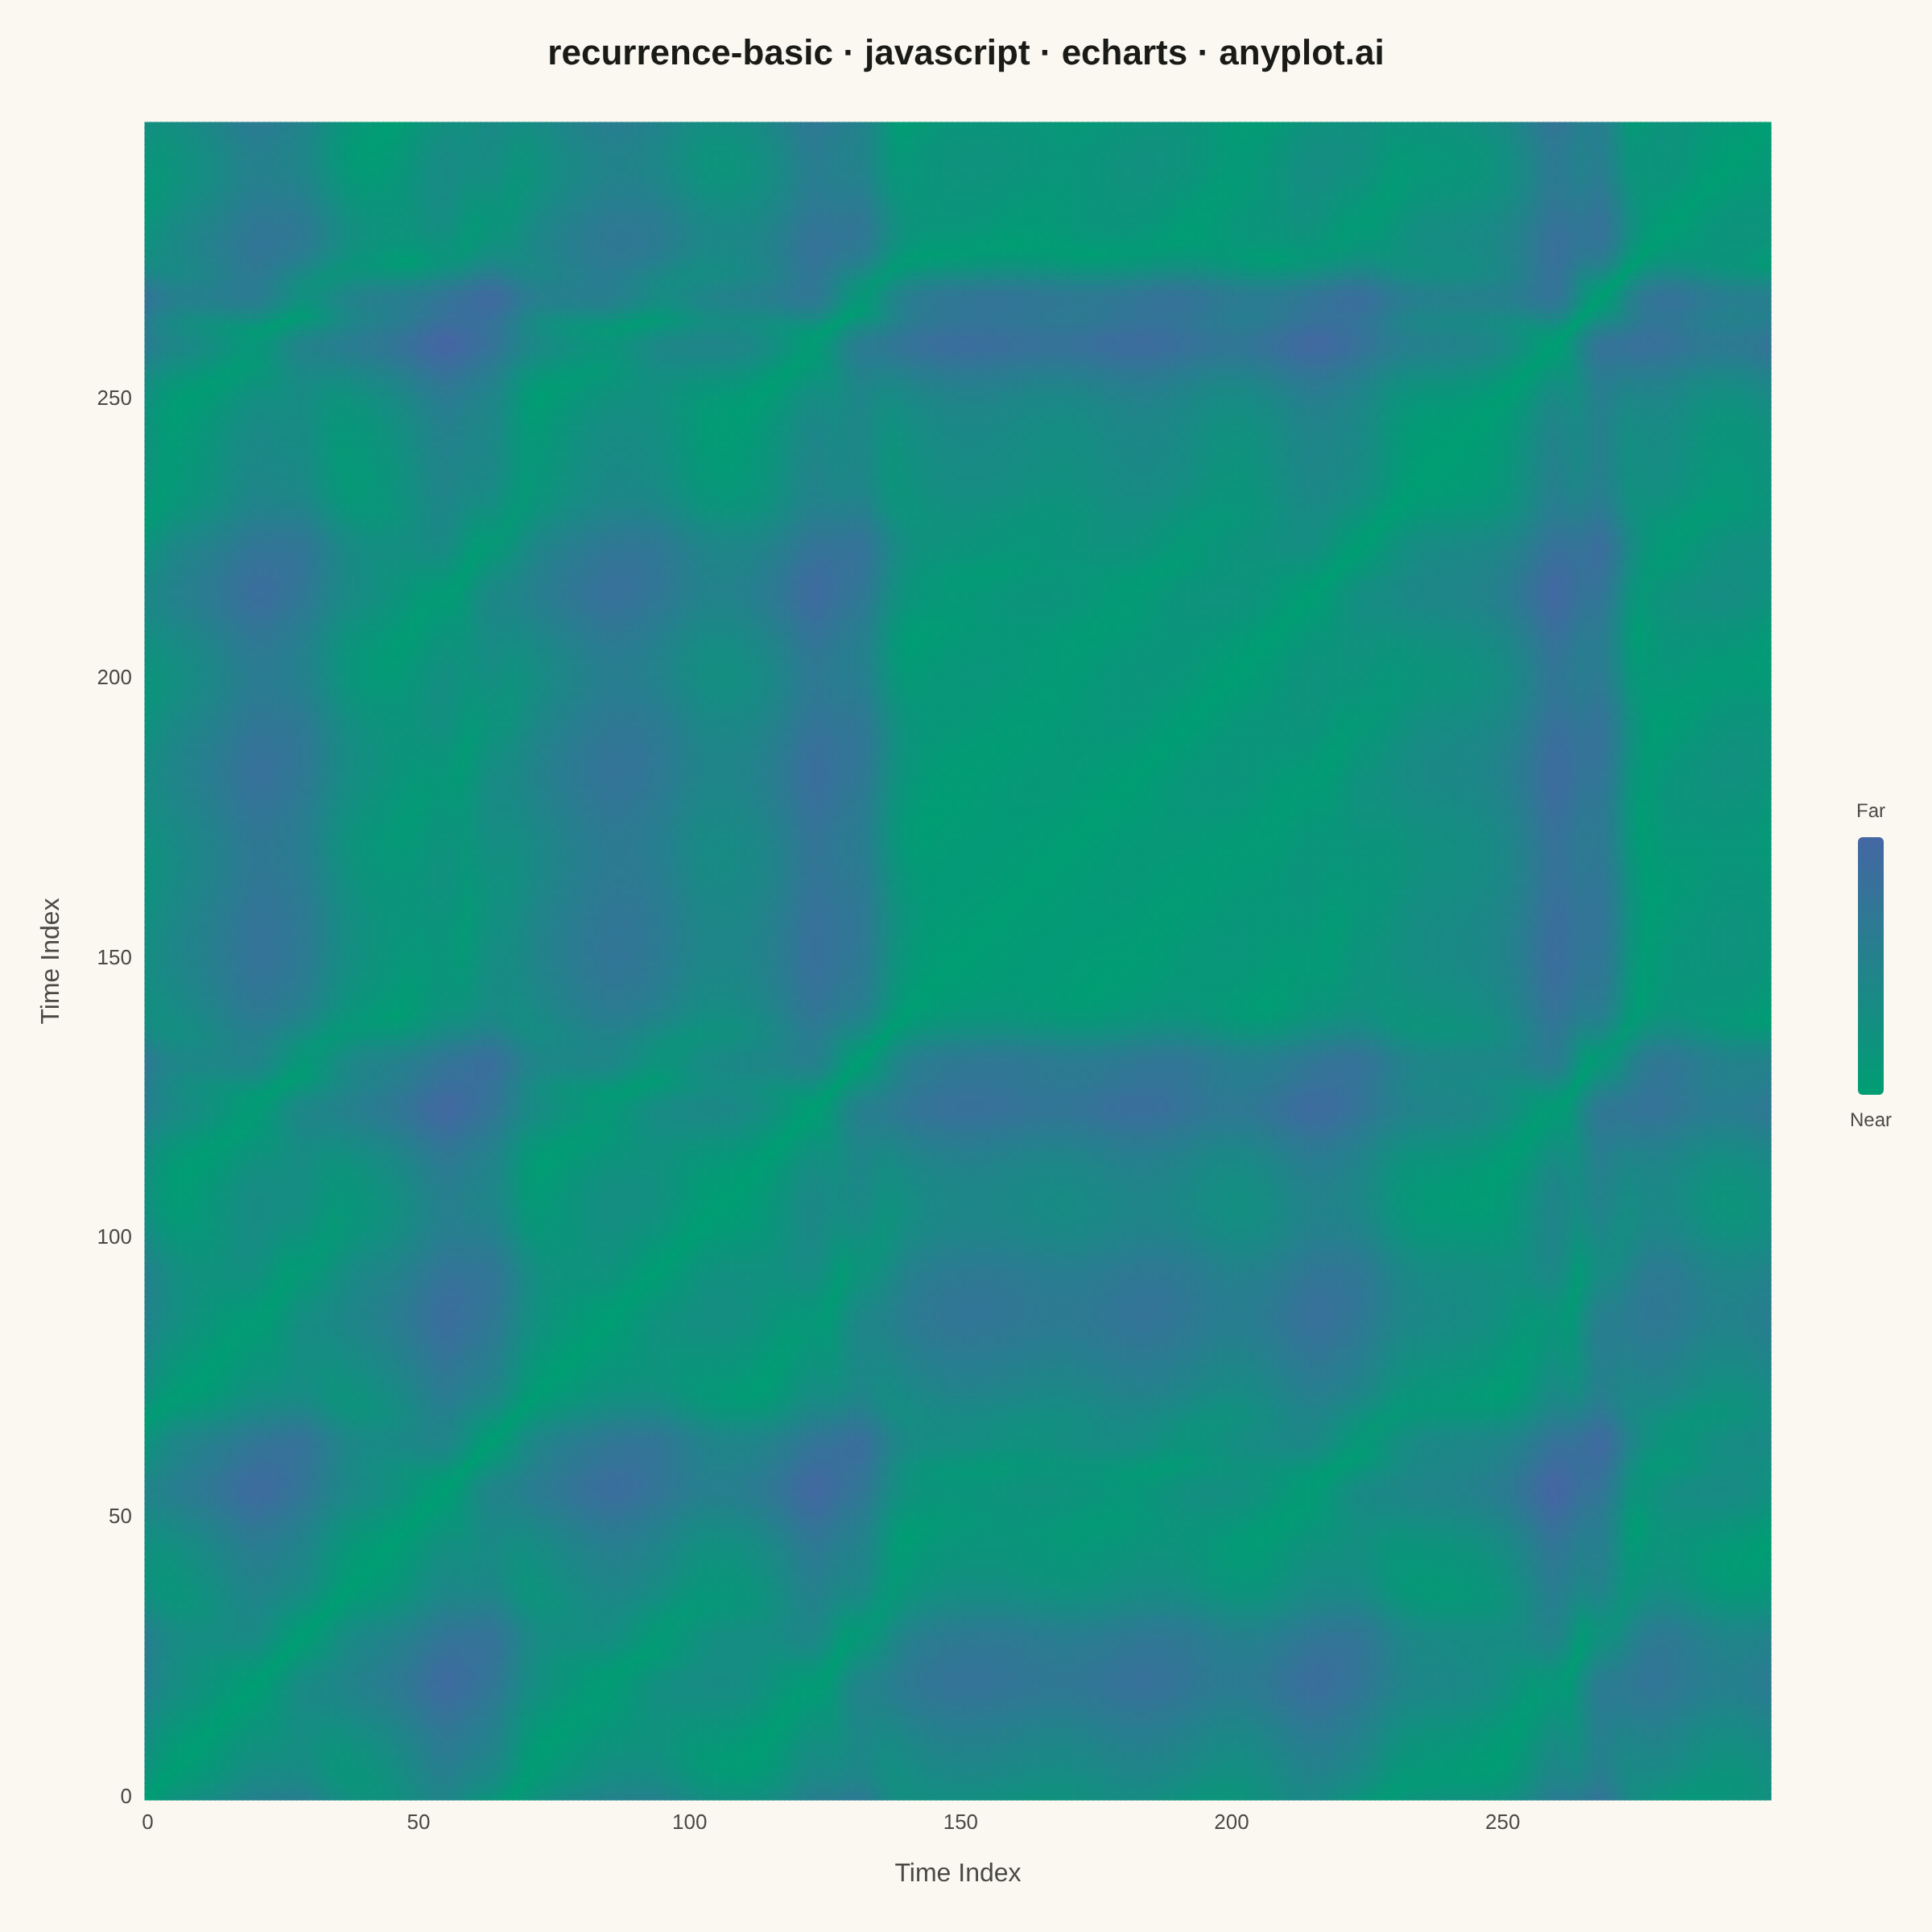
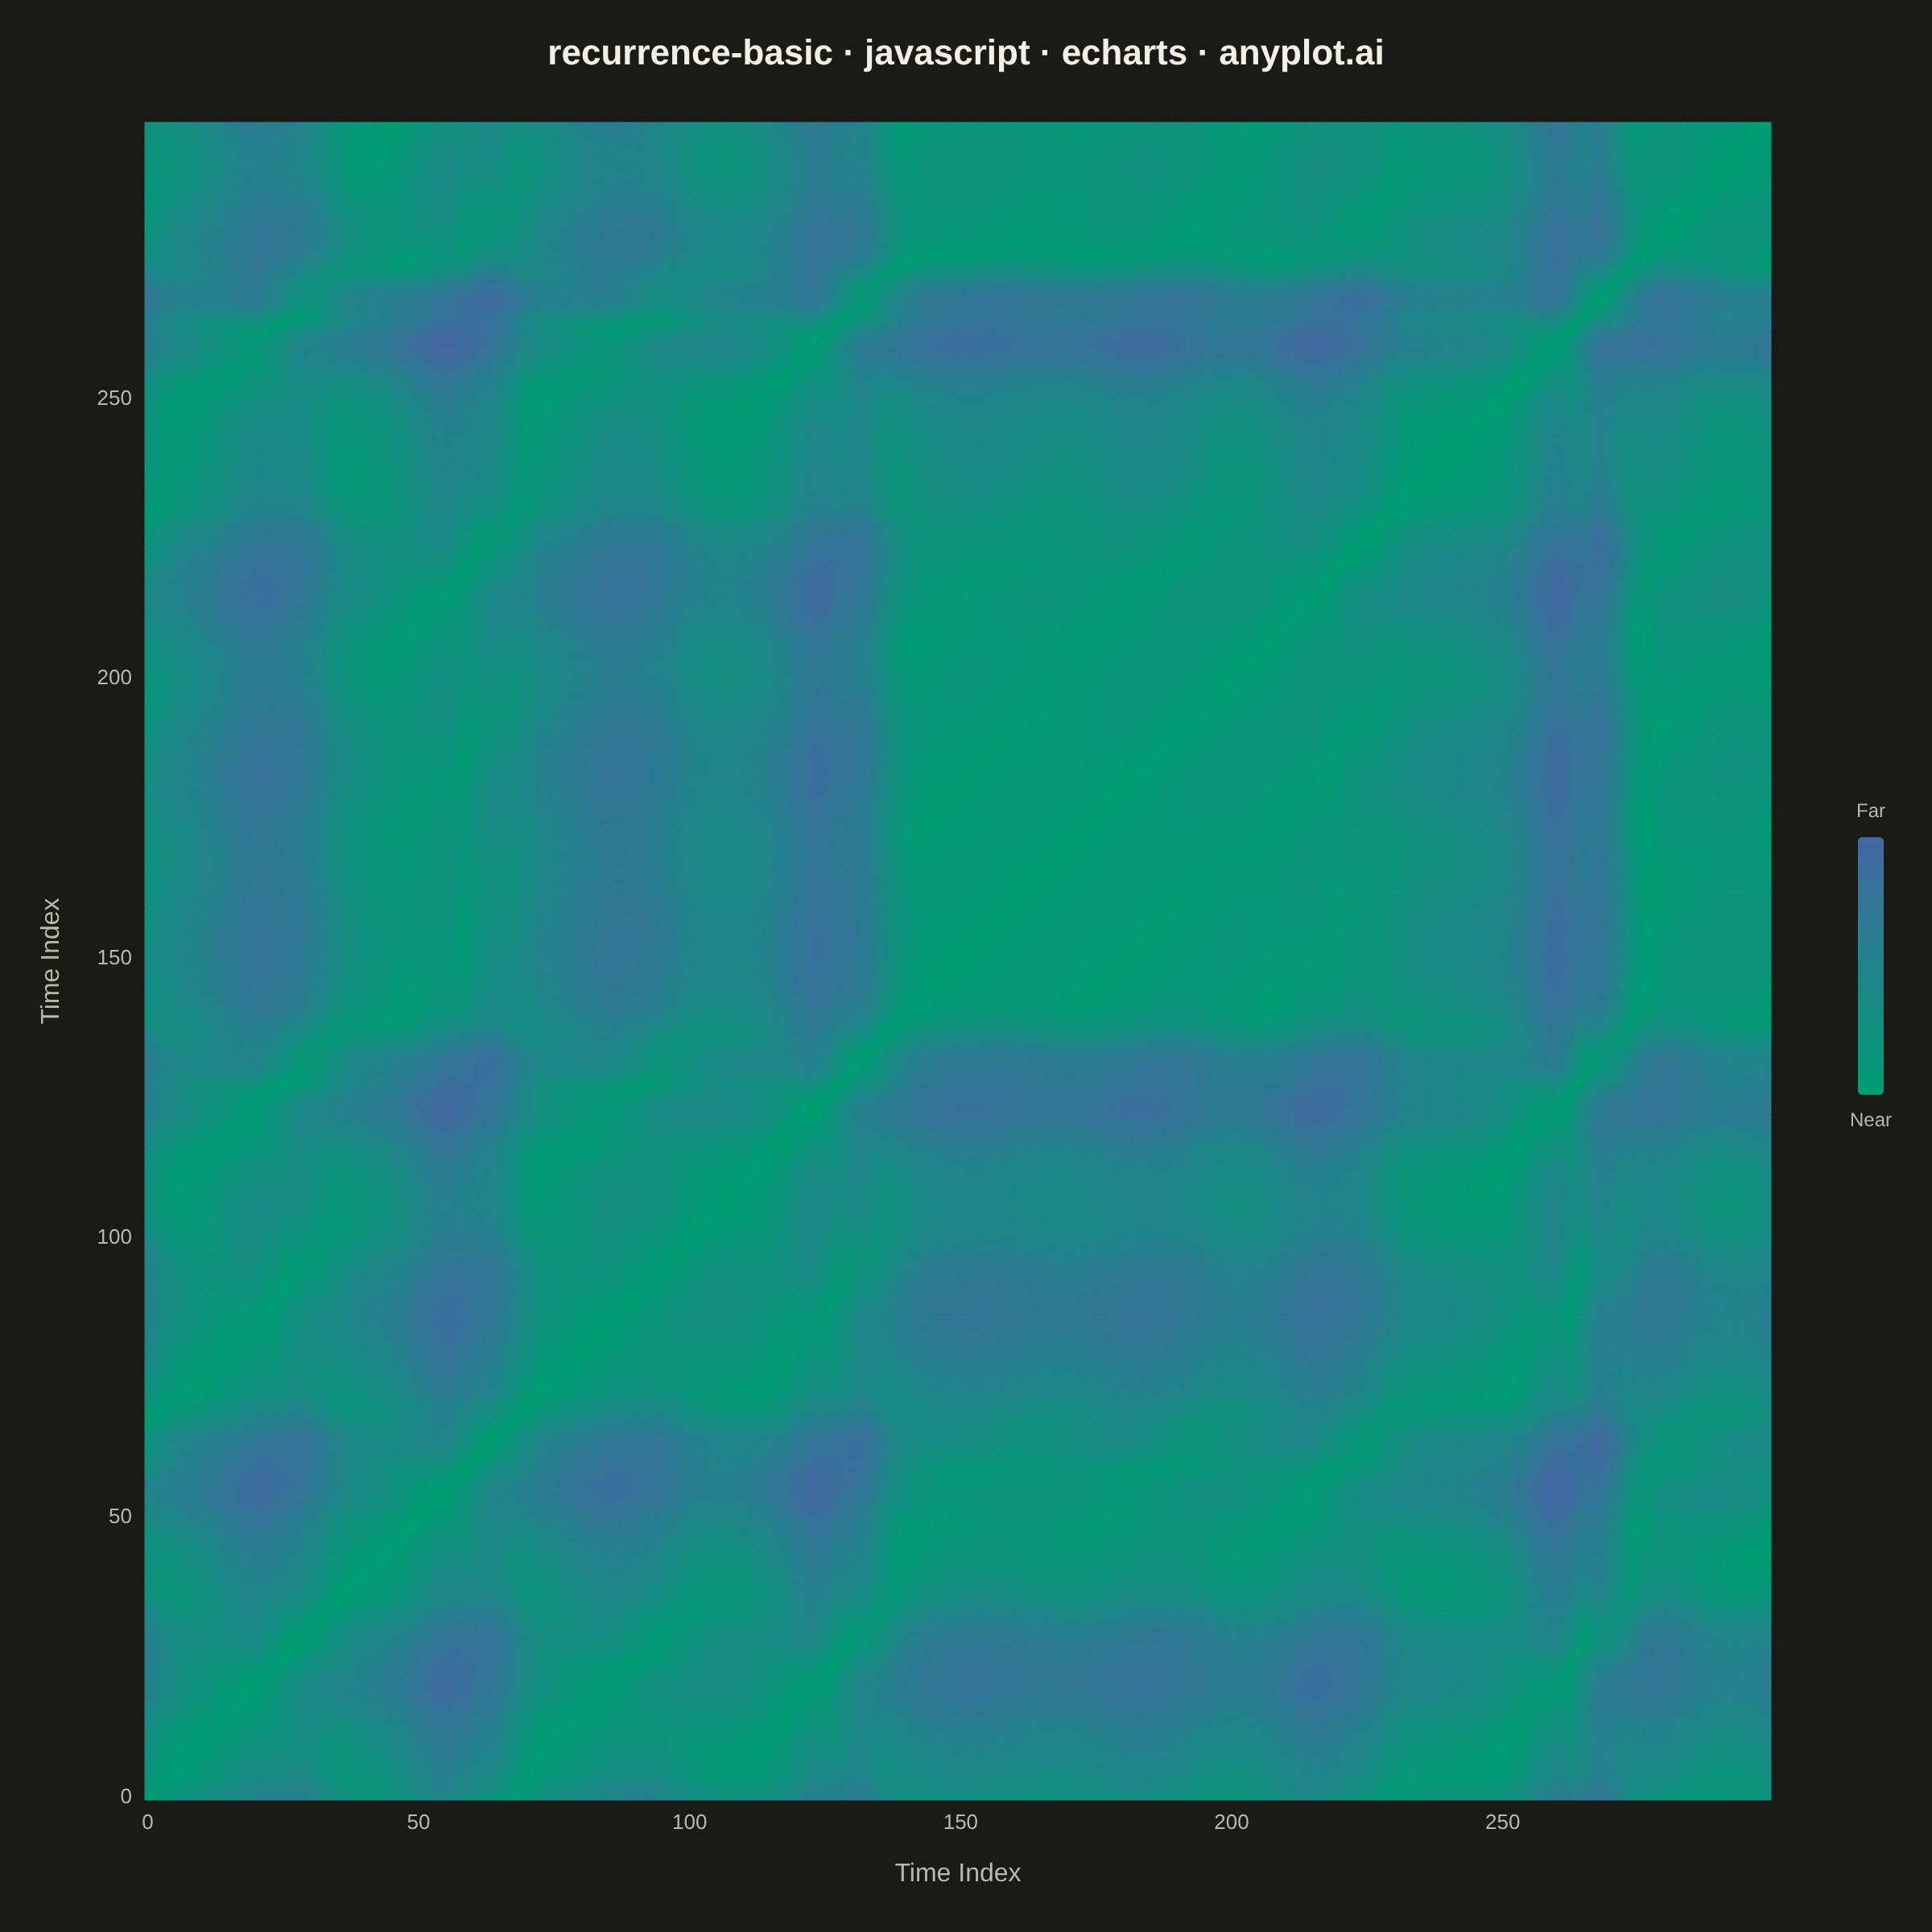
The same plot in 14 other libraries — JavaScript: Chart.js, D3.js, Highcharts, MUI X Charts; Python: Altair, Bokeh, lets-plot, Matplotlib, Plotly, plotnine, Pygal, Seaborn; R: ggplot2; Julia: Makie.jl. Compare all 15 side by side: Recurrence Plot for Nonlinear Time Series in Python, R, Julia and JavaScript.
A recurrence plot is a binary or distance-based matrix visualization that reveals when states in a dynamical system recur over time. Both axes represent time indices, and a point is plotted at position (i, j) when the system state at time i is sufficiently similar to the state at time j (distance below a threshold). The resulting symmetric matrix exposes hidden structure in complex, nonlinear dynamics — diagonal lines indicate determinism, vertical/horizontal lines reveal laminar states, and block structures signal regime changes.
// anyplot.ai
// recurrence-basic: Recurrence Plot for Nonlinear Time Series
// Library: echarts 5.5.1 | JavaScript 22.22.3
// Quality: 88/100 | Created: 2026-06-10
//# anyplot-orientation: square

const t = window.ANYPLOT_TOKENS;

// Lorenz attractor (σ=10, ρ=28, β=8/3): deterministic chaotic time series
const dt = 0.02;
let lx = 1.0, ly = 0.0, lz = 0.0;

// Burn-in: drive initial conditions onto the strange attractor
for (let k = 0; k < 300; k++) {
  const dxk = 10 * (ly - lx);
  const dyk = lx * (28 - lz) - ly;
  const dzk = lx * ly - (8 / 3) * lz;
  lx += dxk * dt;
  ly += dyk * dt;
  lz += dzk * dt;
}

// Time-delay embedding of x-component: state(i) = (x[i], x[i+DELAY])
// Implements Takens' theorem reconstruction from a scalar observable
const DELAY = 8;
const NPTS = 300;
const N_TOTAL = NPTS + DELAY;

const lorenzX = [];
for (let k = 0; k < N_TOTAL; k++) {
  const dxk = 10 * (ly - lx);
  const dyk = lx * (28 - lz) - ly;
  const dzk = lx * ly - (8 / 3) * lz;
  lx += dxk * dt;
  ly += dyk * dt;
  lz += dzk * dt;
  lorenzX.push(lx);
}

const emX = lorenzX.slice(0, NPTS);
const emY = lorenzX.slice(DELAY, NPTS + DELAY);

// Pairwise Euclidean distances in 2D embedded state space, normalized to [0, 1]
// Main diagonal stays 0 (every state recurs with itself — Takens determinism)
let maxDist = 0;
const rawDist = new Float32Array(NPTS * NPTS);
for (let i = 0; i < NPTS; i++) {
  for (let j = i + 1; j < NPTS; j++) {
    const dx = emX[i] - emX[j];
    const dy = emY[i] - emY[j];
    const val = Math.sqrt(dx * dx + dy * dy);
    rawDist[i * NPTS + j] = val;
    rawDist[j * NPTS + i] = val;
    if (val > maxDist) maxDist = val;
  }
}

// Full recurrence distance matrix: [col, row, normalizedDist] for all N×N pairs
// imprint_seq encoding: green (0=identical/recurrent) → blue (1=maximally distant)
const data = [];
for (let i = 0; i < NPTS; i++) {
  for (let j = 0; j < NPTS; j++) {
    data.push([j, i, rawDist[i * NPTS + j] / maxDist]);
  }
}

const timeLabels = Array.from({ length: NPTS }, (_, k) => k);

const chart = echarts.init(document.getElementById("container"));
chart.setOption({
  animation: false,
  backgroundColor: "transparent",
  title: {
    text: "recurrence-basic · javascript · echarts · anyplot.ai",
    left: "center",
    top: 18,
    textStyle: { color: t.ink, fontSize: 22 },
  },
  // imprint_seq: brand green (near/recurrent) → blue (far/non-recurrent)
  visualMap: {
    min: 0,
    max: 1,
    show: true,
    orient: "vertical",
    right: 20,
    top: "middle",
    itemWidth: 16,
    itemHeight: 160,
    text: ["Far", "Near"],
    textStyle: { color: t.inkSoft, fontSize: 12 },
    inRange: { color: t.seq },
  },
  grid: { left: 90, right: 100, top: 76, bottom: 82 },
  xAxis: {
    type: "category",
    data: timeLabels,
    name: "Time Index",
    nameLocation: "center",
    nameGap: 38,
    nameTextStyle: { color: t.inkSoft, fontSize: 16 },
    axisLabel: { color: t.inkSoft, fontSize: 13, interval: 49 },
    axisLine: { show: false },
    axisTick: { show: false },
    splitLine: { show: false },
  },
  yAxis: {
    type: "category",
    data: timeLabels,
    name: "Time Index",
    nameLocation: "center",
    nameGap: 50,
    nameTextStyle: { color: t.inkSoft, fontSize: 16 },
    axisLabel: { color: t.inkSoft, fontSize: 13, interval: 49 },
    axisLine: { show: false },
    axisTick: { show: false },
    splitLine: { show: false },
  },
  series: [
    {
      type: "heatmap",
      data: data,
      progressive: 0,
      emphasis: { disabled: true },
    },
  ],
});
Runnable source as JSON, for any HTTP client: https://api.anyplot.ai/specs/recurrence-basic/echarts/code. Any spec id and library id listed in llms-full.txt fit the same URL shape; every URL below is complete and callable.
{
  "spec_id": "recurrence-basic",
  "language": "javascript",
  "library": "echarts",
  "page": "https://anyplot.ai/recurrence-basic/javascript/echarts",
  "hub": "https://anyplot.ai/recurrence-basic",
  "code_json": "https://api.anyplot.ai/specs/recurrence-basic/echarts/code",
  "spec_json": "https://api.anyplot.ai/specs/recurrence-basic",
  "render_light_png": "https://storage.googleapis.com/anyplot-images/plots/recurrence-basic/javascript/echarts/plot-light.png",
  "render_dark_png": "https://storage.googleapis.com/anyplot-images/plots/recurrence-basic/javascript/echarts/plot-dark.png",
  "interactive_light_html": "https://storage.googleapis.com/anyplot-images/plots/recurrence-basic/javascript/echarts/plot-light.html",
  "interactive_dark_html": "https://storage.googleapis.com/anyplot-images/plots/recurrence-basic/javascript/echarts/plot-dark.html",
  "quality_score": 88.0,
  "license": "MIT",
  "guide": "https://anyplot.ai/llms.txt"
}
Part of Recurrence Plot for Nonlinear Time Series on anyplot.ai.