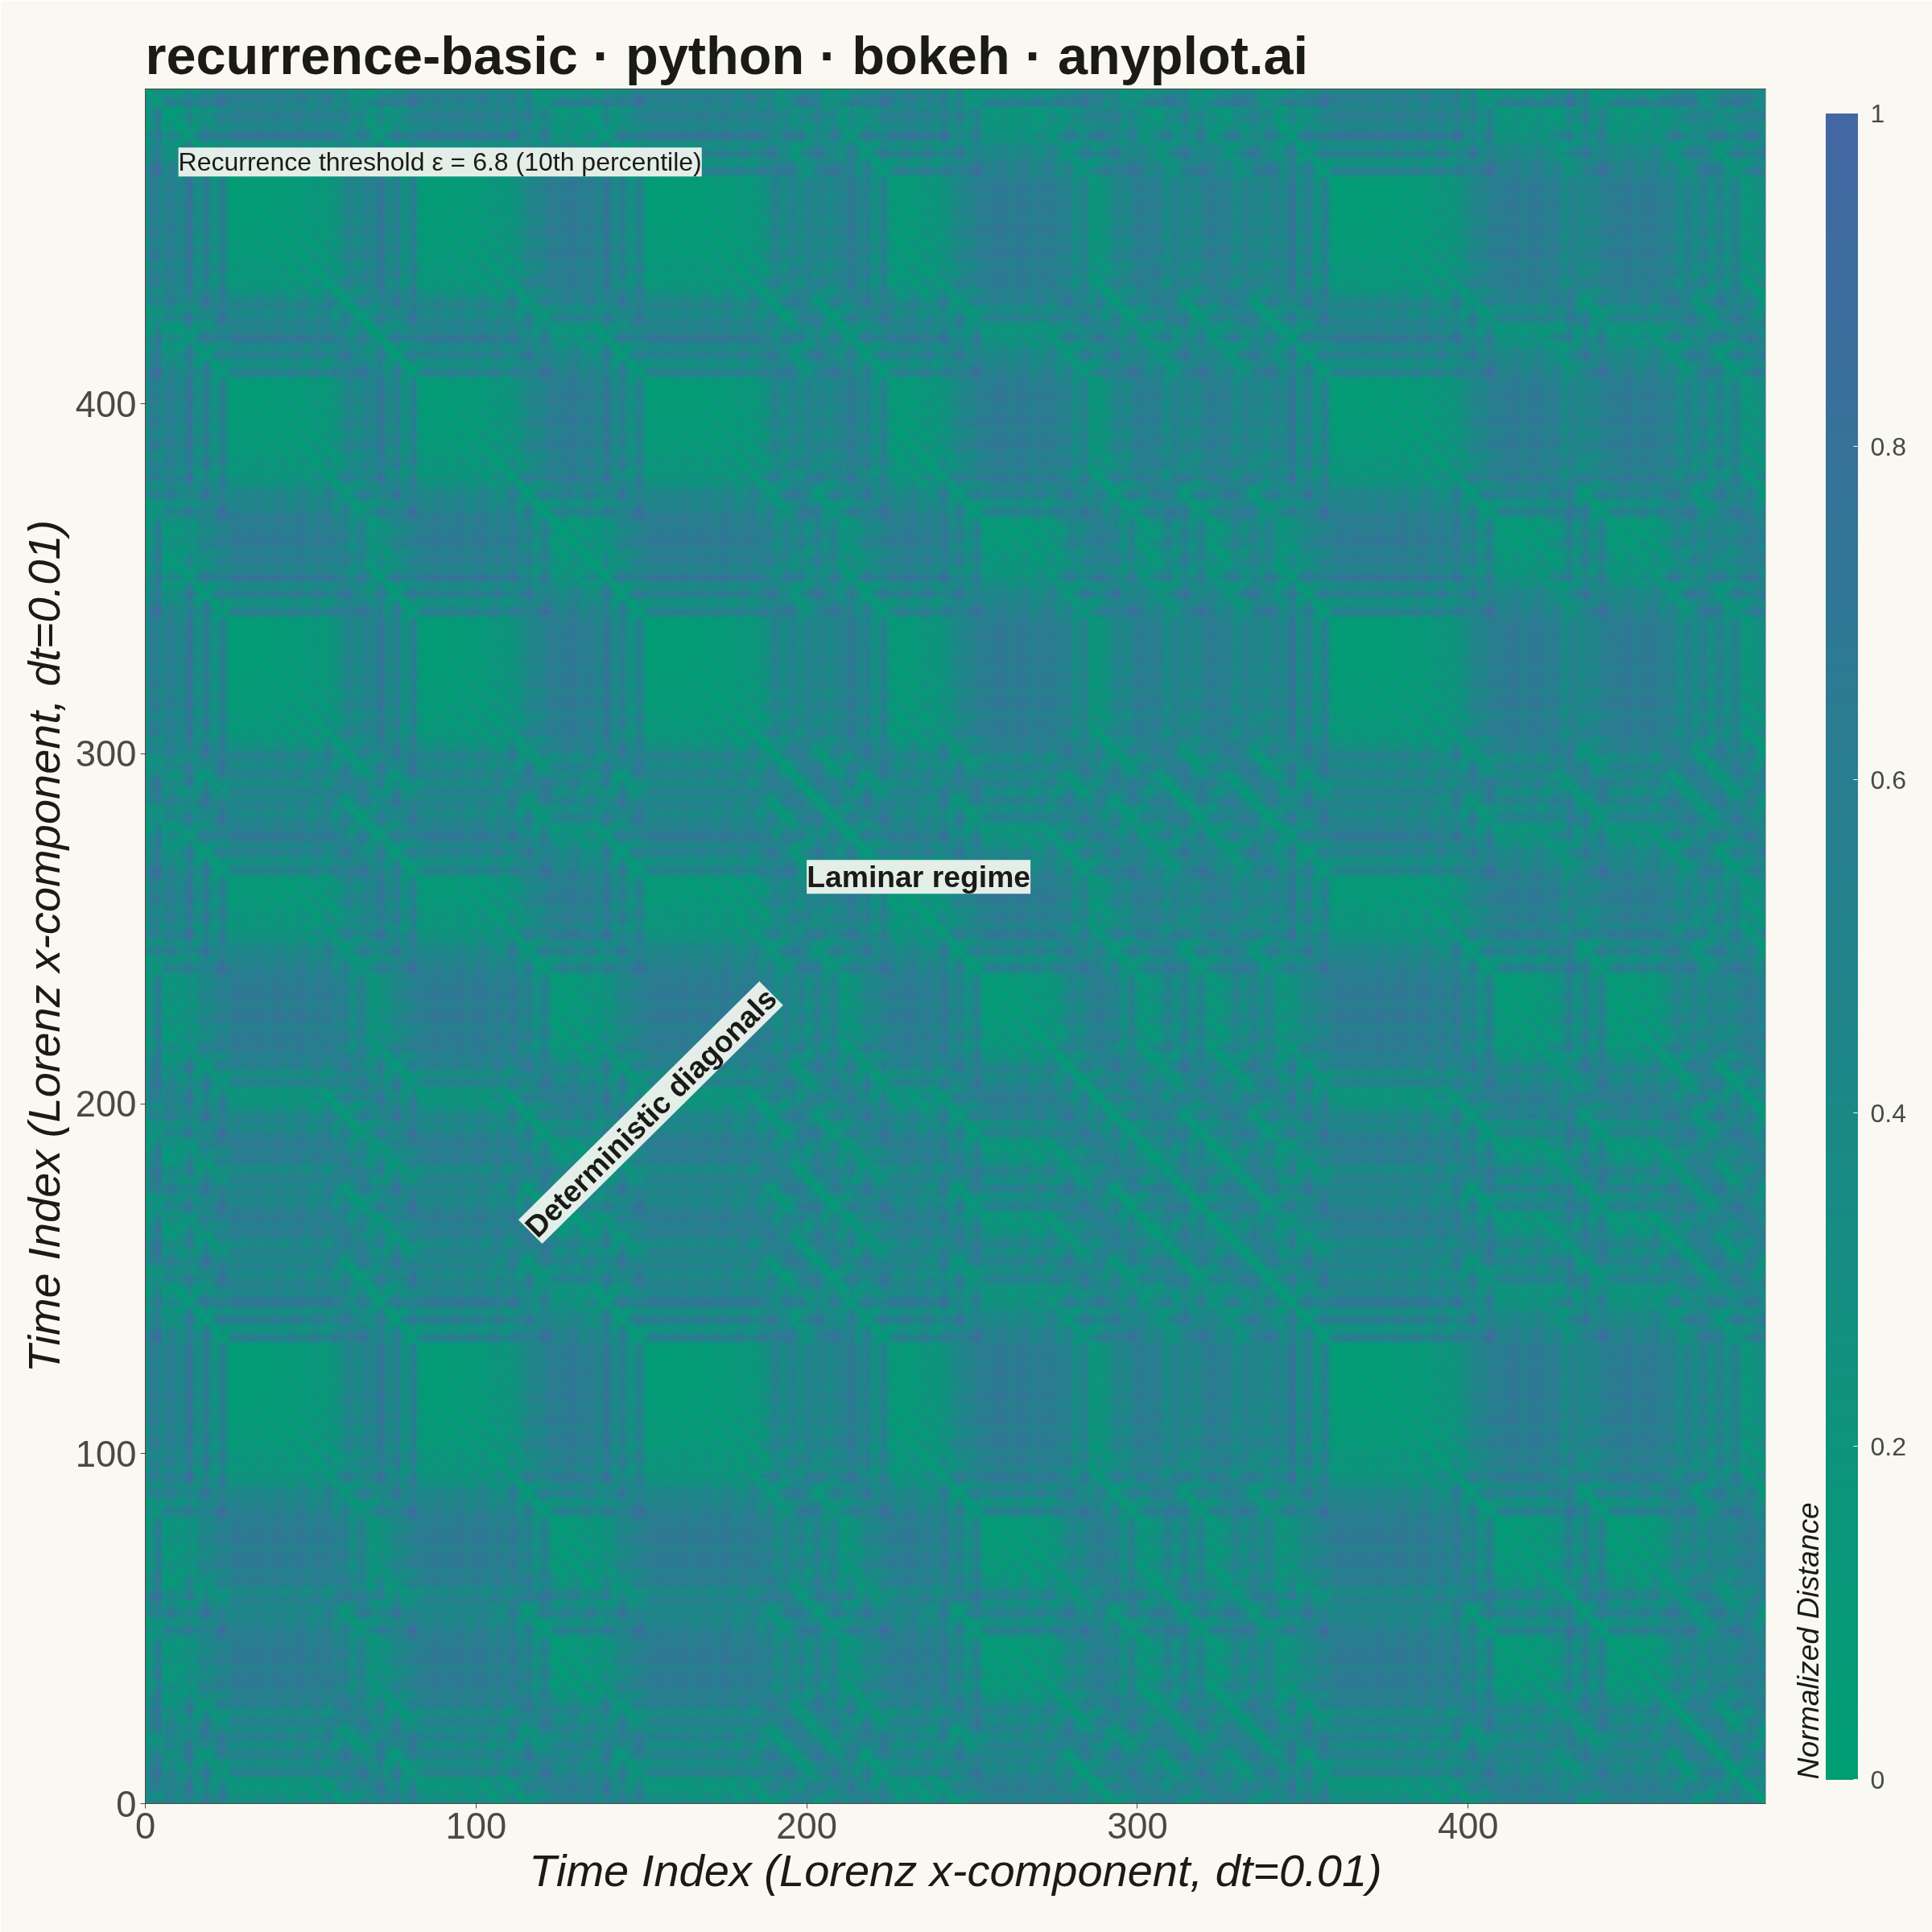
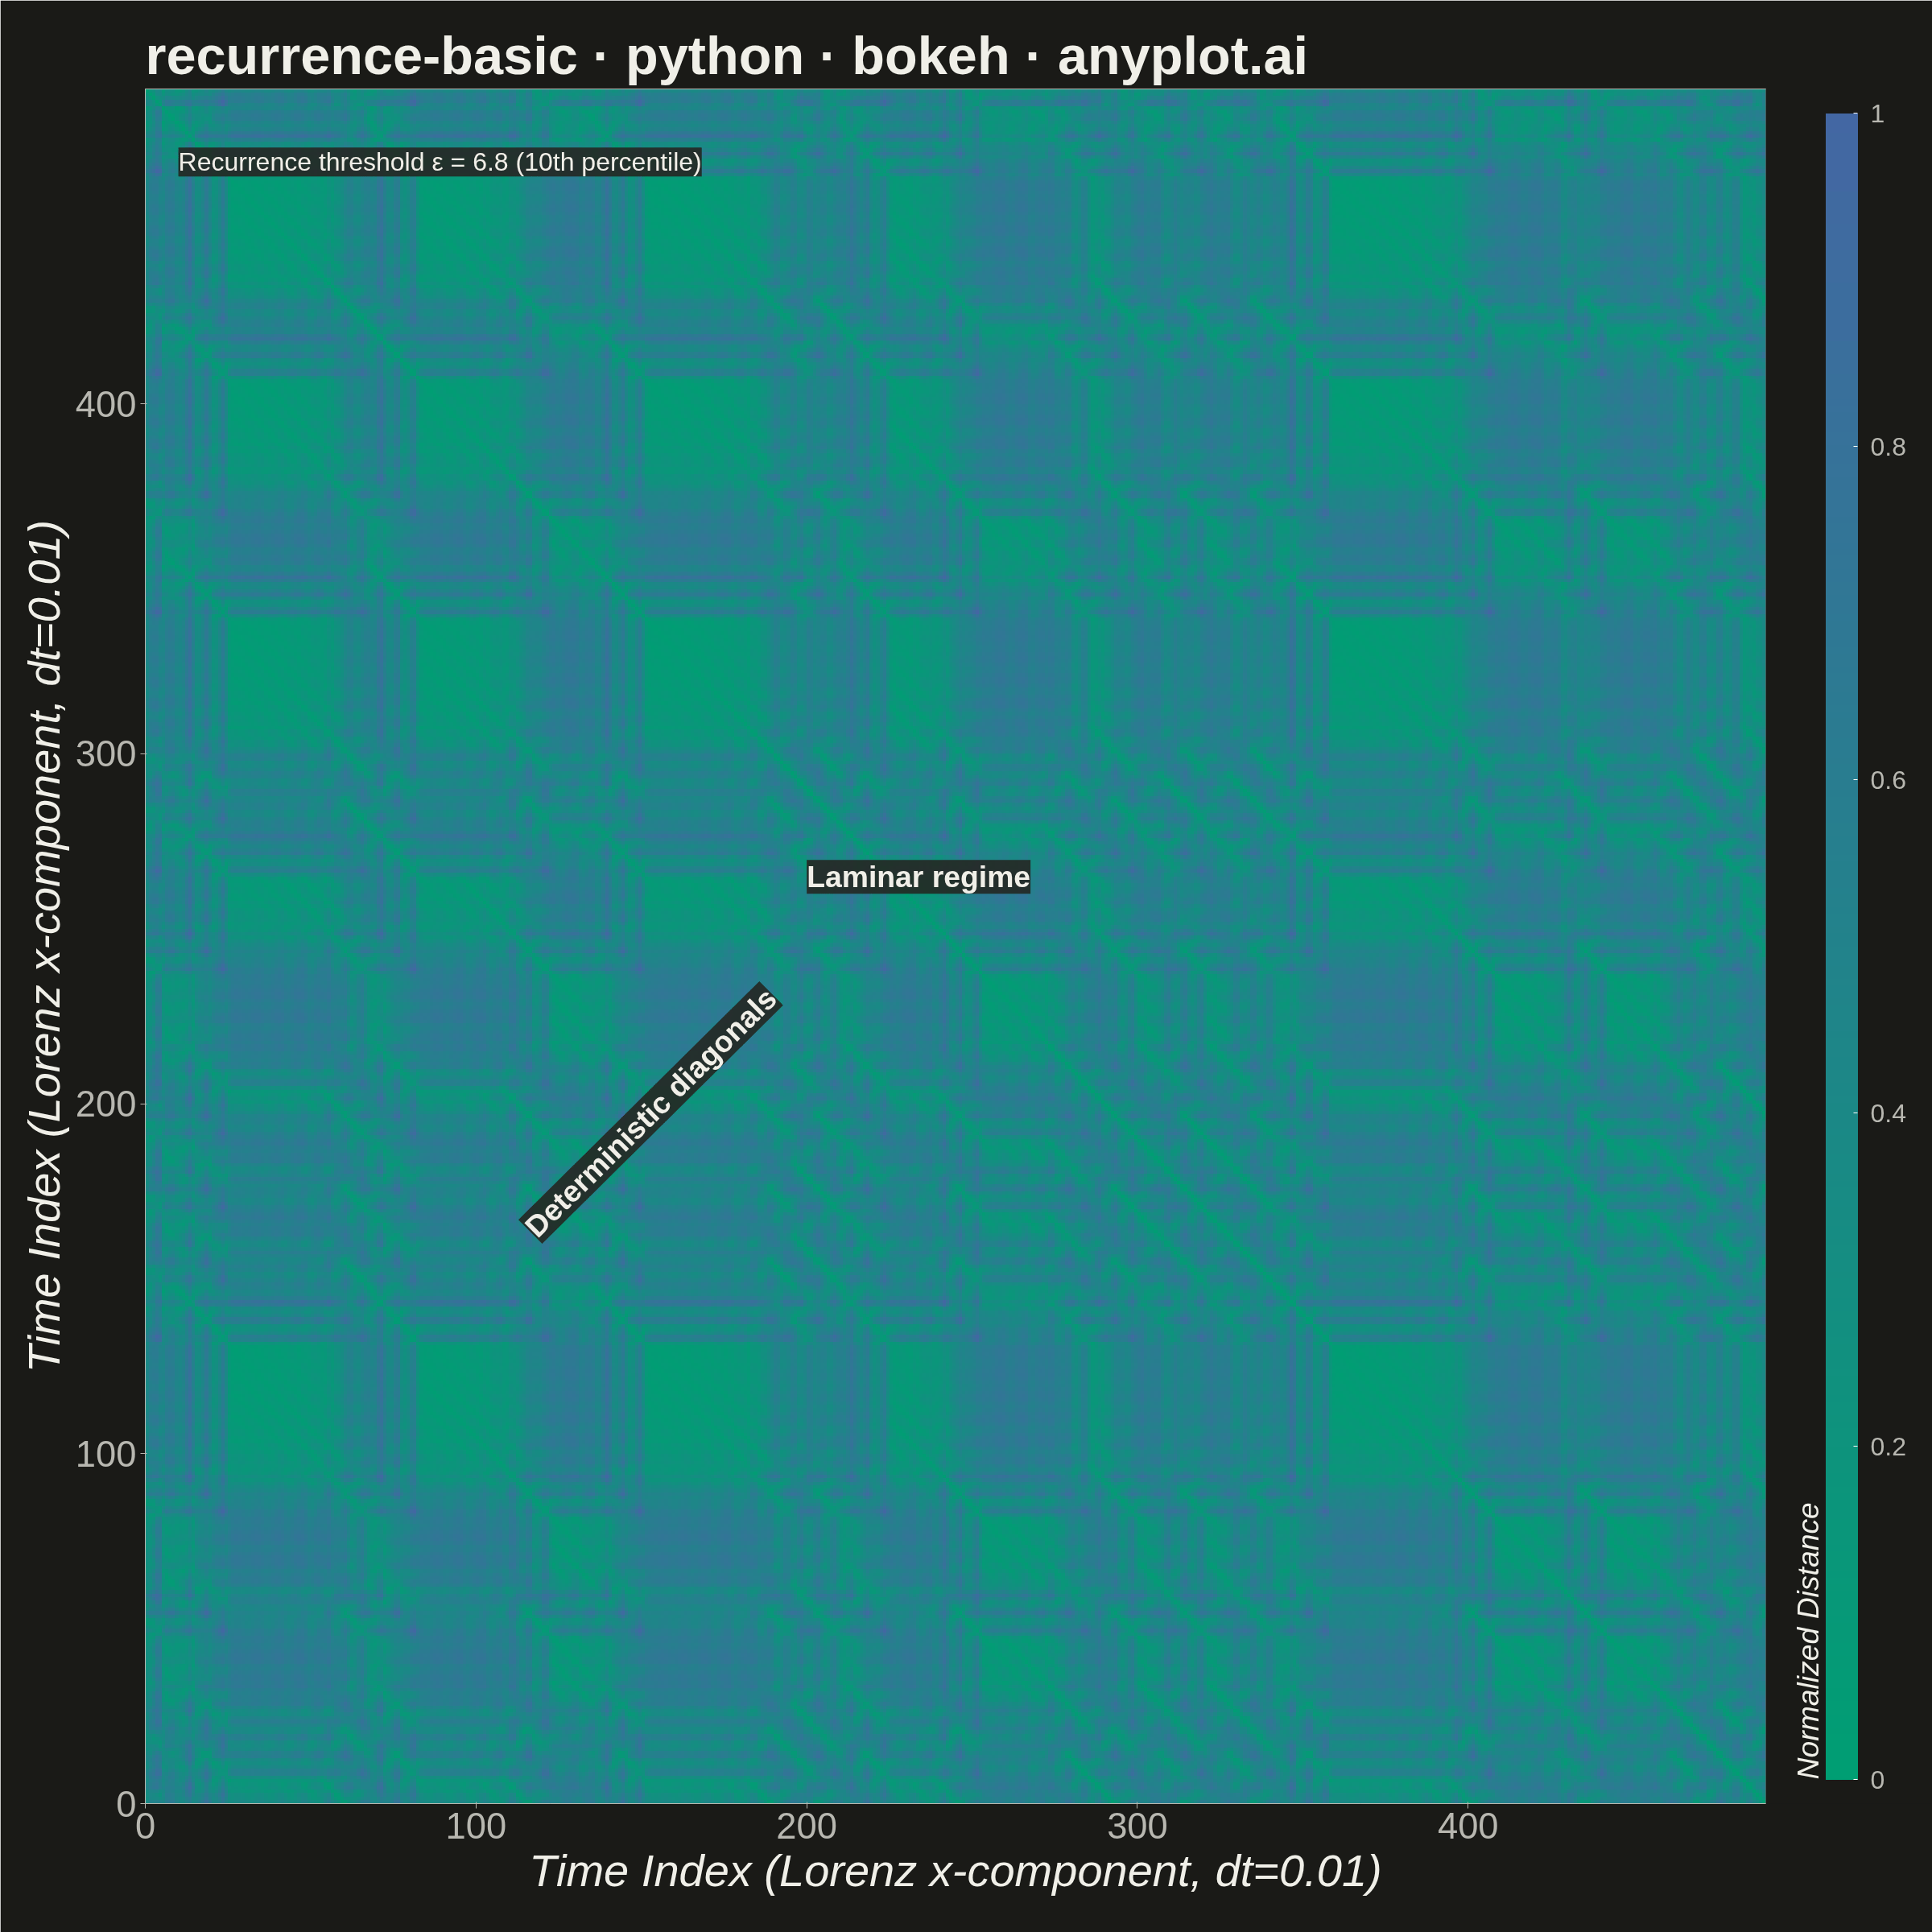
A recurrence plot is a binary or distance-based matrix visualization that reveals when states in a dynamical system recur over time. Both axes represent time indices, and a point is plotted at position (i, j) when the system state at time i is sufficiently similar to the state at time j (distance below a threshold). The resulting symmetric matrix exposes hidden structure in complex, nonlinear dynamics — diagonal lines indicate determinism, vertical/horizontal lines reveal laminar states, and block structures signal regime changes.
""" anyplot.ai
recurrence-basic: Recurrence Plot for Nonlinear Time Series
Library: bokeh 3.9.1 | Python 3.13.13
Quality: 90/100 | Updated: 2026-06-10
"""

import io
import os
import sys
import time
from pathlib import Path

import numpy as np
from PIL import Image


# Workaround: remove current directory from import path to avoid shadowing
# the bokeh package with this file (bokeh.py) when run in-place
original_path = sys.path.copy()
sys.path = [p for p in sys.path if p != "" and not (os.path.isfile(os.path.join(p, "bokeh.py")) if p else False)]

try:
    from bokeh.io import output_file, save
    from bokeh.models import BasicTicker, ColorBar, ColumnDataSource, HoverTool, Label, LinearColorMapper
    from bokeh.plotting import figure
    from bokeh.resources import CDN
    from selenium import webdriver
    from selenium.webdriver.chrome.options import Options
finally:
    sys.path = original_path

# Theme tokens
THEME = os.getenv("ANYPLOT_THEME", "light")
PAGE_BG = "#FAF8F1" if THEME == "light" else "#1A1A17"
ELEVATED_BG = "#FFFDF6" if THEME == "light" else "#242420"
INK = "#1A1A17" if THEME == "light" else "#F0EFE8"
INK_SOFT = "#4A4A44" if THEME == "light" else "#B8B7B0"

# Imprint sequential colormap: brand green → blue (256 stops, single-polarity)
_c0 = np.array([0x00, 0x9E, 0x73])  # #009E73
_c1 = np.array([0x44, 0x67, 0xA3])  # #4467A3
IMPRINT_SEQ256 = [
    "#{:02X}{:02X}{:02X}".format(*(int(round(v)) for v in (_c0 + (_c1 - _c0) * t / 255.0))) for t in range(256)
]

# Data — Lorenz attractor x-component
np.random.seed(42)
dt = 0.01
num_steps = 5000
lx, ly, lz = 1.0, 1.0, 1.0
sigma, rho, beta = 10.0, 28.0, 8.0 / 3.0

trajectory = np.empty(num_steps)
for step in range(num_steps):
    dx = sigma * (ly - lx) * dt
    dy = (lx * (rho - lz) - ly) * dt
    dz = (lx * ly - beta * lz) * dt
    lx, ly, lz = lx + dx, ly + dy, lz + dz
    trajectory[step] = lx

signal = trajectory[::10]
n_points = len(signal)

# Time-delay embedding (Takens' theorem): dim=3, delay=5
tau = 5
dim = 3
n_embedded = n_points - (dim - 1) * tau
embedded = np.empty((n_embedded, dim))
for d in range(dim):
    embedded[:, d] = signal[d * tau : d * tau + n_embedded]

# Pairwise Euclidean distance matrix
diff = embedded[:, np.newaxis, :] - embedded[np.newaxis, :, :]
dist_matrix = np.sqrt(np.sum(diff**2, axis=2))
threshold = np.percentile(dist_matrix, 10)
max_dist = dist_matrix.max()
dist_normalized = dist_matrix / max_dist
dist_flipped = dist_normalized[::-1, :]  # row 0 at top

color_mapper = LinearColorMapper(palette=IMPRINT_SEQ256, low=0.0, high=1.0)

# Plot — square 2400×2400 canonical
n = n_embedded
p = figure(
    width=2400,
    height=2400,
    title="recurrence-basic · python · bokeh · anyplot.ai",
    x_axis_label="Time Index (Lorenz x-component, dt=0.01)",
    y_axis_label="Time Index (Lorenz x-component, dt=0.01)",
    toolbar_location=None,
    tools="",
    x_range=(0, n),
    y_range=(0, n),
    min_border_bottom=160,
    min_border_left=180,
    min_border_top=110,
    min_border_right=50,
)

p.image(image=[dist_flipped], x=0, y=0, dw=n, dh=n, color_mapper=color_mapper)

color_bar = ColorBar(
    color_mapper=color_mapper,
    ticker=BasicTicker(desired_num_ticks=6),
    label_standoff=16,
    border_line_color=None,
    background_fill_color=PAGE_BG,
    location=(0, 0),
    title="Normalized Distance",
    title_text_font_size="28pt",
    title_text_color=INK,
    major_label_text_font_size="24pt",
    major_label_text_color=INK_SOFT,
    width=40,
    padding=30,
)
p.add_layout(color_bar, "right")

p.add_layout(
    Label(
        x=200,
        y=260,
        text="Laminar regime",
        text_font_size="28pt",
        text_color=INK,
        text_font_style="bold",
        background_fill_color=ELEVATED_BG,
        background_fill_alpha=0.88,
    )
)
p.add_layout(
    Label(
        x=120,
        y=160,
        text="Deterministic diagonals",
        text_font_size="28pt",
        text_color=INK,
        text_font_style="bold",
        background_fill_color=ELEVATED_BG,
        background_fill_alpha=0.88,
        angle=0.78,
    )
)
p.add_layout(
    Label(
        x=10,
        y=n - 25,
        text=f"Recurrence threshold ε = {threshold:.1f} (10th percentile)",
        text_font_size="24pt",
        text_color=INK,
        background_fill_color=ELEVATED_BG,
        background_fill_alpha=0.88,
    )
)

# HoverTool via invisible scatter overlay (idiomatic Bokeh for image plots)
hover_step = 20
hover_xs, hover_ys, hover_dists, hover_recs = [], [], [], []
for i in range(0, n, hover_step):
    for j in range(0, n, hover_step):
        hover_xs.append(i + hover_step // 2)
        hover_ys.append(j + hover_step // 2)
        dist_ij = dist_matrix[i, j]
        hover_dists.append(round(float(dist_ij), 2))
        hover_recs.append("Yes" if dist_ij <= threshold else "No")

hover_source = ColumnDataSource(data={"x": hover_xs, "y": hover_ys, "distance": hover_dists, "recurrent": hover_recs})
invisible_scatter = p.scatter(x="x", y="y", source=hover_source, size=hover_step, fill_alpha=0, line_alpha=0)
p.add_tools(
    HoverTool(
        renderers=[invisible_scatter],
        tooltips=[
            ("Time i", "@x"),
            ("Time j", "@y"),
            ("Distance", "@distance"),
            ("Recurrent (d < {:.1f})".format(threshold), "@recurrent"),
        ],
    )
)

# Style — theme-adaptive chrome
p.title.text_font_size = "50pt"
p.title.text_color = INK
p.xaxis.axis_label_text_font_size = "42pt"
p.yaxis.axis_label_text_font_size = "42pt"
p.xaxis.axis_label_text_color = INK
p.yaxis.axis_label_text_color = INK
p.xaxis.major_label_text_font_size = "34pt"
p.yaxis.major_label_text_font_size = "34pt"
p.xaxis.major_label_text_color = INK_SOFT
p.yaxis.major_label_text_color = INK_SOFT
p.xgrid.grid_line_color = None
p.ygrid.grid_line_color = None
p.axis.minor_tick_line_color = None
p.xaxis.axis_line_color = INK_SOFT
p.yaxis.axis_line_color = INK_SOFT
p.xaxis.major_tick_line_color = INK_SOFT
p.yaxis.major_tick_line_color = INK_SOFT
p.outline_line_color = INK_SOFT
p.background_fill_color = PAGE_BG
p.border_fill_color = PAGE_BG

# Save HTML then screenshot with headless Chrome (export_png not used — snap shim fails)
output_file(f"plot-{THEME}.html")
save(p, resources=CDN)

# Window is H+200 tall so the full bokeh canvas renders; PIL crops to W×H.
W, H = 2400, 2400
opts = Options()
for arg in (
    "--headless=new",
    "--no-sandbox",
    "--disable-dev-shm-usage",
    "--disable-gpu",
    f"--window-size={W},{H + 200}",
    "--hide-scrollbars",
    "--force-device-scale-factor=1",
):
    opts.add_argument(arg)
driver = webdriver.Chrome(options=opts)
driver.set_window_size(W, H + 200)
driver.get(f"file://{Path(f'plot-{THEME}.html').resolve()}")
time.sleep(3)
raw = driver.get_screenshot_as_png()
driver.quit()
Image.open(io.BytesIO(raw)).crop((0, 0, W, H)).save(f"plot-{THEME}.png")
Runnable source as JSON, for any HTTP client: https://api.anyplot.ai/specs/recurrence-basic/bokeh/code. Any spec id and library id listed in llms-full.txt fit the same URL shape; every URL below is complete and callable.
{
  "spec_id": "recurrence-basic",
  "language": "python",
  "library": "bokeh",
  "page": "https://anyplot.ai/recurrence-basic/python/bokeh",
  "hub": "https://anyplot.ai/recurrence-basic",
  "code_json": "https://api.anyplot.ai/specs/recurrence-basic/bokeh/code",
  "spec_json": "https://api.anyplot.ai/specs/recurrence-basic",
  "render_light_png": "https://storage.googleapis.com/anyplot-images/plots/recurrence-basic/python/bokeh/plot-light.png",
  "render_dark_png": "https://storage.googleapis.com/anyplot-images/plots/recurrence-basic/python/bokeh/plot-dark.png",
  "interactive_light_html": "https://storage.googleapis.com/anyplot-images/plots/recurrence-basic/python/bokeh/plot-light.html",
  "interactive_dark_html": "https://storage.googleapis.com/anyplot-images/plots/recurrence-basic/python/bokeh/plot-dark.html",
  "quality_score": 90.0,
  "license": "MIT",
  "guide": "https://anyplot.ai/llms.txt"
}
Part of Recurrence Plot for Nonlinear Time Series on anyplot.ai.