The same plot in 13 other libraries — JavaScript: D3.js, Apache ECharts, Highcharts, MUI X Charts; Python: Altair, Bokeh, lets-plot, Matplotlib, Plotly, Pygal, Seaborn; R: ggplot2; Julia: Makie.jl. Compare all 14 side by side: 3D Scatter Plot in Python, R, Julia and JavaScript.
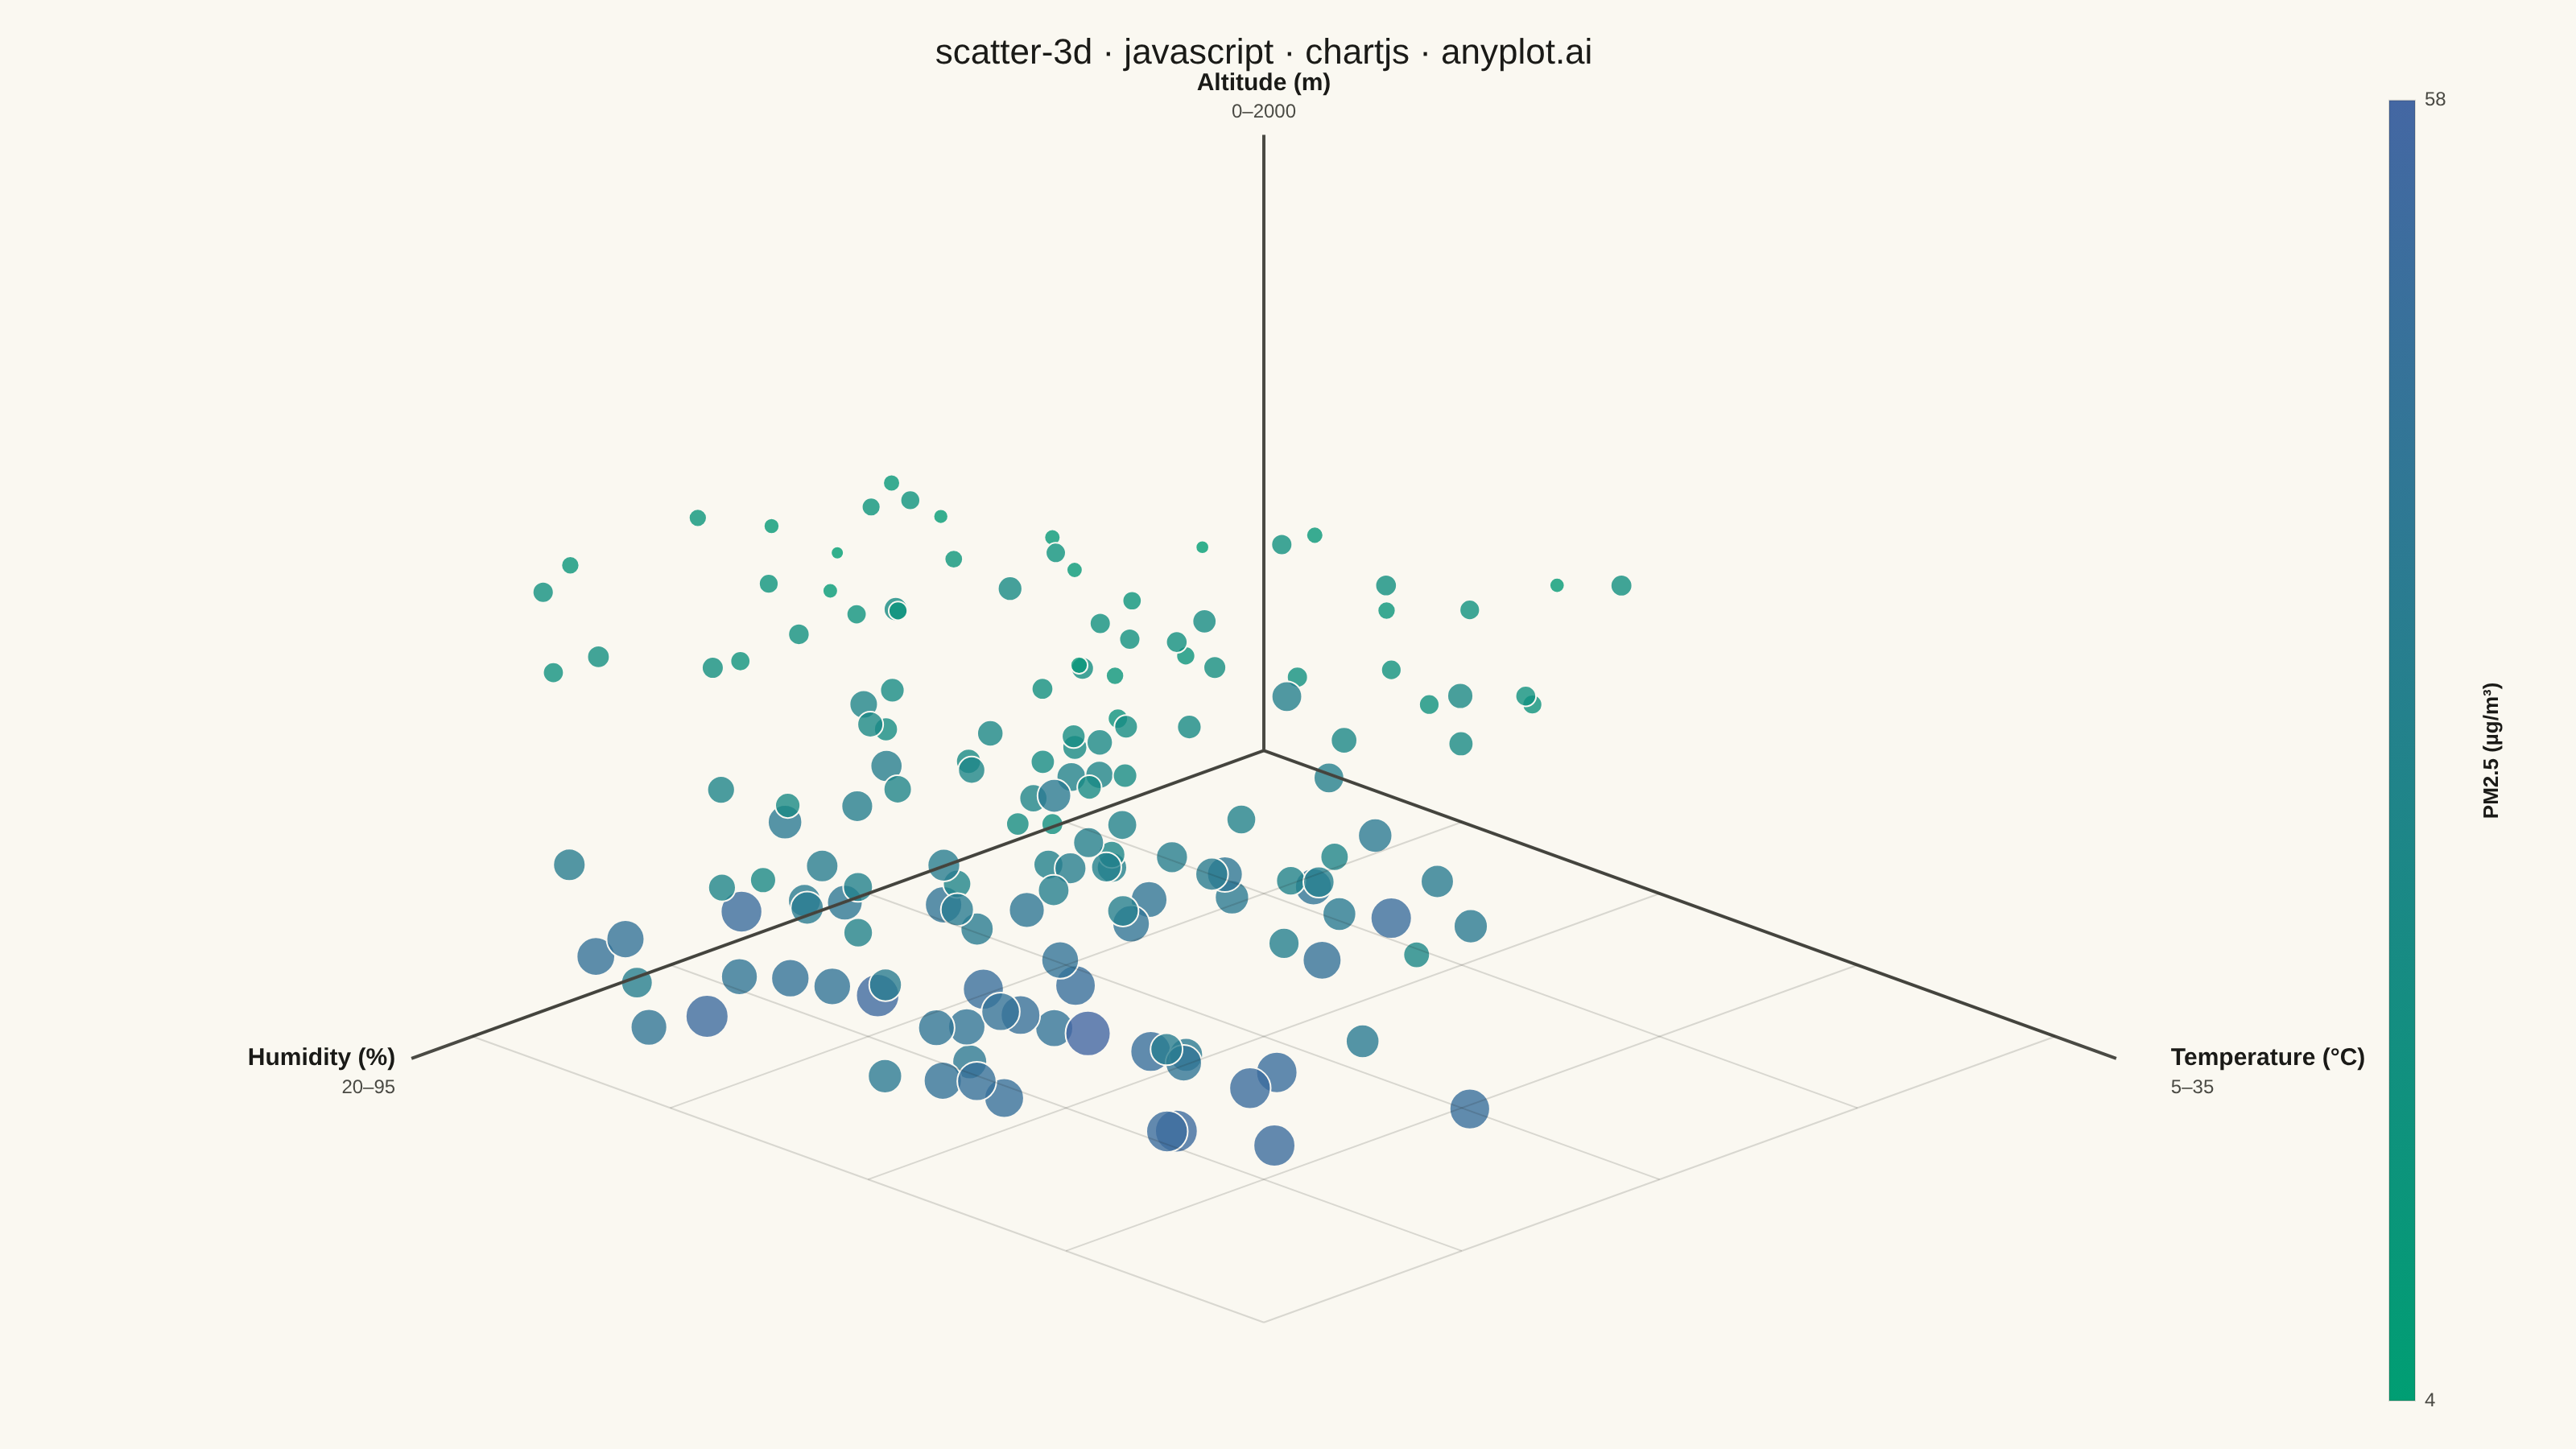
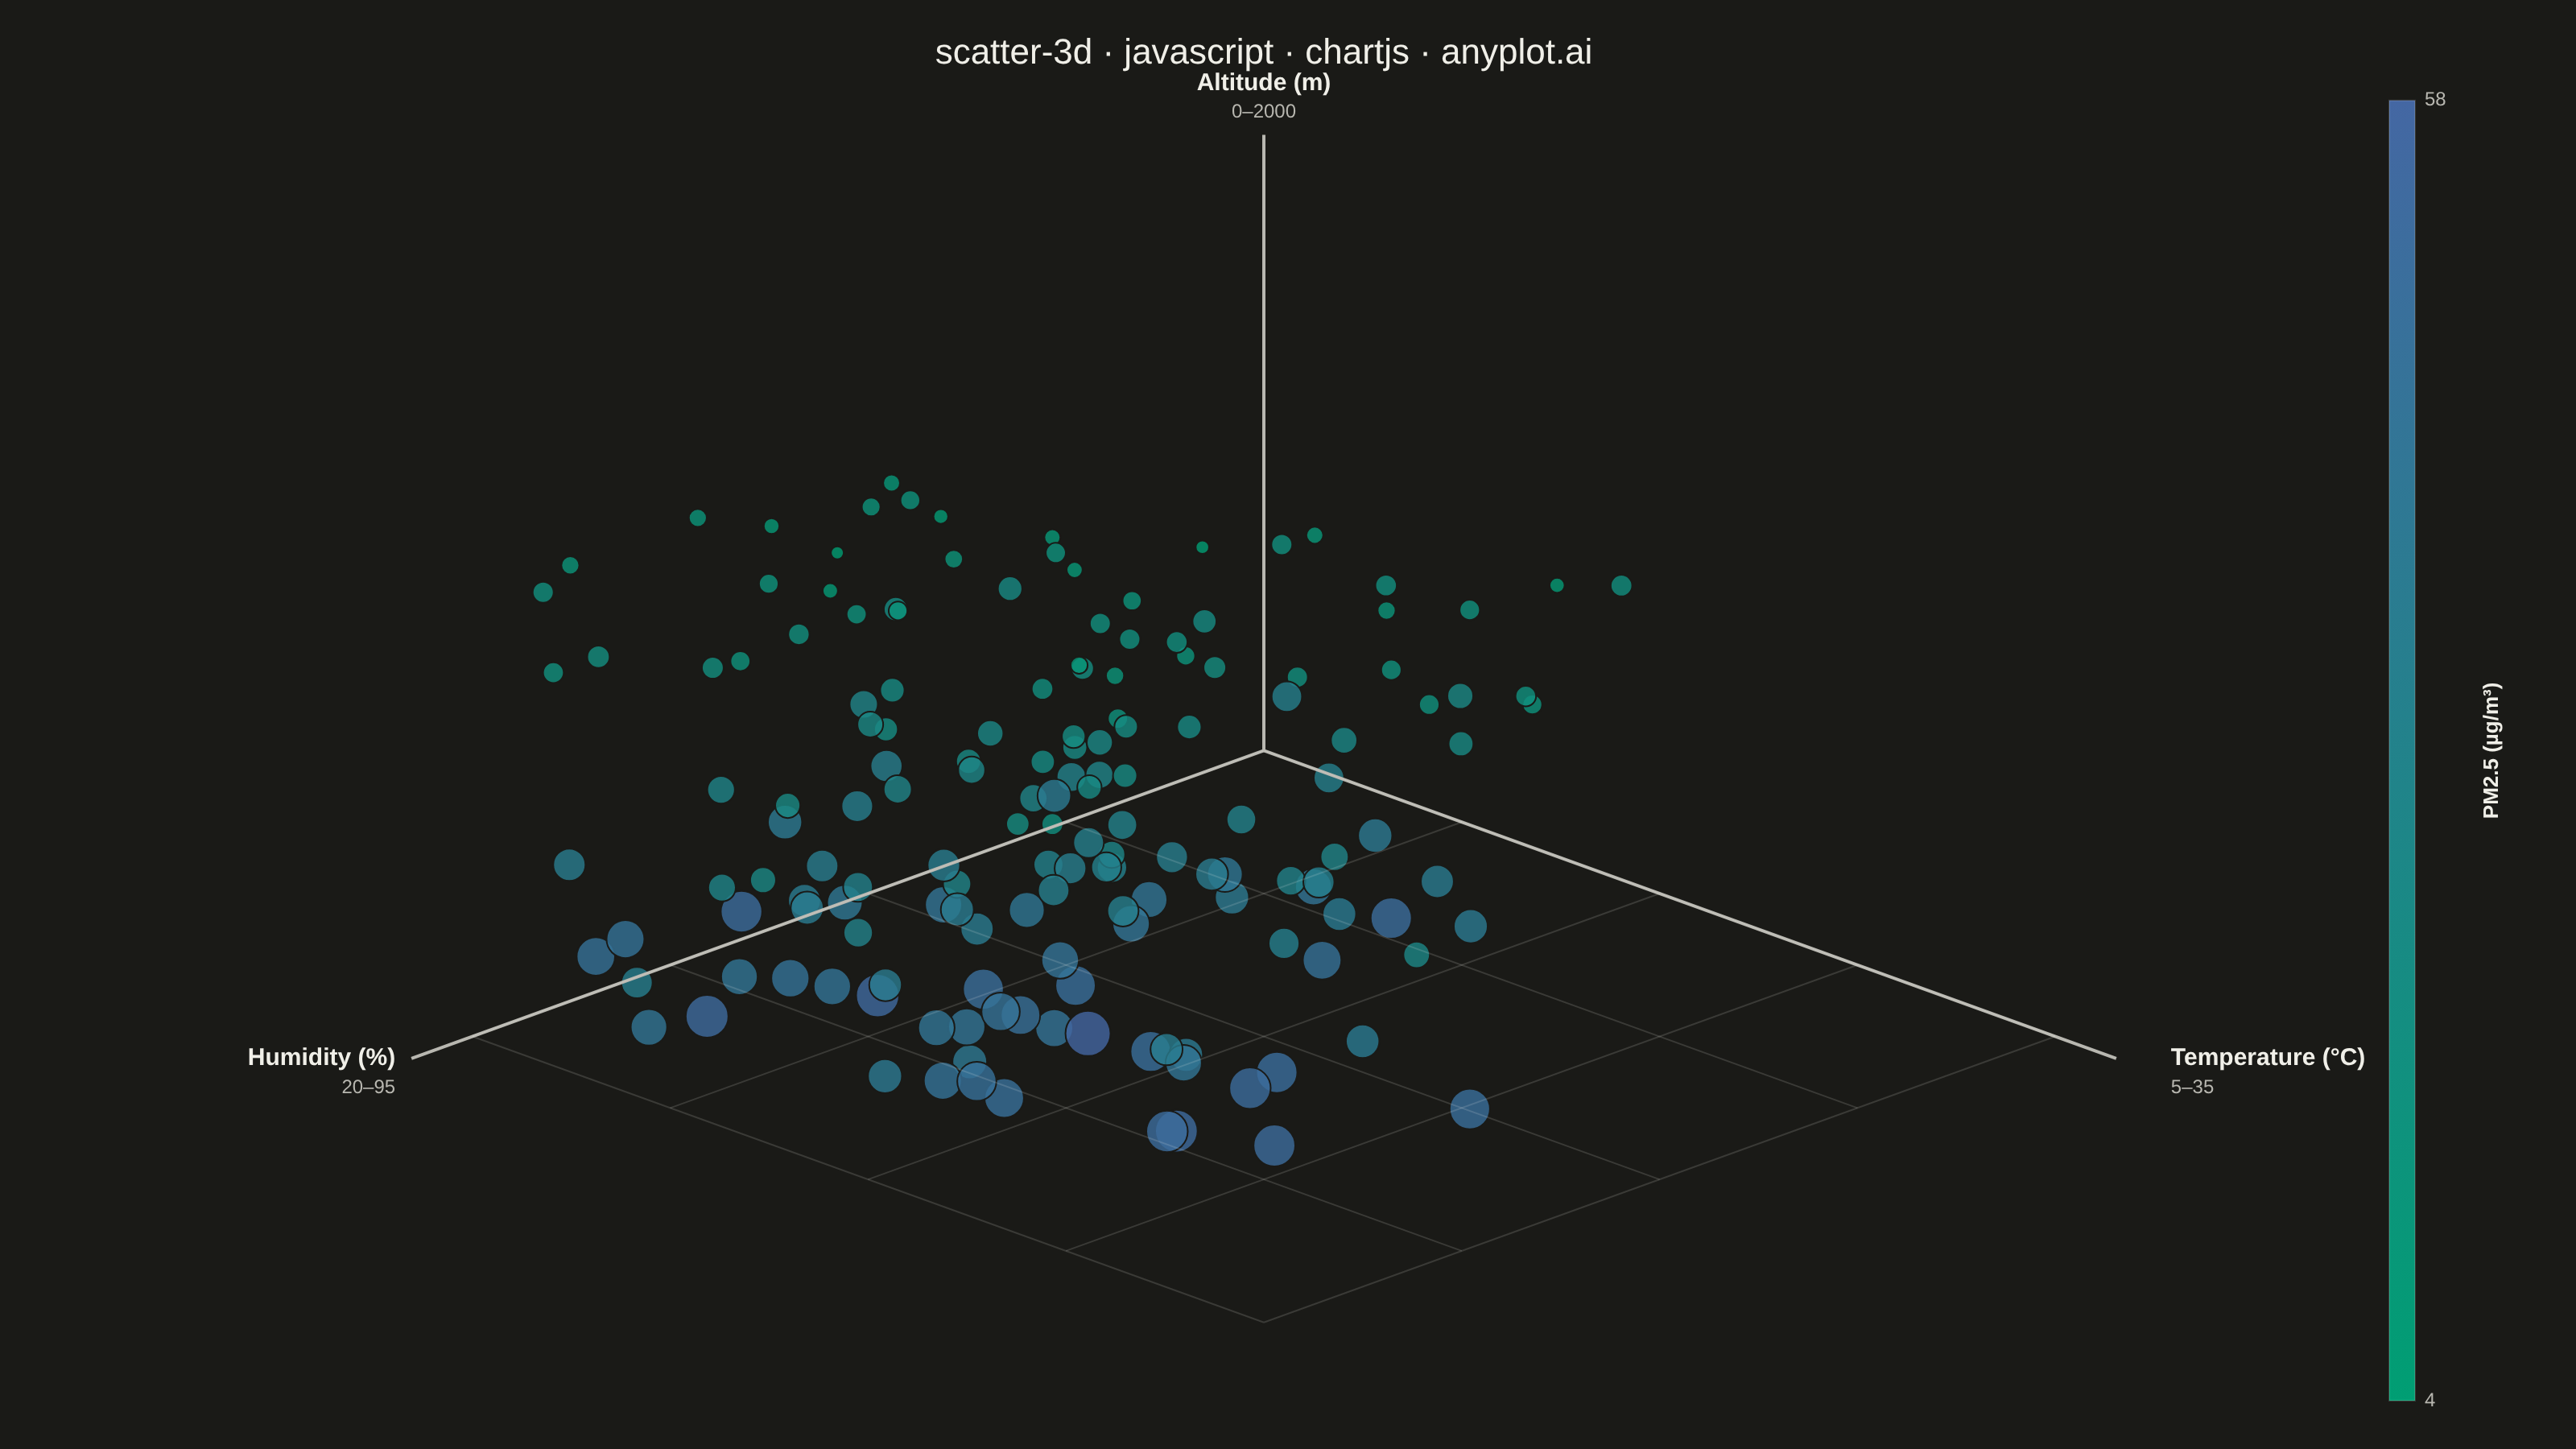
A three-dimensional scatter plot that displays the relationship between three numeric variables by plotting points in 3D space. This visualization extends the classic 2D scatter plot to reveal patterns, clusters, and correlations across three dimensions simultaneously, making it invaluable for multivariate data exploration.
// anyplot.ai
// scatter-3d: 3D Scatter Plot
// Library: chartjs 4.4.7 | JavaScript 22.23.2
// Quality: 89/100 | Created: 2026-09-10

//# anyplot-orientation: landscape
const t = window.ANYPLOT_TOKENS;

// --- Data: air-quality sensor readings, three continuous dimensions --------
// Deterministic seeded LCG (no Math.random — reproducible across renders).
let seed = 42;
const rand = () => {
  seed = (seed * 1664525 + 1013904223) >>> 0;
  return seed / 0x100000000;
};
const gaussian = (mean, std) => {
  const u1 = Math.max(rand(), 1e-9);
  const u2 = rand();
  return mean + std * Math.sqrt(-2 * Math.log(u1)) * Math.cos(2 * Math.PI * u2);
};
const clip = (v, lo, hi) => Math.min(hi, Math.max(lo, v));

const TEMP_MIN = 5, TEMP_MAX = 35; // deg C
const HUM_MIN = 20, HUM_MAX = 95; // %
const ALT_MIN = 0, ALT_MAX = 2000; // m

const N = 160;
const readings = [];
for (let i = 0; i < N; i++) {
  const temperature = clip(gaussian(20, 7), TEMP_MIN, TEMP_MAX);
  const humidity = clip(75 - 0.9 * (temperature - 20) + gaussian(0, 9), HUM_MIN, HUM_MAX);
  const altitude = clip(rand() * ALT_MAX, ALT_MIN, ALT_MAX);
  const pm25 = clip(52 - altitude * 0.021 + (temperature - 20) * 0.35 + gaussian(0, 5), 2, 80);
  readings.push({ temperature, humidity, altitude, pm25 });
}
const PM_MIN = Math.min(...readings.map((r) => r.pm25));
const PM_MAX = Math.max(...readings.map((r) => r.pm25));

// --- Isometric 3D -> 2D projection ------------------------------------------
// x = temperature (floor axis), z = humidity (floor axis), y = altitude (vertical).
// Chart.js has no native 3D scale, so the cube is projected with a standard
// 30-degree isometric transform and rendered on Chart.js's own linear x/y axes.
// WORLD_SCALE is enlarged (10 -> 13) so the fixed-pixel chrome (bubble radii,
// axis overshoot, label offsets) consumes a smaller share of the canvas,
// raising the cube's effective fill of the 3200x1800 render.
const WORLD_SCALE = 13;
const AXIS_OVERSHOOT = WORLD_SCALE + 1;
const COS30 = Math.cos(Math.PI / 6);
const SIN30 = Math.sin(Math.PI / 6);
const toWorld = (r) => ({
  wx: ((r.temperature - TEMP_MIN) / (TEMP_MAX - TEMP_MIN)) * WORLD_SCALE,
  wy: (r.altitude / ALT_MAX) * WORLD_SCALE,
  wz: ((r.humidity - HUM_MIN) / (HUM_MAX - HUM_MIN)) * WORLD_SCALE,
});
const project = (wx, wy, wz) => ({ x: (wx - wz) * COS30, y: wy - (wx + wz) * SIN30 });

// --- Imprint sequential colormap for the 4th variable (PM2.5) --------------
const hexToRgb = (hex) => [
  parseInt(hex.slice(1, 3), 16),
  parseInt(hex.slice(3, 5), 16),
  parseInt(hex.slice(5, 7), 16),
];
const lerpColor = (hexA, hexB, frac, alpha = 1) => {
  const a = hexToRgb(hexA);
  const b = hexToRgb(hexB);
  const mix = a.map((c, i) => Math.round(c + (b[i] - c) * frac));
  return `rgba(${mix[0]}, ${mix[1]}, ${mix[2]}, ${alpha})`;
};

// --- Floor grid (subtle depth cue on the temperature/humidity plane) -------
const GRID_DIVS = [0, WORLD_SCALE * 0.25, WORLD_SCALE * 0.5, WORLD_SCALE * 0.75, WORLD_SCALE];
const gridDatasets = GRID_DIVS.flatMap((v) => [
  { type: "line", data: [project(0, 0, v), project(WORLD_SCALE, 0, v)], borderColor: t.grid, borderWidth: 1, pointRadius: 0, fill: false, tension: 0 },
  { type: "line", data: [project(v, 0, 0), project(v, 0, WORLD_SCALE)], borderColor: t.grid, borderWidth: 1, pointRadius: 0, fill: false, tension: 0 },
]);

// --- Axis spines, overshoot beyond the data range to leave room for labels -
const axisDatasets = [
  { type: "line", data: [project(0, 0, 0), project(AXIS_OVERSHOOT, 0, 0)], borderColor: t.inkSoft, borderWidth: 2, pointRadius: 0, fill: false, tension: 0 },
  { type: "line", data: [project(0, 0, 0), project(0, 0, AXIS_OVERSHOOT)], borderColor: t.inkSoft, borderWidth: 2, pointRadius: 0, fill: false, tension: 0 },
  { type: "line", data: [project(0, 0, 0), project(0, AXIS_OVERSHOOT, 0)], borderColor: t.inkSoft, borderWidth: 2, pointRadius: 0, fill: false, tension: 0 },
];

// --- Data points, painter's-algorithm sorted back-to-front ------------------
// Alpha (~0.8) on the bubble fill reduces overplotting in the densest cluster
// while keeping the border for separation between overlapping bubbles.
const BUBBLE_ALPHA = 0.8;
const points = readings
  .map((r) => {
    const { wx, wy, wz } = toWorld(r);
    const { x, y } = project(wx, wy, wz);
    const frac = (r.pm25 - PM_MIN) / (PM_MAX - PM_MIN);
    return { x, y, r: 4 + frac * 10, depth: wx + wz, color: lerpColor(t.seq[0], t.seq[1], frac, BUBBLE_ALPHA), raw: r };
  })
  .sort((a, b) => a.depth - b.depth);

const pointsDataset = {
  type: "bubble",
  label: "Sensor readings",
  data: points,
  backgroundColor: points.map((p) => p.color),
  borderColor: t.pageBg,
  borderWidth: 1,
};

// --- Custom plugins (canvas-native, no external libraries) -----------------
const axisLabelPlugin = {
  id: "axisLabels3d",
  afterDatasetsDraw(chart) {
    const { ctx, scales } = chart;
    const toPx = (wx, wy, wz) => {
      const p = project(wx, wy, wz);
      return { px: scales.x.getPixelForValue(p.x), py: scales.y.getPixelForValue(p.y) };
    };
    const label = (main, sub, x, y, align) => {
      ctx.textAlign = align;
      ctx.font = "600 15px sans-serif";
      ctx.fillStyle = t.ink;
      ctx.fillText(main, x, y);
      ctx.font = "12px sans-serif";
      ctx.fillStyle = t.inkSoft;
      ctx.fillText(sub, x, y + 18);
    };

    ctx.save();
    ctx.textBaseline = "middle";

    // Extra pixel clearance (vs. the other two labels) because PM2.5 -- and
    // therefore bubble size -- rises with temperature, so the largest bubbles
    // sit closest to this edge of the cube.
    const tempTip = toPx(AXIS_OVERSHOOT, 0, 0);
    label("Temperature (°C)", `${TEMP_MIN}–${TEMP_MAX}`, tempTip.px + 34, tempTip.py, "left");

    const humTip = toPx(0, 0, AXIS_OVERSHOOT);
    label("Humidity (%)", `${HUM_MIN}–${HUM_MAX}`, humTip.px - 10, humTip.py, "right");

    const altTip = toPx(0, AXIS_OVERSHOOT, 0);
    label("Altitude (m)", `${ALT_MIN}–${ALT_MAX}`, altTip.px, altTip.py - 32, "center");

    ctx.restore();
  },
};

const colorbarPlugin = {
  id: "colorbar",
  afterDraw(chart) {
    const { ctx, chartArea } = chart;
    const barWidth = 16;
    const barX = chartArea.right + 44;
    const barTop = chartArea.top + 6;
    const barHeight = chartArea.height - 12;

    ctx.save();
    const gradient = ctx.createLinearGradient(0, barTop, 0, barTop + barHeight);
    gradient.addColorStop(0, t.seq[1]);
    gradient.addColorStop(1, t.seq[0]);
    ctx.fillStyle = gradient;
    ctx.fillRect(barX, barTop, barWidth, barHeight);
    ctx.strokeStyle = t.grid;
    ctx.strokeRect(barX, barTop, barWidth, barHeight);

    ctx.fillStyle = t.inkSoft;
    ctx.font = "12px sans-serif";
    ctx.textAlign = "left";
    ctx.textBaseline = "middle";
    ctx.fillText(`${Math.round(PM_MAX)}`, barX + barWidth + 6, barTop);
    ctx.fillText(`${Math.round(PM_MIN)}`, barX + barWidth + 6, barTop + barHeight);

    ctx.translate(barX + barWidth + 48, barTop + barHeight / 2);
    ctx.rotate(-Math.PI / 2);
    ctx.textAlign = "center";
    ctx.fillStyle = t.ink;
    ctx.font = "600 13px sans-serif";
    ctx.fillText("PM2.5 (µg/m³)", 0, 0);
    ctx.restore();
  },
};

// --- Mount + chart -----------------------------------------------------------
const canvas = document.createElement("canvas");
document.getElementById("container").appendChild(canvas);

const TITLE = "scatter-3d · javascript · chartjs · anyplot.ai";
const TITLE_FONT = TITLE.length > 67 ? Math.max(15, Math.round(22 * (67 / TITLE.length))) : 22;

new Chart(canvas, {
  type: "scatter",
  data: { datasets: [...gridDatasets, ...axisDatasets, pointsDataset] },
  plugins: [axisLabelPlugin, colorbarPlugin],
  options: {
    responsive: true,
    maintainAspectRatio: false,
    animation: false,
    layout: { padding: { top: 10, right: 160, bottom: 24, left: 130 } },
    interaction: { mode: "nearest", intersect: true },
    scales: {
      x: { display: false, grid: { display: false } },
      y: { display: false, grid: { display: false } },
    },
    plugins: {
      title: { display: true, text: TITLE, color: t.ink, font: { size: TITLE_FONT, weight: "500" } },
      legend: { display: false },
      tooltip: {
        filter: (item) => item.dataset.type === "bubble",
        callbacks: {
          title: () => "",
          label: (ctx) => {
            const raw = ctx.raw.raw;
            return [
              `Temperature: ${raw.temperature.toFixed(1)} °C`,
              `Humidity: ${raw.humidity.toFixed(0)} %`,
              `Altitude: ${raw.altitude.toFixed(0)} m`,
              `PM2.5: ${raw.pm25.toFixed(1)} µg/m³`,
            ];
          },
        },
      },
    },
  },
});
Runnable source as JSON, for any HTTP client: https://api.anyplot.ai/specs/scatter-3d/chartjs/code. Any spec id and library id listed in llms-full.txt fit the same URL shape; every URL below is complete and callable.
{
  "spec_id": "scatter-3d",
  "language": "javascript",
  "library": "chartjs",
  "page": "https://anyplot.ai/scatter-3d/javascript/chartjs",
  "hub": "https://anyplot.ai/scatter-3d",
  "code_json": "https://api.anyplot.ai/specs/scatter-3d/chartjs/code",
  "spec_json": "https://api.anyplot.ai/specs/scatter-3d",
  "render_light_png": "https://storage.googleapis.com/anyplot-images/plots/scatter-3d/javascript/chartjs/plot-light.png",
  "render_dark_png": "https://storage.googleapis.com/anyplot-images/plots/scatter-3d/javascript/chartjs/plot-dark.png",
  "interactive_light_html": "https://storage.googleapis.com/anyplot-images/plots/scatter-3d/javascript/chartjs/plot-light.html",
  "interactive_dark_html": "https://storage.googleapis.com/anyplot-images/plots/scatter-3d/javascript/chartjs/plot-dark.html",
  "quality_score": 89.0,
  "license": "MIT",
  "guide": "https://anyplot.ai/llms.txt"
}
Part of 3D Scatter Plot on anyplot.ai.